. 2013 Jun 27;38(6):1211-22.
doi: 10.1016/j.immuni.2013.05.012. Epub 2013 Jun 20.

Dendritic cell expression of the signaling molecule TRAF6 is critical for gut microbiota-dependent immune tolerance

Affiliations

Dendritic cell expression of the signaling molecule TRAF6 is critical for gut microbiota-dependent immune tolerance

Daehee Han et al. Immunity. .

Abstract

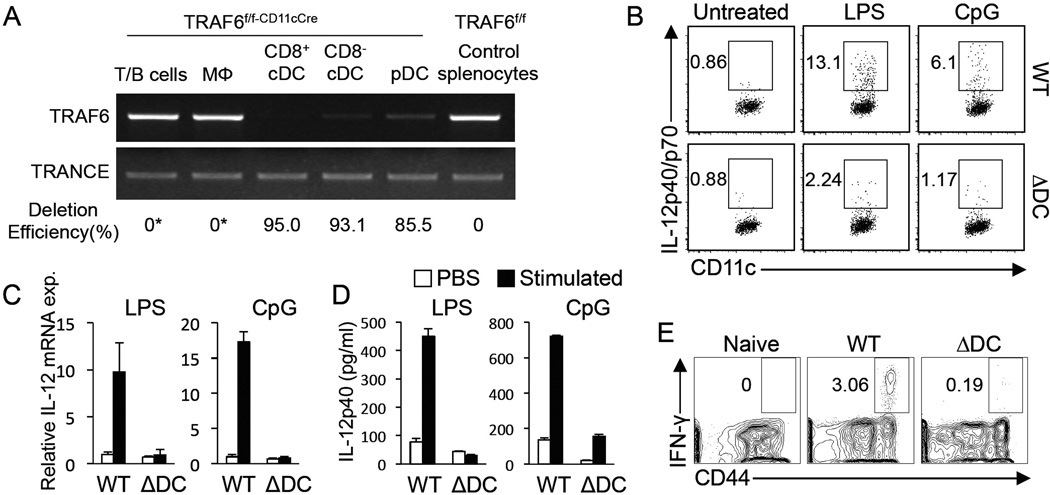
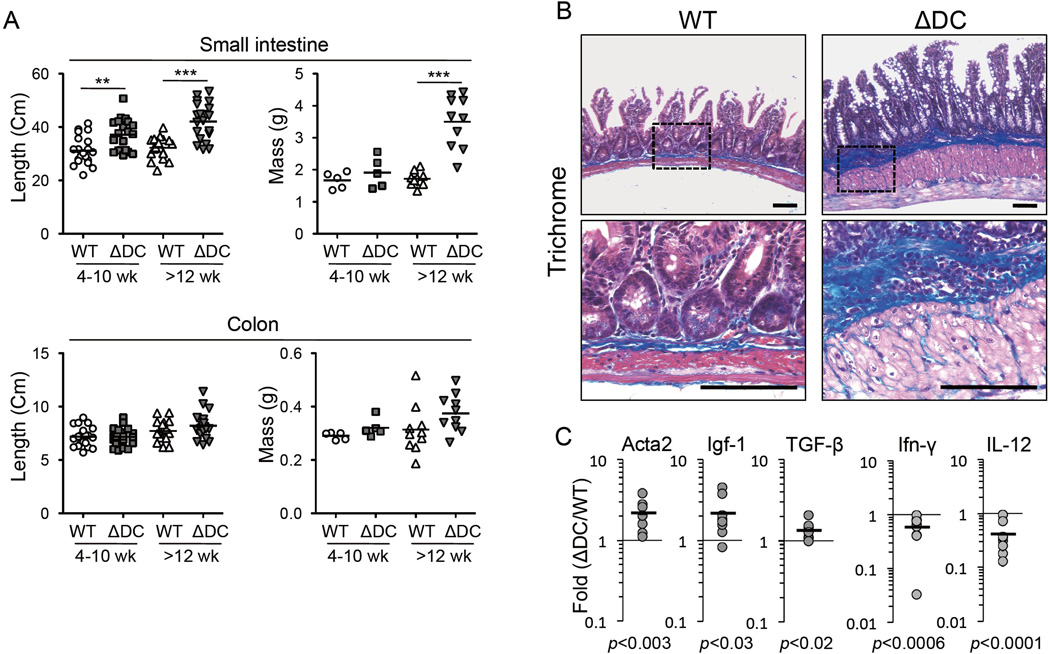
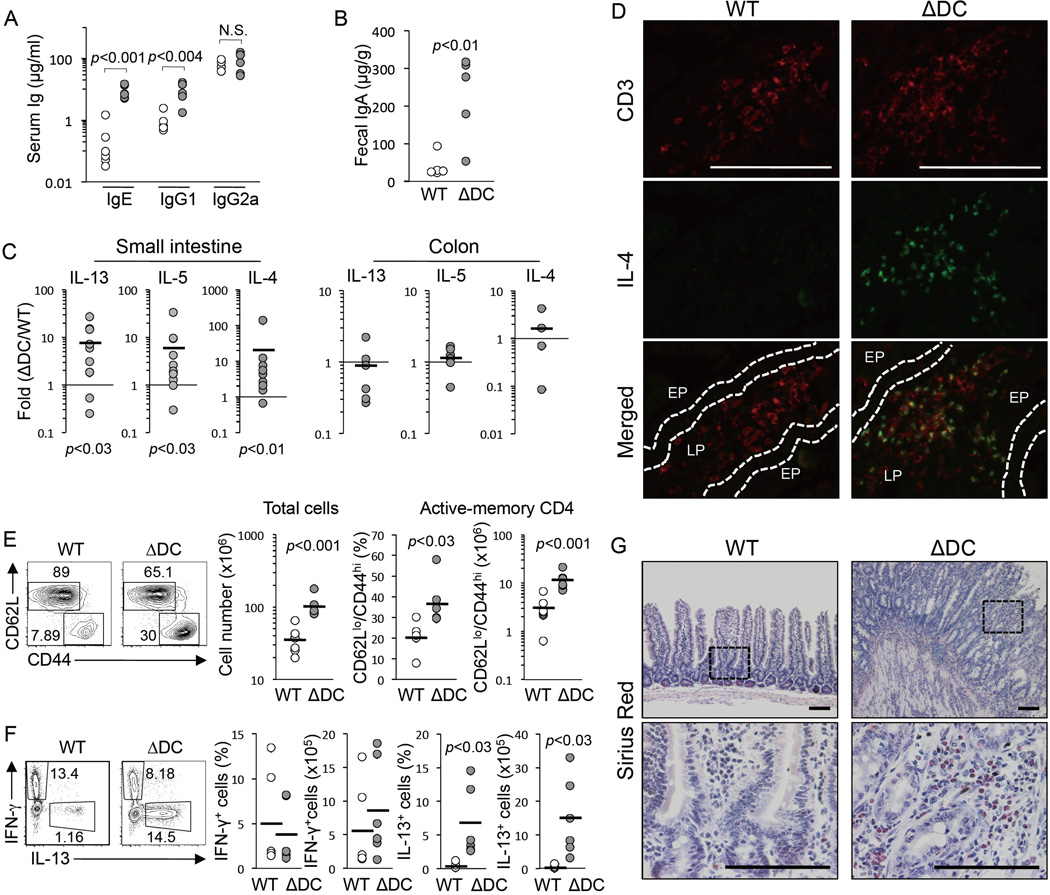
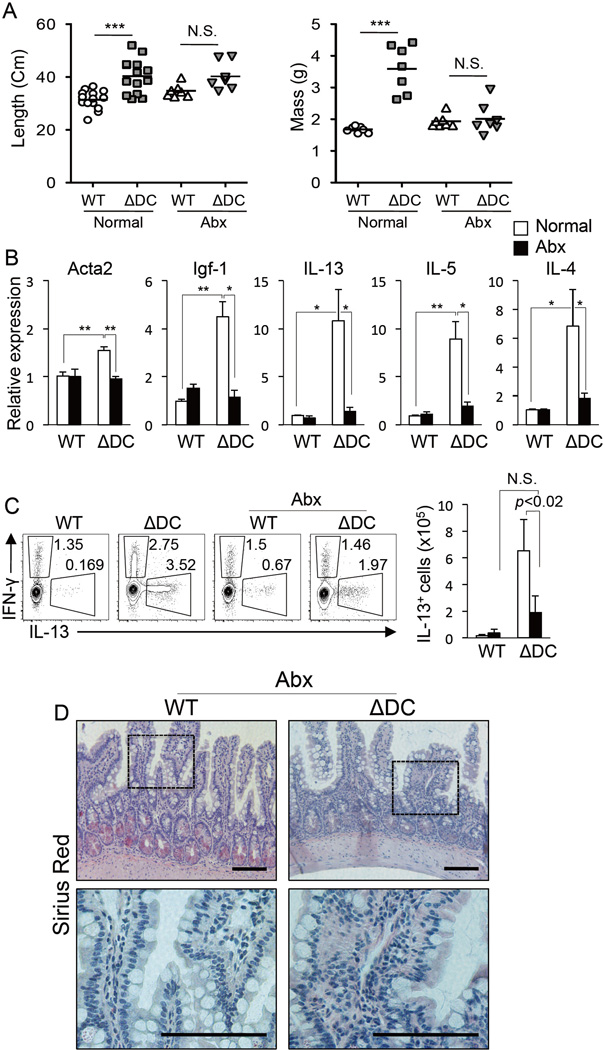
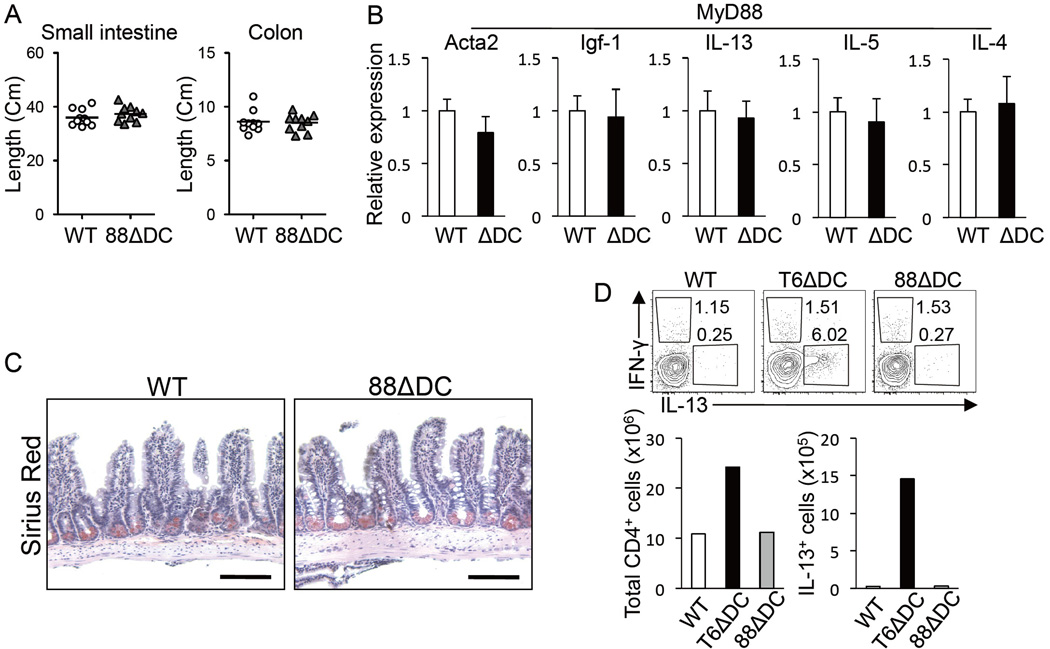
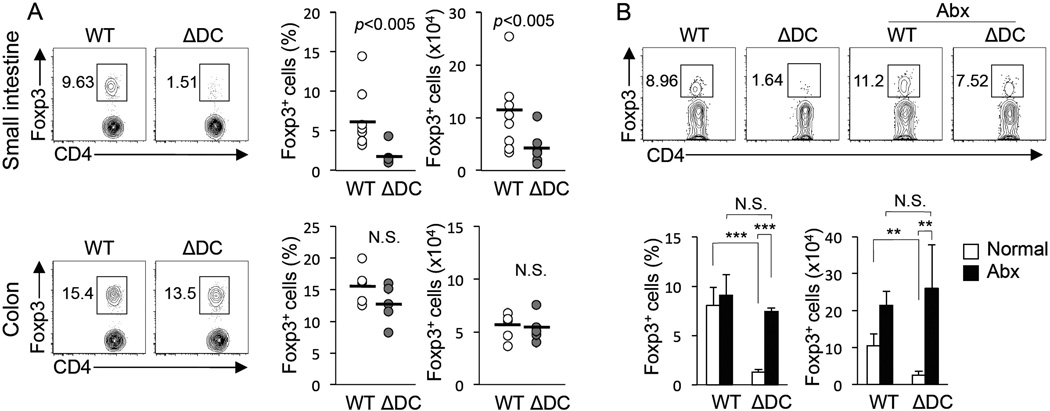
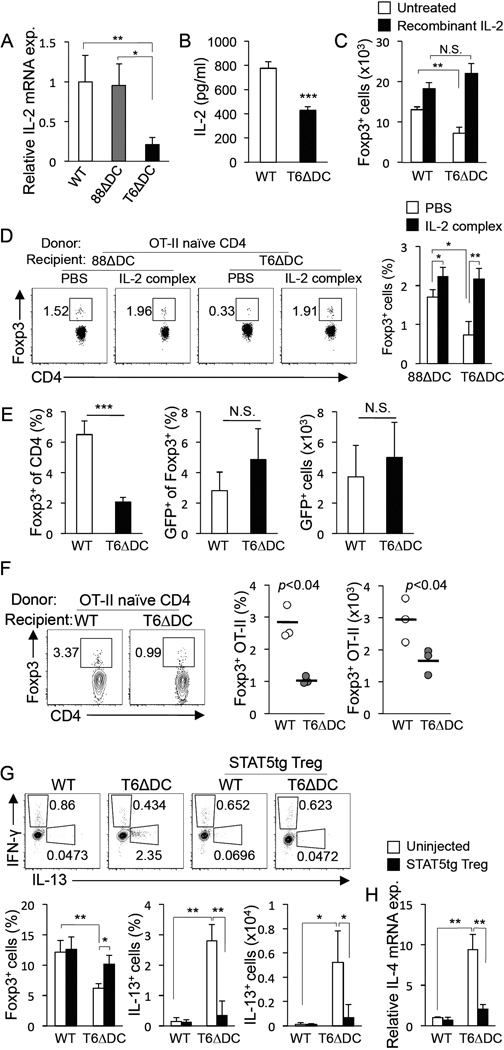
The intracellular signaling molecule TRAF6 is critical for Toll-like receptor (TLR)-mediated activation of dendritic cells (DCs). We now report that DC-specific deletion of TRAF6 (TRAF6ΔDC) resulted, unexpectedly, in loss of mucosal tolerance, characterized by spontaneous development of T helper 2 (Th2) cells in the lamina propria and eosinophilic enteritis and fibrosis in the small intestine. Loss of tolerance required the presence of gut commensal microbiota but was independent of DC-expressed MyD88. Further, TRAF6ΔDC mice exhibited decreased regulatory T (Treg) cell numbers in the small intestine and diminished induction of iTreg cells in response to model antigen. Evidence suggested that this defect was associated with diminished DC expression of interleukin-2 (IL-2). Finally, we demonstrate that aberrant Th2 cell-associated responses in TRAF6ΔDC mice could be mitigated via restoration of Treg cell activity. Collectively, our findings reveal a role for TRAF6 in directing DC maintenance of intestinal immune tolerance through balanced induction of Treg versus Th2 cell immunity.


Figures

Figure 1
Figure 1. Generation of Mice Lacking TRAF6 Specifically in the DC Compartment
(A) Quantitative PCR of the floxed region of the Traf6 gene was performed with genomic DNA from TRAF6ΔDC (TRAF6f/f-CD11cCre) and control (TRAF6f/f) sorted FACS-sorted cells to measure degree of deletion in various cell types. A sequence from the TRANCE (Tnfsf11) gene was used as a control for sample standardization. (*, deletion not detected). (B) IL-12 expression in wild type (WT) or TRAF6ΔDC (ΔDC) mice after i.v. injection with PBS, LPS, or CpG. IL-12p40/p70 was detected by intracellular staining for splenocytes isolated at 2 hours post injection. The representative FACS plots were gated on CD11chiMHC class IIhi DCs. (C and D) IL-12p40 mRNA production after in vitro stimulation of MACS-sorted splenic DCs with LPS or CpG. (C) IL-12p40 expression was determined by Q-PCR from mRNA 1 hour after stimulation. (D) IL-12p40 from culture medium was measured by ELISA 12 hours after stimulation. (E) Intracellular IFN-γ level was determined from splenocytes on 7 days postinfection with LCMV. Shown are representative FACS plots gated on CD4+ T cells. The histograms in (C) and (D) represent mean ± SD (standard deviation). FACS plots in (B) and (E) are representative of at least 3 separate experiments.
Figure 2
Figure 2. TRAF6ΔDC Mice Exhibit Spontaneous Small Intestine Enteritis
(A) Lengths (n=20) and masses (n≥5) of small intestines and colons from littermate control (WT) and TRAF6ΔDC (ΔDC) mice organized according to age at sacrifice. Data were analyzed by one-way ANOVA with Tukey’s post-test of multiple comparisons. (B) Trichrome staining was performed on the muscularis propria of the ileum at 27 weeks of age. Collagen (blue, arrows) from Trichrome staining is a marker for gut fibrosis. Smooth muscle layer (arrowheads) corresponds with red staining in sections. (C) Fold increases in pro- (Acta2, Igf-1, and TGF-β) and anti- (IFN-γ and IL-12) fibrotic markers in mRNA isolated from ileum of TRAF6ΔDC (ΔDC) small intestines were compared to wild type (n≥9; ≥8 week-old littermate groups). Data were analyzed with two-tailed, paired student’s t-tests. **, p< 0.01; ***, p< 0.001. Scale bars, 100 µm. N.S., not significant. See also Figures S1,S2, and S3.
Figure 3
Figure 3. Spontaneous Th2 Cell Responses in the Small Intestine of TRAF6ΔDCMice
Serum (A) and fecal (B) immunoglobulin isotype levels in mice (n≥5; ≥12 week-old littermate groups) were measured by ELISA. (C) Fold increases (between TRAF6ΔDC mice and paired littermate control mice) in IL-13, IL-5, and IL-4 mRNA expression in small intestine (n≥8) or colon (n≥4) tissue as measure by qPCR. (D) Double immunofluorescent staining for CD3 and IL-4. EP, epithelial cell lining. LP, lamina propria. (E and F) Increases of active-memory CD4+ cells and IL-13+ cells in mesenteric lymph nodes of TRAF6ΔDC mice compared to littermate control mice (WT). FACS plots gated on CD4+ T cells, and show population counts and frequencies of (E) naïve (CD44lowCD62Lhi) versus active-memory (CD44hiCD62Llow), and (F) IFN-γ+ and IL-13+ cells (n=6; ≥12 week-old littermate groups). (G) Image of eosinophils (in red) stained with Sirius Red. Eosinophil infiltration is observed in small intestinal sections of TRAF6ΔDC and littermate control (duodenum, 27 weeks old). FACS plots and histogram data are representative of at least 3 separated experiments. Data in (A) and (B) were analyzed with two-tailed, unpaired Student’s t-tests. Data in (C), (E), and (F) were analyzed with two-tailed, paired Student’s t-tests. Scale bars, 100 µm. (See also Supplemental Figure S4). See also Figure S1.
Figure 4
Figure 4. Disruption of TRAF6ΔDC Immune Homeostasis is Gut Microbiota-Dependent
(A) Lengths and masses (n≥7 per group) of small intestines from 8–20 week-old littermate-matched control (WT) and TRAF6ΔDC (ΔDC) mice provided untreated or antibiotics-treated (Abx) water for the final 6 weeks. ***, p<0.001. (B) Fibrosis markers (Acta2 and Igf-1) and Th2 cell cytokines (IL-13, IL-5, and IL-4) mRNA expression level in the ileum region of small intestines from mice treated with full-spectrum antibiotics (Abx). Histograms (mean ± SD) are representative of 3 independent experiments. (C) Intracellular staining for IFN-γ, IL-13, and Foxp3 in mesenteric lymph nodes of antibiotics-treated (Abx) or untreated mice. FACS plots were gated on CD4+ T cells and cell counts of IL-13 producers cell are shown in the histogram. FACS plots are representative of 3 independent experiments. The histograms represent means ± SD. (D) Sirius Red staining of the duodenum region of small intestine from antibiotics-treated (Abx) mice. Antibiotic water containing 1 g/L Ampicillin, 1 g/L Neomycin, 0.5 g/L Vancomycin, 1 g/L Metronidazole was provided ad libitum in water to 14-week-old mice for 6 weeks. Data in (A), (B), and (C) were analyzed by one-way ANOVA with Tukey’s post-test of multiple comparisons. *, p<0.05; **, p<0.01. Scale bars, 100 µm. N.S., not significant. See also Figure S4 and S8.
Figure 5
Figure 5. MyD88ΔDC Mice Do Not Phenocopy Aberrant Immune Homeostasis of TRAF6ΔDC Mice
(A) Length of gut was measured in MyD88ΔDC mice (88ΔDC) and littermate controls (WT). (B) Relative mRNA levels in 20 week-old ileum of MyD88ΔDC mice and littermate controls (WT). The histograms (mean ± SD) are representative of 3 independent experiments. (C) Sirius Red staining was performed in the ileum section of small intestine from 20-week-old mice. (D) FACS plots gated on CD4+ T cells showing Intracellular staining for Th1 and Th2 cell cytokines (IFN-γ and IL-13, respectively) in mesenteric lymph nodes from 20 week-old mice and cytokine-producing cell counts. FACS plots and histogram data are representative of 3 independent experiments. Scale bars, 100 µm.
Figure 6
Figure 6. Microbiota-Dependent Reduction in TRAF6ΔDC Small Intestine Treg Cells
(A) FACS plots gated on CD4+ T cells show intracellular staining for small intestine or colon lamina propria lymphocytes from 6–8 week-old TRAF6ΔDC and littermate control mice and Foxp3+ as a percentage of CD4+ and cell counts. Data were analyzed with two-tailed, paired Student’s t-test. (B) Intracellular staining for Foxp3 in small intestinal lamina propria of antibiotics-treated (Abx) or untreated mice. FACS plots were gated on CD4+ T cells. Water containing 1 g/L Ampicillin, 1 g/L Neomycin, 0.5 g/L Vancomycin, 1 g/L Metronidazole was provided to 4 week-old mice for 2 weeks. The histograms (mean ± SD) were analyzed by one-way ANOVA with Tukey’s post-test of multiple comparisons. FACS plots in (A) and (B) are representative of at least 3 separated experiments. **, p< 0.01; ***, p< 0.001. N.S., not significant. See also Figure S5.
Figure 7
Figure 7. Treg homeostasis and gut immune tolerance in TRAF6ΔDC mice is linked to regulation of DC-expressed IL-2
(A) IL-2 mRNA expression levels in MACS-purified lamina propria DCs from wild type (WT), MyD88ΔDC (88 Δ DC), and TRAF6 Δ DC (T6 Δ DC) mice. (B) ELISA of IL-2 proteins levels elaborated by wild type (WT) and TRAF6ΔDC (Δ DC) lamina propria DCs cultured for 12 hours with 50 ng/mL PMA and 500 ng/mL ionomycin. ***, p<0.001. (C) Counts of Foxp3+ cells converted from naïve-effector OT-II CD4+ T cells after 4 days culture with purified lamina propria DCs (5 × 10⁴ T cells and 5 × 10³ DCs) from wild type (WT) or TRAF6ΔDC (T6ΔDC) (1 µ M OVA 323–332 and 1 ng/ml TGF-β in all cultures) in the presence (IL-2(+)) or absence (IL-2(−)) of 10U/mL recombinant IL-2. (D) FACS plots and histograms show the frequencies of Foxp3+ OT-II donor cells in mesenteric lymph nodes after 5 days of OVA feeding. MyD88ΔDC (88 Δ DC) and TRAF6 Δ DC (T6 Δ DC) mice were used as recipients. IL-2-mAb complex (IL-2 complex) was injected as indicated for the first 3 days of OVA-feeding. (E) FACS sorted Foxp3-GFP+ cells (0.5 × 10⁶) were transferred to WT or TRAF6ΔDC recipients. Cells were isolated and analyzed from small intestinal lamina propria 7 days post transfer. The histograms show the Foxp3-GFP+ (donor) cells as a ratio of total Foxp3+ cells and counts of Foxp3-GFP+ cells in the gut (n=3). (F) Intracellular staining and cell counts of converted donor OT-II cells recovered from mesenteric lymph nodes of mice fed OVA protein for 5 days. FACS plots depict gated CD45.1+ (donor marker) and CD4+ T cells. (G and H) STAT5bCA transgenic Foxp3-GFP+ regulatory T cells (STAT5tg Treg cell) were transferred to TRAF6ΔDC and littermate control recipients. (G) FACS plots showing Intracellular staining for Th1 and Th2 cell cytokines (IFN-γ and IL-13, respectively) 4 weeks post-transfer. The percentages and counts for Foxp3+ or IL-13+ from CD4+ T cells in mesenteric lymph nodes, and (H) Th2 cell cytokine (IL-4) mRNA expression level from ileum of both adoptively-transferred and no transfer control groups. FACS plots and graphs are representative of at least 3 separated experiments. The histograms are represented as mean ± SD. Data in (C), (D), and (G) were analyzed by oneway ANOVA with Tukey’s post-test of multiple comparisons. *, p< 0.05; **, p< 0.01; ***, p< 0.001. N.S., not significant. See also Figure S6 and S7.

References

    1. Agace WW, Persson EK. How vitamin A metabolizing dendritic cells are generated in the gut mucosa. Trends Immunol. 2012;33:42–48. - PubMed
    1. Atarashi K, Nishimura J, Shima T, Umesaki Y, Yamamoto M, Onoue M, Yagita H, Ishii N, Evans R, Honda K, Takeda K. ATP drives lamina propria T(H)17 cell differentiation. Nature. 2008;455:808–812. - PubMed
    1. Atarashi K, Tanoue T, Shima T, Imaoka A, Kuwahara T, Momose Y, Cheng G, Yamasaki S, Saito T, Ohba Y, et al. Induction of colonic regulatory T cells by indigenous Clostridium species. Science. 2011;331:337–341. - PMC - PubMed
    1. Blanchard C, Rothenberg ME. Biology of the eosinophil. Adv Immunol. 2009;101:81–121. - PMC - PubMed
    1. Brand S. Crohn’s disease: Th1, Th17 or both? The change of a paradigm: new immunological and genetic insights implicate Th17 cells in the pathogenesis of Crohn’s disease. Gut. 2009;58:1152–1167. - PubMed

Publication types

MeSH terms

Substances

Supplementary concepts