. 2013 Jul 15;26(1):101-12.
doi: 10.1016/j.devcel.2013.05.020. Epub 2013 Jun 20.

Cell-type-specific profiling of gene expression and chromatin binding without cell isolation: assaying RNA Pol II occupancy in neural stem cells

Affiliations

Cell-type-specific profiling of gene expression and chromatin binding without cell isolation: assaying RNA Pol II occupancy in neural stem cells

Tony D Southall et al. Dev Cell. .

Abstract

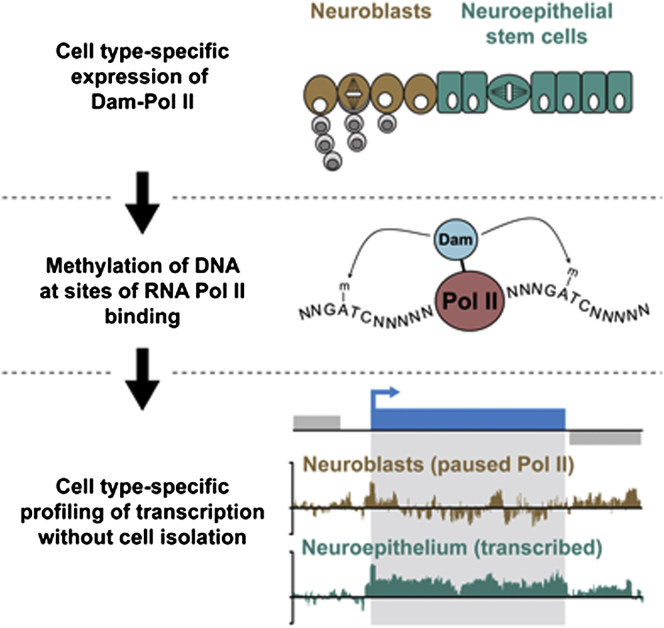
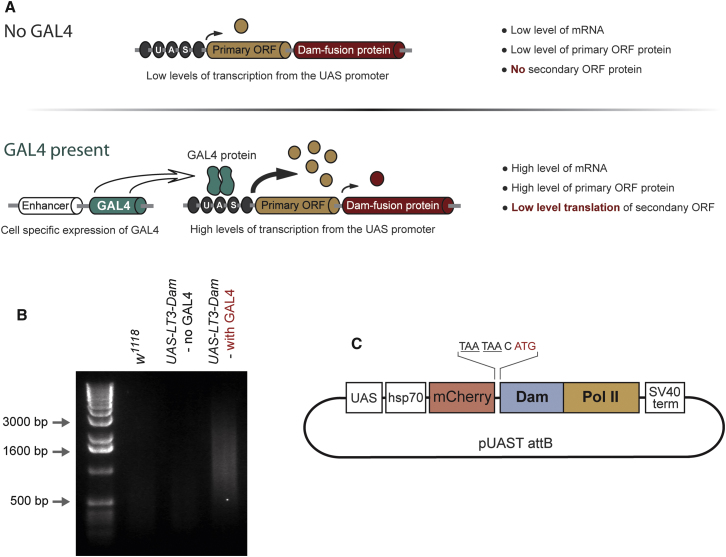
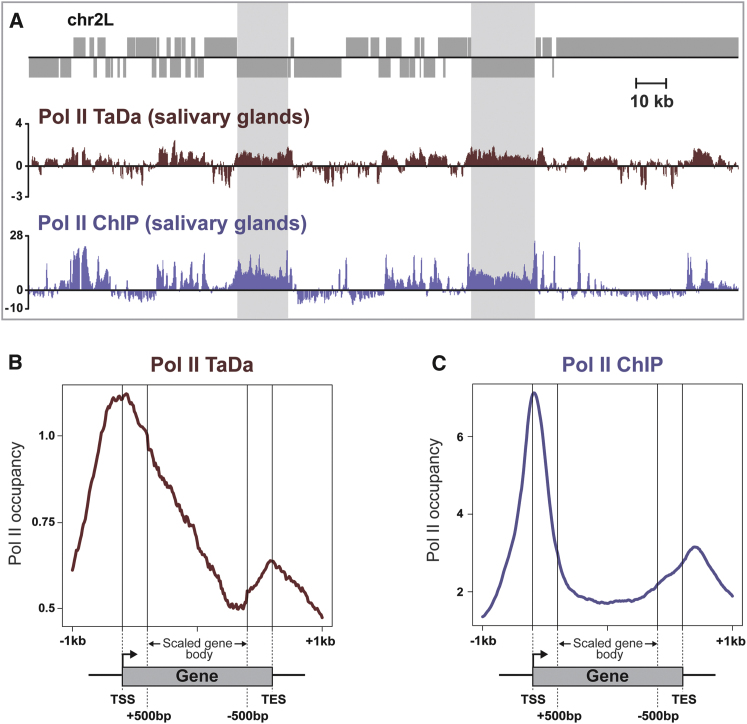
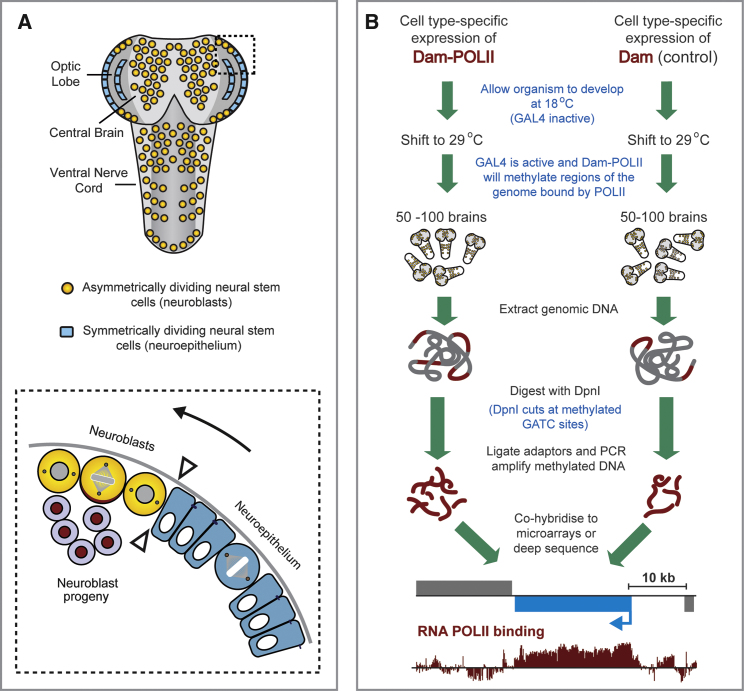
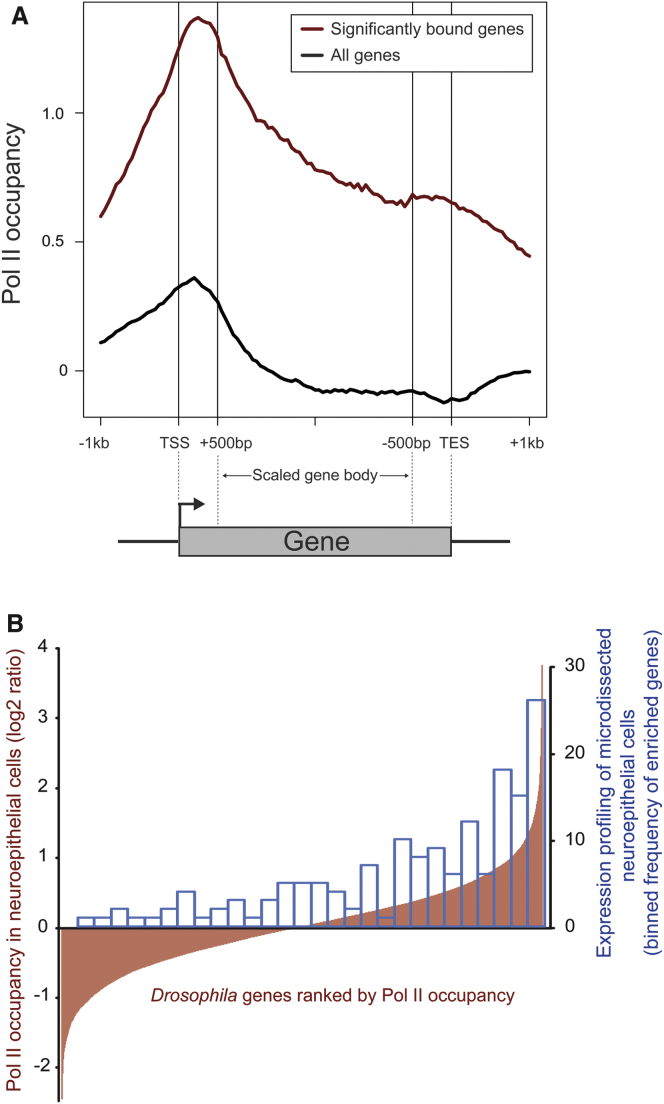
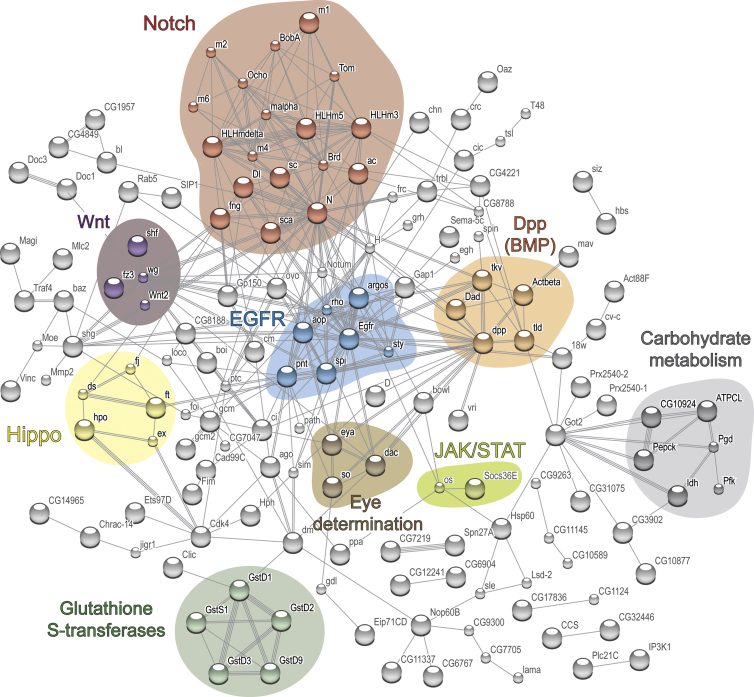
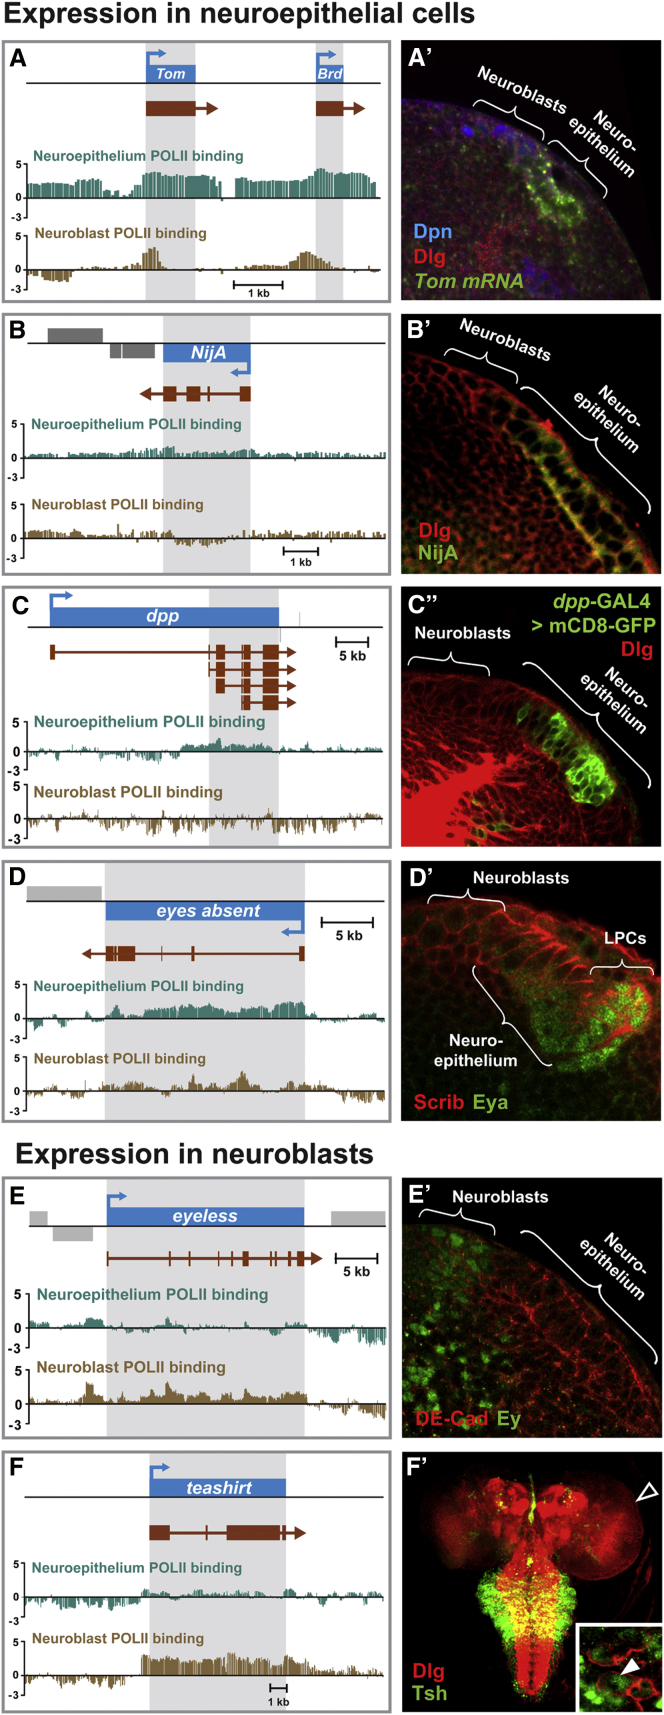
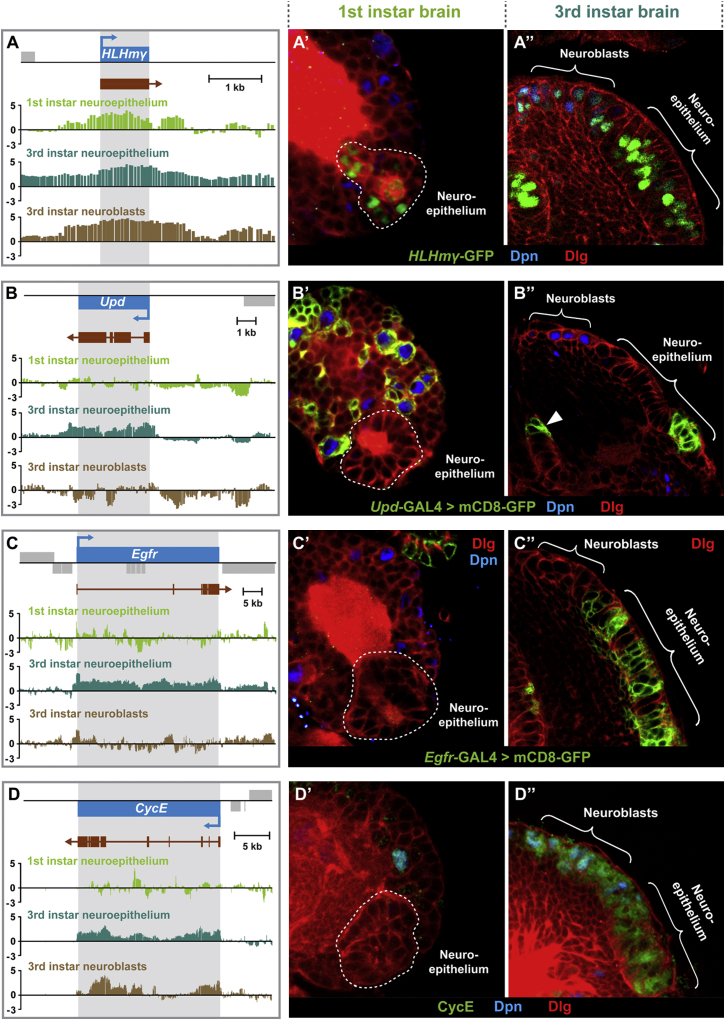
Cell-type-specific transcriptional profiling often requires the isolation of specific cell types from complex tissues. We have developed "TaDa," a technique that enables cell-specific profiling without cell isolation. TaDa permits genome-wide profiling of DNA- or chromatin-binding proteins without cell sorting, fixation, or affinity purification. The method is simple, sensitive, highly reproducible, and transferable to any model system. We show that TaDa can be used to identify transcribed genes in a cell-type-specific manner with considerable temporal precision, enabling the identification of differential gene expression between neuroblasts and the neuroepithelial cells from which they derive. We profile the genome-wide binding of RNA polymerase II in these adjacent, clonally related stem cells within intact Drosophila brains. Our data reveal expression of specific metabolic genes in neuroepithelial cells, but not in neuroblasts, and highlight gene regulatory networks that may pattern neural stem cell fates.


Figures

None
Graphical abstract
Figure 1
Figure 1
TaDa Allows Cell-Type-Specific Profiling of Protein-DNA Interactions (A) Schematic representation of the TaDa method. Translation of the Dam-fusion protein is greatly reduced by the addition of an upstream ORF and by ribosome re-initiation. This prevents expression of the Dam-fusion in uninduced cells and nonspecific methylation in induced cells. (B) Adenine methylated DNA can only be amplified from cells when UAS-LT3-Dam expression is driven by GAL4. DamID samples (from 50 larval brains) were prepared from wild-type (w1118), UAS-LT3-Dam with no GAL4 (w1118x UAS-LT3-DAM), and UAS-LT3-Dam driven in neuroblasts (insc-GAL4 x UAS-LT3-Dam). A small amount of DNA is detectable in the wild-type sample (53 ng/μl) and a similar amount in the w1118x UAS-LT3-DAM sample (49 ng/ul). This DNA is the remaining template genomic DNA plus any nonspecifically amplified DNA (unrelated to adenine methylation). In the presence of GAL4, methylated DNA is observed (301 ng/μl). (C) Design of the TaDa construct for profiling RNA Pol II occupancy in the genome. See also Figure S1.
Figure 2
Figure 2
Dam-Polymerase II Accurately Reflects Endogenous Polymerase II Occupancy (A) Comparison of RNA Pol II occupancy in salivary glands as determined by TaDa and ChIP-seq. (B) Metagene profile for Dam-Pol II across transcribed genes in salivary glands, from 1 kb upstream of the transcription start site (TSS) to 1 kb downstream of the transcription end site (TES). Y axis represents the log2 ratio of Dam-Pol II/Dam. (C) Metagene profile for Pol II ChIP-seq across transcribed genes in salivary glands.
Figure 3
Figure 3
Experimental Design for Assessing RNA Pol II Binding in Clonally Related Stem Cell Populations in the Drosophila Brain (A) The Drosophila developing optic lobe contains symmetrically dividing neural stem cells (neuroepithelium) that undergo a transition (see arrowheads) to asymmetrically dividing stem cells (neuroblasts). (B) Experimental design: a cell-specific GAL4 driver line is used to drive expression of Dam and Dam-Pol II. A temperature sensitive GAL80 is ubiquitously expressed to allow temporal control of expression.
Figure 4
Figure 4
Metagene Profiles of Dam-Pol II Occupancy and Comparison with mRNA Expression Profiling (A) Metagene profiles are shown for all transcribed neuroepithelial genes, and for all genes, from 1 kb upstream of the transcription start site (TSS) to 1 kb downstream of the transcription end site (TES). Y axis represents the log2 ratio of Dam-Pol II/Dam. (B) Comparison of Dam-Pol II occupancy with mRNA expression profiling. All Drosophila genes are represented on the x axis ranked, from left to right, based on Pol II occupancy in the neuroepithelium (log2 ratio of Dam-Pol II/Dam shown on right y axis). In order to compare Pol II data with the 157 genes identified by mRNA expression profiling of neuroepithelial cells (Egger et al., 2010), the frequency of these genes falling into bins of 500 genes on the x axis were calculated (left y axis). See also Tables S1 and S2.
Figure 5
Figure 5
Known and Predicted Interactions between the Products of the 352 Genes Bound Preferentially by Pol II in Neuroepithelial Cells Analysis was performed using STRING with a medium confidence score of 0.4 and all interaction methods available. Clusters representing select signaling pathways, the eye determination pathway, glutathione S-transferases and carbohydrate metabolism genes are highlighted. Single nodes are not displayed. See also Figure S2 and Table S2.
Figure 6
Figure 6
Cell-Type-Specific Differences in RNA Pol II Occupancy Reflect Differences in Gene Expression (A–F) Differential Pol II occupancy in neuroepithelial cells and neuroblasts. Scale bars represent log2 ratio change between Dam-Pol II and Dam (reference) samples. (A′–F′) Expression patterns of the respective genes in the larval brain and ventral nerve cord. See also Figure S3 and Table S2.
Figure 7
Figure 7
Temporal and Cell-Type-Specific Differences in RNA Pol II Occupancy Reflect Differences in Gene Expression (A–D) Pol II occupancy in first instar larval neuroepithelial cells, third instar larval neuroepithelial cells, and neuroblasts. Scale bars represent log2 ratio change between Dam-Pol II and Dam (reference) samples. (A′–D′) Expression patterns of the respective genes in the first instar larval brain. (A″–D″) Expression patterns of the respective genes in the third instar larval brain. See also Figure S3 and Table S2.

References

    1. Almeida M.S., Bray S.J. Regulation of post-embryonic neuroblasts by Drosophila Grainyhead. Mech. Dev. 2005;122:1282–1293. - PubMed
    1. Bardin A.J., Schweisguth F. Bearded family members inhibit Neuralized-mediated endocytosis and signaling activity of Delta in Drosophila. Dev. Cell. 2006;10:245–255. - PubMed
    1. Bianchi-Frias D., Orian A., Delrow J.J., Vazquez J., Rosales-Nieves A.E., Parkhurst S.M. Hairy transcriptional repression targets and cofactor recruitment in Drosophila. PLoS Biol. 2004;2:E178. - PMC - PubMed
    1. Bischof J., Maeda R.K., Hediger M., Karch F., Basler K. An optimized transgenesis system for Drosophila using germ-line-specific phiC31 integrases. Proc. Natl. Acad. Sci. USA. 2007;104:3312–3317. - PMC - PubMed
    1. Bonn S., Zinzen R.P., Girardot C., Gustafson E.H., Perez-Gonzalez A., Delhomme N., Ghavi-Helm Y., Wilczyński B., Riddell A., Furlong E.E. Tissue-specific analysis of chromatin state identifies temporal signatures of enhancer activity during embryonic development. Nat. Genet. 2012;44:148–156. - PubMed

Publication types

MeSH terms