. 2013 Aug 21:1527:199-208.
doi: 10.1016/j.brainres.2013.06.012. Epub 2013 Jun 19.

Correlated sodium and potassium imbalances within the ischemic core in experimental stroke: a 23Na MRI and histochemical imaging study

Affiliations

Correlated sodium and potassium imbalances within the ischemic core in experimental stroke: a 23Na MRI and histochemical imaging study

Victor E Yushmanov et al. Brain Res. .

Abstract

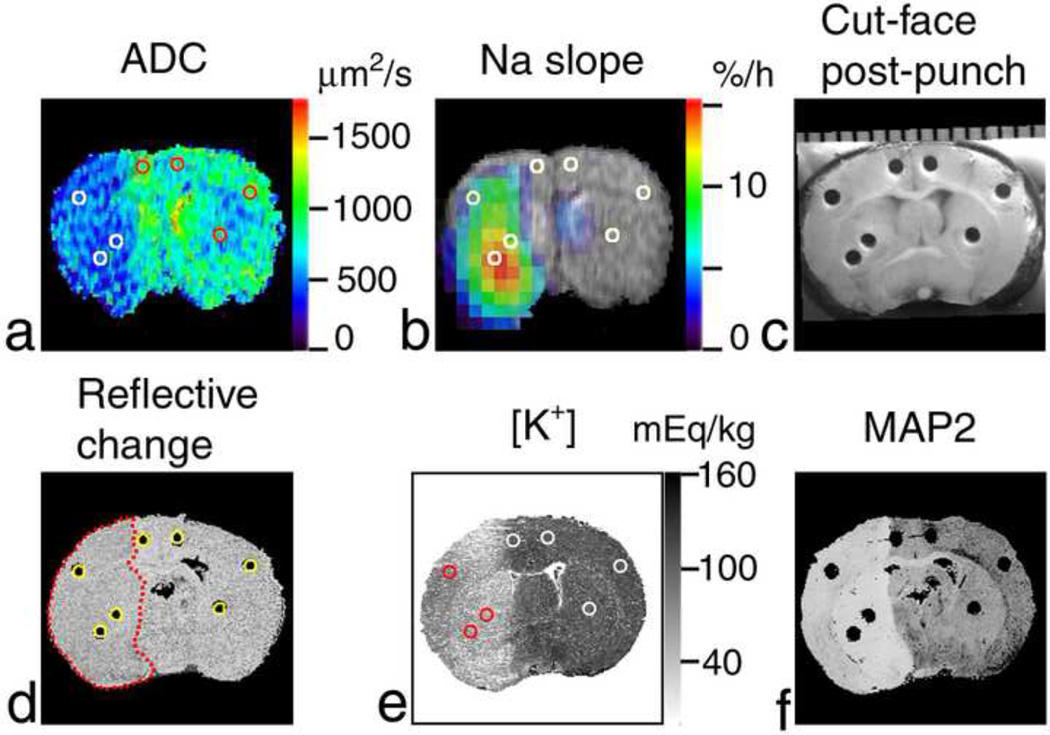
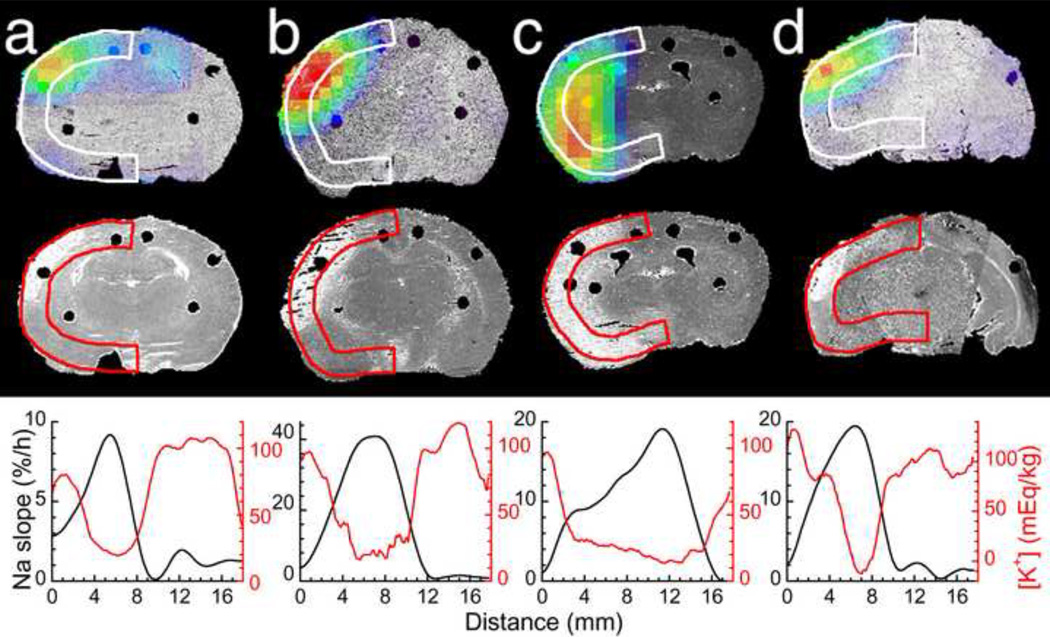
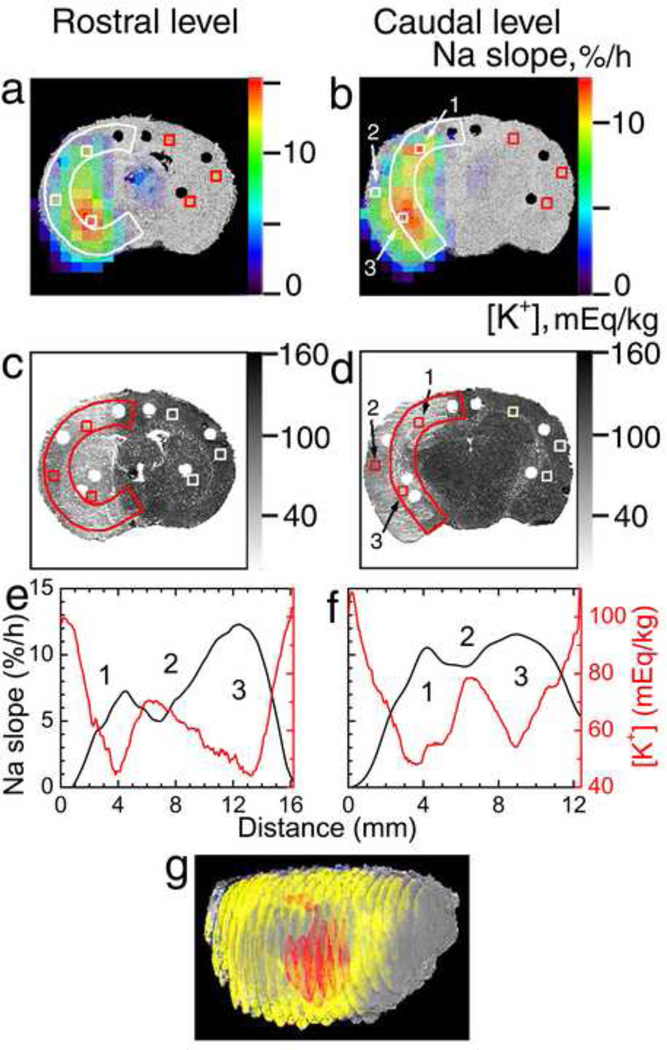
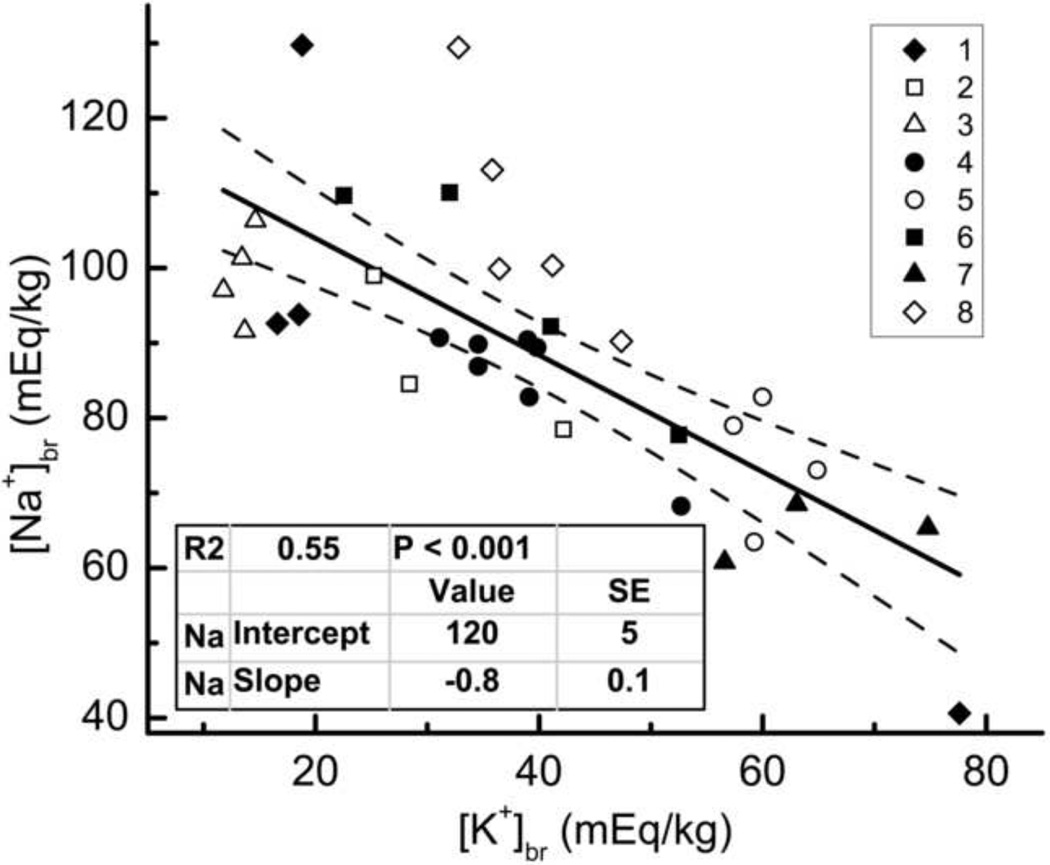
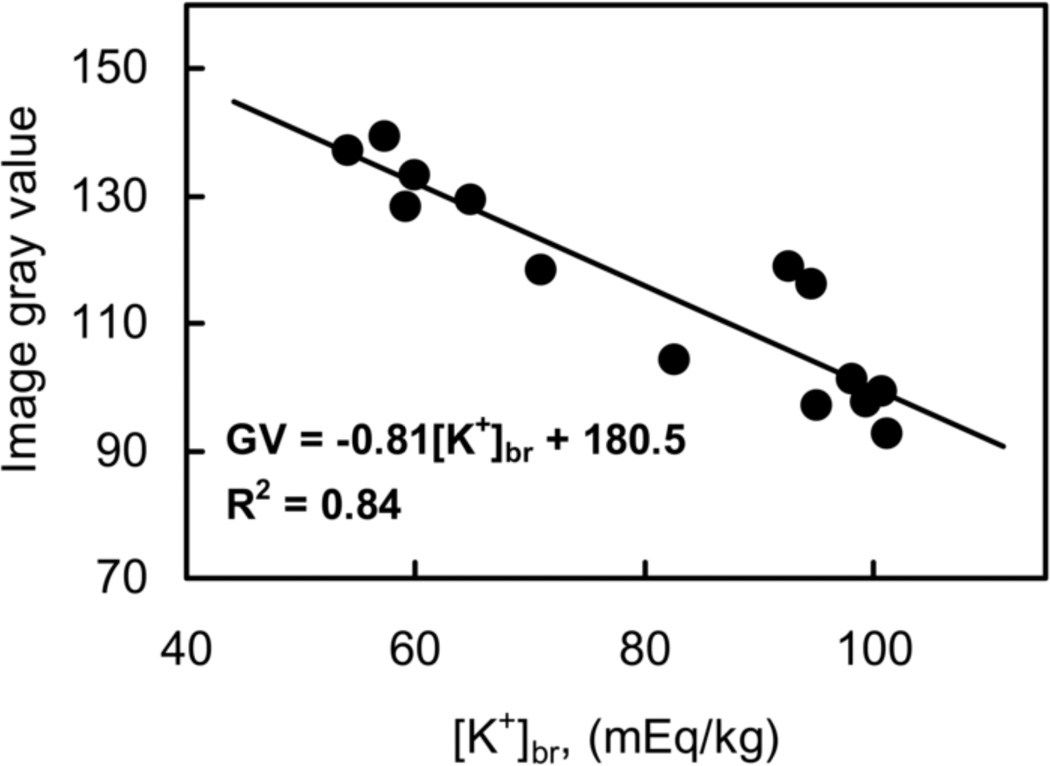
This study addresses the spatial relation between local Na(+) and K(+) imbalances in the ischemic core in a rat model of focal ischemic stroke. Quantitative [Na(+)] and [K(+)] brain maps were obtained by (23)Na MRI and histochemical K(+) staining, respectively, and calibrated by emission flame photometry of the micropunch brain samples. Stroke location was verified by diffusion MRI, by changes in tissue surface reflectivity and by immunohistochemistry with microtubule-associated protein 2 antibody. Na(+) and K(+) distribution within the ischemic core was inhomogeneous, with the maximum [Na(+)] increase and [K(+)] decrease typically observed in peripheral regions of the ischemic core. The pattern of the [K(+)] decrease matched the maximum rate of [Na(+)] increase ('slope'). Some residual mismatch between the sites of maximum Na(+) and K(+) imbalances was attributed to the different channels and pathways involved in transport of the two ions. A linear regression of the [Na(+)]br vs. [K(+)]br in the samples of ischemic brain indicates that for each K(+) equivalent leaving ischemic tissue, 0.8±0.1 Eq, on average, of Na(+) enter the tissue. Better understanding of the mechanistic link between the Na(+) influx and K(+) egress would validate the (23)Na MRI slope as a candidate biomarker and a complementary tool for assessing ischemic damage and treatment planning.

Keywords: (23)Na MRI; 3D; ADC; BBB; Focal ischemia; MAP2; MCA, MCAO, MCAT; Permanent MCAO; RF; ROI; Rat brain; Tissue potassium; Tissue sodium; [Na(+)](br) and [K(+)](br); apparent diffusion coefficient; blood–brain barrier; brain tissue sodium and potassium concentration, respectively; microtubule-associated protein 2; middle cerebral artery, MCA occlusion, and MCA transection with bilateral common carotid artery occlusion, respectively; radiofrequency; region of interest; three-dimensional.


Figures

Figure 1
Figure 1
Region-of-interest (ROI) analysis of Na+ accumulation and K+ drop in a rat brain after MCAO. Coronal images of the brain (at approximately bregma −0.4 mm) of the rat #5 are shown. (a) ADC map where ADC < 500 µm2/s in the ischemic area (left-hand side of the image). (b) Pseudocolor-coded parametric image of the rate of 23Na signal increase (‘slope’) superimposed over the grayscale 1H spin-echo MR image as an anatomic reference. Reference tubes with NaCl solutions were external to the rat head in the magnet and are not shown in MR images. (c) Cut-face photograph of the brain in the cryostat after sampling showing punch holes. A millimeter scale is shown at the top. Punch samples were analyzed using emission flame photometry. (d) Cross-section of the 3D reconstruction of the brain from the 35-µm-thick slices cut at 4.4 h after MCAO. The change in surface reflectivity of ischemic tissue shows the infarct location (outlined by a red dotted line). Cylindrical ROIs (yellow circles) were placed over the punch holes and are shown in images (a, b and e) as white or colored circles. (e) K+-stained slice taken at the sampling plane and used to calibrate optical density against [K+]. (f) The absence of staining in the MAP2-stained slice (separated by 0.67 mm from the sampling plane) indicates the ischemic lesion.
Figure 2
Figure 2
Spatial match of Na+ accumulation and K+ drop in a rat brain after MCAO. (a–d) Coronal images of the brain of rats #2–4 and 6, respectively. Top row: pseudocolor-coded parametric image of the rate of 23Na signal increase (‘slope’) superimposed over the grayscale 3D brain reconstructions from histological 35-µm-thick sections. Middle row: the same planes of 3D brain reconstructions from the K+-stained sections. Lack of staining (white areas) indicate low [K+]br in the ischemic lesion. Bottom row: 23Na slope (black) and [K+]br (red) profiles along the ribbons in the ischemic hemisphere (white or color arcs in the images) in the dorsal-to-ventral direction. Black dots in the images show holes in the brain after taking punch samples for calibration of Na+ and K+ images.
Figure 3
Figure 3
Na+ and K+ mapping of the ischemic brain (rat #5). (a,b) Pseudocolor images of the 23Na slope superimposed over the grayscale 3D reconstruction of the brain from histological 35-µm-thick sections. (c,d) K+-stained slices cut at 4.4 h post MCAO. (e,f) 23Na slope (black) and [K+]br (red) profiles along the ribbons in the ischemic hemisphere (white or color arcs in (a)–(d)) in the dorsal-to-ventral direction. The coronal sections were taken at the rostral (bregma −0.4 mm, a,c,e) and caudal (bregma −3 mm, b,d,f) levels. (1) Dorsal ischemic edge; (2) central ischemic core; (3) ventral ischemic edge. Estimated [Na+] and [K+] in ipsilateral and homotopic contralateral ROIs (white or color squares in (a)–(d)) in regions 1–3 are given in Table 3. (g) 3D reconstruction of the brain from 21 co-registered K+-stained coronal slices (0.7-mm separation) as viewed from the front-right perspective. Regions with [K+]br below 48 ± 4 mEq/kg (based on Gaussian-filtered images, to improve low-K+ ROI contiguity) are shown in yellow to highlight the peripheral ischemic core surrounding the central ischemic core. ROI of maximum 23Na slope corresponding to the slope range of 11.4 to 15.6%/h and overlapping the low-K+ ROI is shown in red.
Figure 4
Figure 4
Linear fit of [Na+]br vs. [K+]br in ischemic tissue. [Na+]br and [K+]br were determined by emission flame photometry in the micropunch samples obtained from all 8 animals between 2.5 and 6 hours after MCAO. Insets: coding of rat numbers by different symbols (top), and fit parameters (bottom). Dashed lines show 95% confidence limits.
Figure 5
Figure 5
Calibration of K+ staining intensity by emission flame photometry. Horizontal axis: [K+]br determined in punched samples by flame photometry. Vertical axis: digitized image intensity (GV, 8-bit gray value) averaged over ROIs precisely corresponding to the punch locations in immediately adjacent stained brain sections. A representative calibration curve for the rat #5 is shown. Calibration parameters for all rats are given in Table 2.

Similar articles

Cited by

References

    1. Alic L, Haeck JC, Bol K, Klein S, van Tiel ST, Wielepolski PA, de JM, Niessen WJ, Bernsen M, Veenland JF. Facilitating tumor functional assessment by spatially relating 3D tumor histology and in vivo MRI: image registration approach. PLoS ONE. 2011;6:e22835. - PMC - PubMed
    1. Belayev L, Alonso OF, Busto R, Zhao W, Ginsberg MD. Middle cerebral artery occlusion in the rat by intraluminal suture. Neurological and pathological evaluation of an improved model. Stroke. 1996;27:1616–1622. - PubMed
    1. Betz AL, Keep RF, Beer ME, Ren X. Blood-brain barrier permeability and brain concentration of sodium, potassium, and chloride during focal ischemia. J. Cereb. Blood Flow Metab. 1994;14:29–37. - PubMed
    1. Boada FE, Gillen JS, Noll DC, Shen GX, Chang SY, Thulborn KR. Data acquisition and postprocessing strategies for fast quantitative sodium imaging. Int. J. Imaging Syst. Technol. 1997a;8:544–550.
    1. Boada FE, Gillen JS, Shen GX, Chang SY, Thulborn KR. Fast three dimensional sodium imaging. Magn. Reson. Med. 1997b;37:706–715. - PubMed

Publication types