. 2013 Jul 18;499(7458):360-3.
doi: 10.1038/nature12349. Epub 2013 Jun 23.

Promoter directionality is controlled by U1 snRNP and polyadenylation signals

Affiliations

Promoter directionality is controlled by U1 snRNP and polyadenylation signals

Albert E Almada et al. Nature. .

Abstract

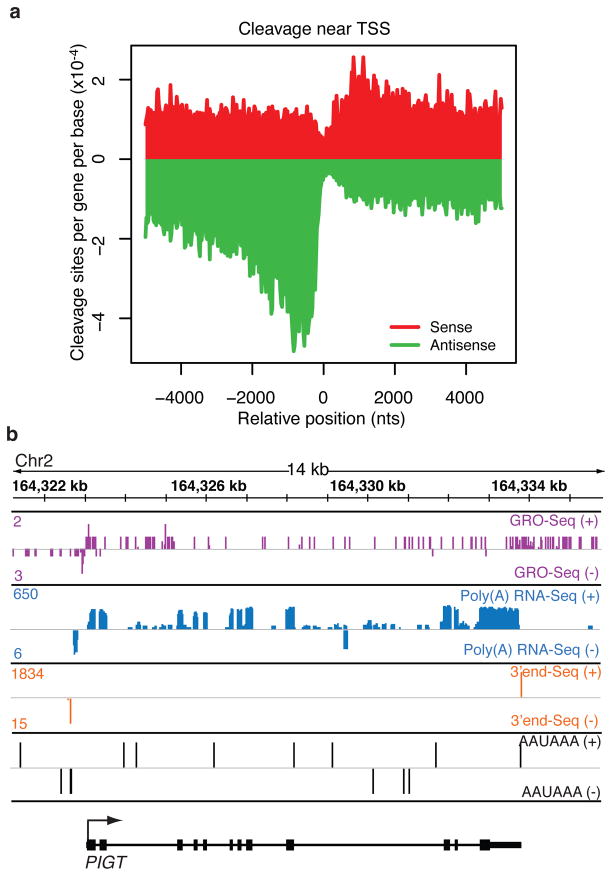
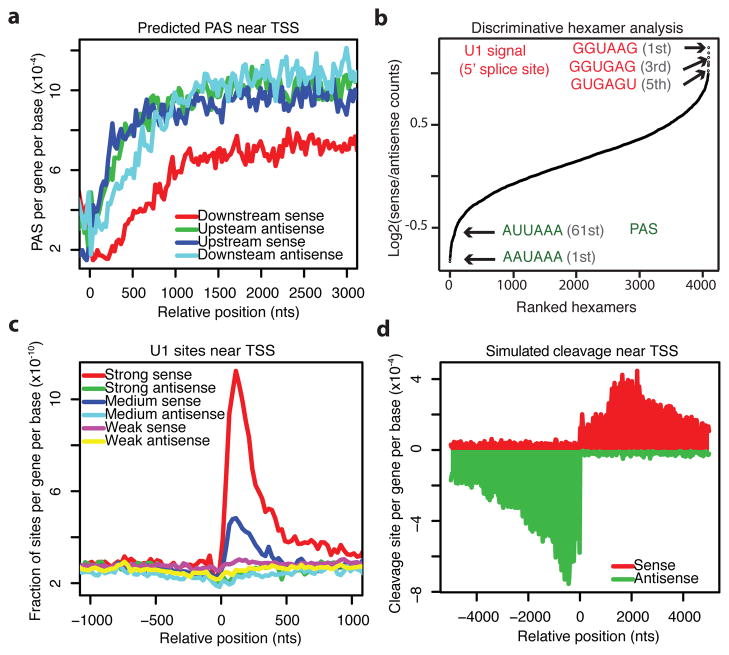
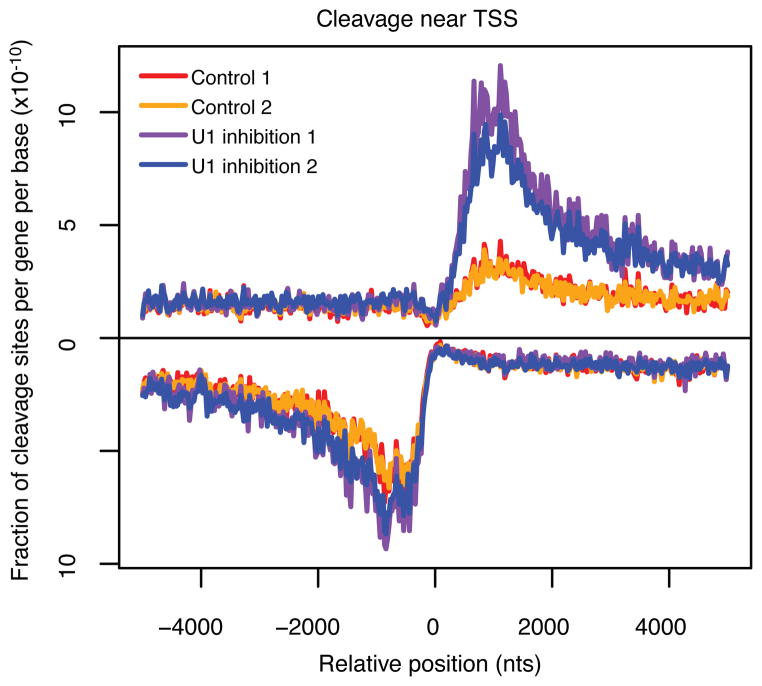
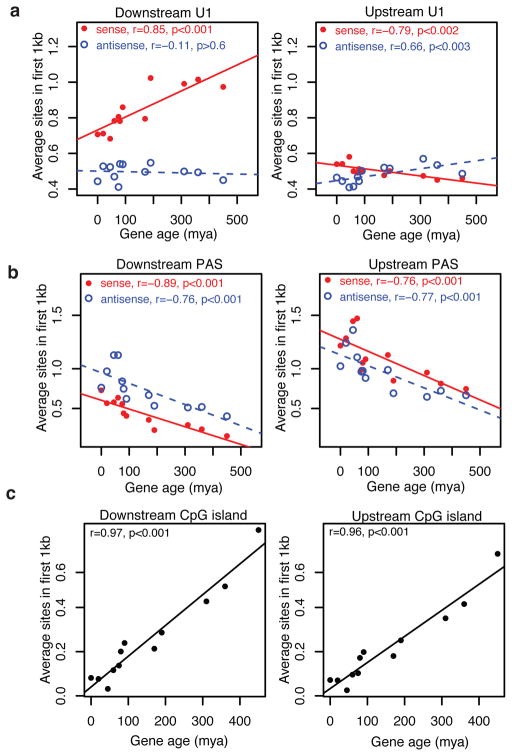
Transcription of the mammalian genome is pervasive, but productive transcription outside of protein-coding genes is limited by unknown mechanisms. In particular, although RNA polymerase II (RNAPII) initiates divergently from most active gene promoters, productive elongation occurs primarily in the sense-coding direction. Here we show in mouse embryonic stem cells that asymmetric sequence determinants flanking gene transcription start sites control promoter directionality by regulating promoter-proximal cleavage and polyadenylation. We find that upstream antisense RNAs are cleaved and polyadenylated at poly(A) sites (PASs) shortly after initiation. De novo motif analysis shows PAS signals and U1 small nuclear ribonucleoprotein (snRNP) recognition sites to be the most depleted and enriched sequences, respectively, in the sense direction relative to the upstream antisense direction. These U1 snRNP sites and PAS sites are progressively gained and lost, respectively, at the 5' end of coding genes during vertebrate evolution. Functional disruption of U1 snRNP activity results in a dramatic increase in promoter-proximal cleavage events in the sense direction with slight increases in the antisense direction. These data suggest that a U1-PAS axis characterized by low U1 snRNP recognition and a high density of PASs in the upstream antisense region reinforces promoter directionality by promoting early termination in upstream antisense regions, whereas proximal sense PAS signals are suppressed by U1 snRNP. We propose that the U1-PAS axis limits pervasive transcription throughout the genome.


Conflict of interest statement

Author information. 3′-end sequencing data is deposited in the Gene Expression Omnibus under accession number GSE46433. Reprints and permissions information is available at www.nature.com/reprints. The authors declare no competing financial interests. Correspondence and requests for materials should be addressed to P.A.S (sharppa@mit.edu).

Figures

Figure 1
Figure 1
Promoter-proximal PAS-dependent termination of uaRNA. a, Metagene plot of sense (red) or antisense (green) unique cleavage sites flanking coding gene TSS. The number of unique cleavage sites per gene per base in each 25 bp bin across 5 kb upstream and downstream of the TSS is plotted. Mean cleavage density of first 2 kb: sense/antisense = 1.45/3.10. b, Genome browser view from the PIGT locus (shown in black on the + strand) displaying the following tracks with + strand (top) and − strand (bottom) represented: GRO-Seq (purple), Poly (A)+ RNA-Seq (blue), 3′end RNA-Seq (orange), and PAS (AAUAAA, black). For each gene track, the x-axis represents the linear sequence of genomic DNA. The numbers on the top left corner represent the maximum read density on each track.
Figure 2
Figure 2
Asymmetric distribution of PAS and U1 signals flanking coding gene TSS. a. Number of AATAAA sites per gene per base in each 25 bp bin within a 3 kb region flanking gene TSS on the downstream sense (red), downstream antisense (light blue), upstream antisense (green), and upstream sense (dark blue) strands. b, Rank of all 4096 hexamers by enrichment (log2 ratio) in the first 1 kb of all coding genes in the sense direction relative to 1 kb in the upstream antisense direction of the TSS. c, Density of predicted 5′ splice sites within a 1 kb region flanking gene TSS. Strong, medium, and weak 5′ splice sites are defined in Methods. d, Metagene plot of simulated cleavage sites around gene TSS. The first unprotected PAS (AAUAAA) that is not within 1 kb downstream of a strong U1 site for all coding genes is plotted. Mean cleavage density of first 2 kb: sense/antisense = 2.08/4.99.
Figure 3
Figure 3
Promoter-proximal cleavage sites are altered upon functional U1 inhibition. Y-axis is the number of cleavage sites per gene per base divided by the total number of cleavage sites identified in each 3′ end-sequencing library in a 5 kb region flanking coding gene TSS. Signal for the antisense strand is set as negative. U1 inhibition 1 (purple) and U1 inhibition 2 (blue) represent 3′-end sequencing libraries generated from mESCs treated with a U1-targeting AMO. Control 1 (red) and Control 2 (orange) represent 3′-end sequencing libraries generated from mESCs treated with a scrambled control AMO. Mean cleavage density of first 2 kb: sense/antisense = 2.5/4.4 (Control 1), 2.4/4.3 (Control 2), 7.0/5.8 (U1 inhibition 1), 5.9/5.5 (U1 inhibition 2).
Figure 4
Figure 4
Evolutionary gain and loss of U1 and PAS sites. a, Average number of strong U1 sites in the first 1 kb of protein-coding genes and upstream regions. b, Average number of PAS sites in the first 1 kb downstream and upstream of coding gene TSS, respectively. c, Average number of CpG islands overlapping the first 1 kb of protein-coding genes and upstream regions. Genes are divided into 12 ordered groups by gene age. X-axis indicates the age (myr, million years) of gene groups. The number of genes in each group (from old to young): 11934, 1239, 914, 597, 876, 1195, 279, 175, 198, 315, 926, and 1143. Solid red dots and blue circles indicate sites on the sense and antisense strands, respectively.

References

    1. Djebali S, et al. Landscape of transcription in human cells. Nature. 2012;489:101–108. - PMC - PubMed
    1. Seila AC, et al. Divergent transcription from active promoters. Science. 2008;322:1849–1851. - PMC - PubMed
    1. Core LJ, Waterfall JJ, Lis JT. Nascent RNA sequencing reveals widespread pausing and divergent initiation at human promoters. Science. 2008;322:1845–1848. - PMC - PubMed
    1. Preker P, et al. RNA exosome depletion reveals transcription upstream of active human promoters. Science. 2008;322:1851–1854. - PubMed
    1. Adelman K, Lis JT. Promoter-proximal pausing of RNA polymerase II: emerging roles in metazoans. Nat Rev Genet. 2012;13:720–731. - PMC - PubMed

Publication types

Substances

Associated data