. 2013 Aug;45(8):884-890.
doi: 10.1038/ng.2678. Epub 2013 Jun 23.

Massive genomic variation and strong selection in Arabidopsis thaliana lines from Sweden

Affiliations

Massive genomic variation and strong selection in Arabidopsis thaliana lines from Sweden

Quan Long et al. Nat Genet. 2013 Aug.

Abstract

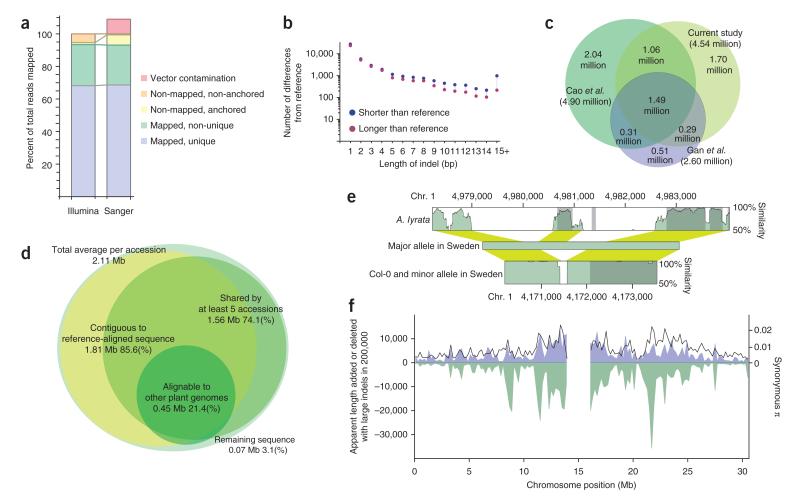
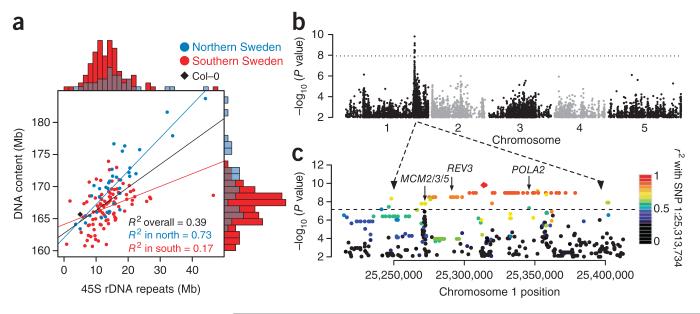
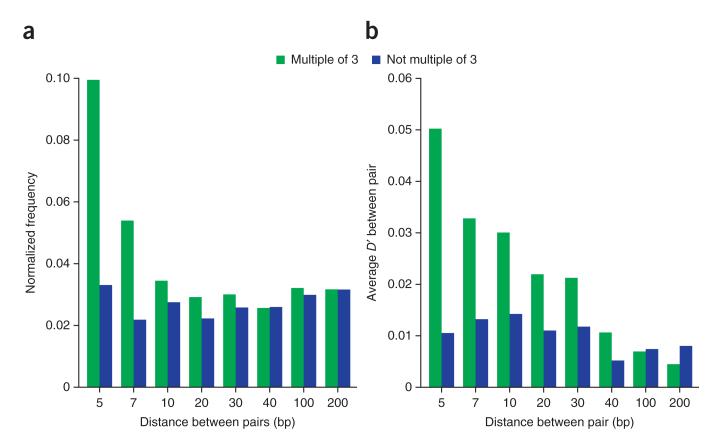
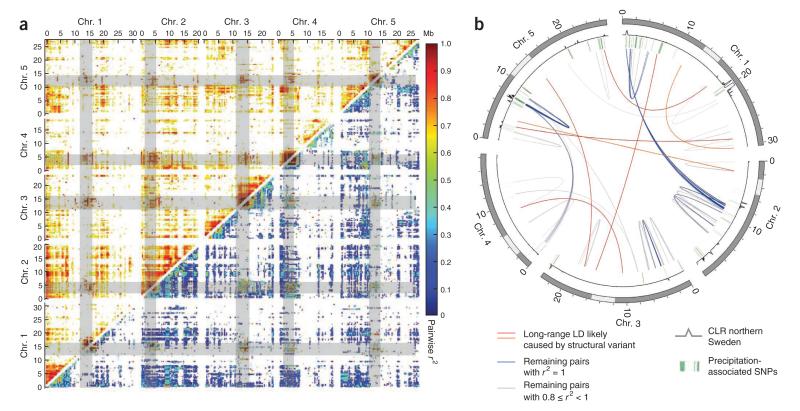
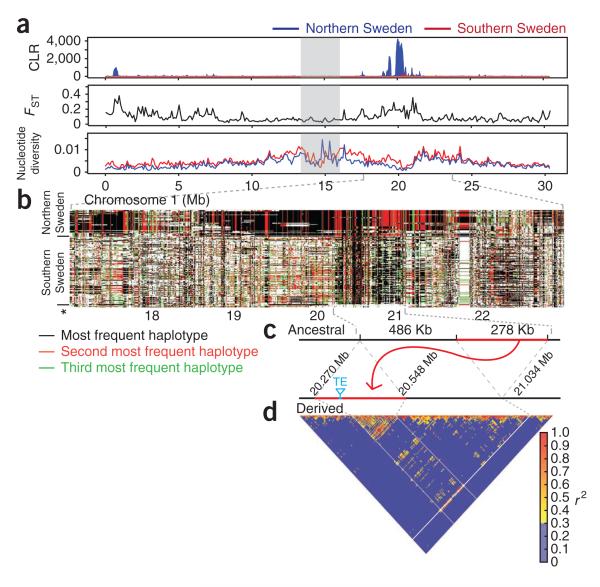
Despite advances in sequencing, the goal of obtaining a comprehensive view of genetic variation in populations is still far from reached. We sequenced 180 lines of A. thaliana from Sweden to obtain as complete a picture as possible of variation in a single region. Whereas simple polymorphisms in the unique portion of the genome are readily identified, other polymorphisms are not. The massive variation in genome size identified by flow cytometry seems largely to be due to 45S rDNA copy number variation, with lines from northern Sweden having particularly large numbers of copies. Strong selection is evident in the form of long-range linkage disequilibrium (LD), as well as in LD between nearby compensatory mutations. Many footprints of selective sweeps were found in lines from northern Sweden, and a massive global sweep was shown to have involved a 700-kb transposition.


Figures

Figure 1
Figure 1
Polymorphism detection. (a) Comparison of Illumina reads and longer, dideoxy-sequenced, randomly cloned fragments (Sanger) with respect to how well they align to the reference genome. The distributions are very similar, except that longer reads that cannot be aligned are more likely to be anchored by a short stretch of presumably homologous sequence. (b) Average number of indels between the sequenced lines and the reference genome, divided into variants that are shorter and longer than the reference genome and shown as a function of the length of the variant. (c) Overlap between SNPs generated by this study and two previous resequencing studies,. (d) Characterization of new sequence identified by de novo assembly. (e) An example of a region containing new sequence. The graphs show sequence similarity (coding sequence in dark green, noncoding sequence in light green; yellow shows alignment) to the majority haplotype in Sweden, which contains a ~1-kb fragment of new sequence not found in the reference genome. The new fragment is also found in A. lyrata, indicating that it is ancestral; however, the region has been subject to several more rearrangements since the species diverged. The polymorphism may have functional consequences, as it affects putative coding sequence. (f) Distribution of large variants increasing length (blue; identified using de novo assembly), large variants decreasing length (green; inferred from sequencing coverage) and SNPs (synonymous nucleotide diversity, π black line) along chromosome 1. Chromosomes 2–5 show an analogous pattern (Supplementary Fig. 2).
Figure 2
Figure 2
Genome size variation. (a) Joint distribution of nuclear DNA content (estimated using flow cytometry) and total amount of 45S rDNA (estimated using sequencing coverage). Marginal distributions are shown along the axes. (b) Manhattan plot of genome-wide association results for the flow cytometry–based estimates of genome size. The dotted horizontal line marks a significance level of 0.05 after Bonferroni correction for 4 million tests. The two known 45S rDNA clusters are close to the left ends of chromosomes 2 and 4 (ref. 15). (c) Magnified view of the chromosome 1 peak in b including a roughly 100-kb region of extensive LD. Colors indicate the extent of LD with the most significant SNP at position 25,313,734. The positions of three replication-related candidate genes are shown: POLA2 (At1g67630), which encodes the B subunit of DNA polymerase α; REV3 (At1g67500), which encodes recovery protein 3, the catalytic subunit of DNA polymerase ζ; and MCM2/3/5 (At1g67460), which is related to the minichromosome maintenance family of proteins. Sequence analysis of these candidates identified no obvious candidate polymorphisms (multiple alignments are available on the project download site).
Figure 3
Figure 3
Compensatory indels. (a) Over-representation of compensatory pairs of indels compared to their genome-wide frequency, plotted as a function of the distance between the indels. Compensatory pairs of indels are those whose sum length is a multiple of 3, thus restoring the reading frame. (b) LD (D’) between compensatory pairs of indel alleles as a function of the distance between the indels. Positive LD indicates an excess of non-reference alleles.
Figure 4
Figure 4
Long-range LD. (a) Genome-wide pairwise LD. Values before correcting for population structure are shown above the diagonal; for clarity, only values above 0.6 are shown. Values after applying a transformation to reduce the effects of population structure (related to the correction used in genome-wide association mapping; Supplementary Note) are shown below the diagonal. (b) Remaining long-range LD after extensive filtering, combined with positions of putatively selected loci. Green bars show the position of loci significantly associated with minimum precipitation and relative humidity in a global sample (Supplementary Table 3), and the gray curve indicates the signatures of local adaptation in the northern Swedish population (Fig. 5). Gray bars indicate centromeric regions.
Figure 5
Figure 5
Characterization of selective sweeps on chromosome 1. (a) Values of three different statistics sensitive to selective sweeps plotted along the chromosome. Statistics were calculated separately for the lines from northern and southern Sweden. The CLR statistic clearly marks a strong sweep in the northern lines, and the same region also shows increased FST as well as decreased nucleotide diversity. The gray bar indicates the centromeric region. (b) Pattern of haplotype sharing underlying the major signal around 20 Mb. Shown are haplotypes derived from lines in northern and southern Sweden, as are the six presumed ancestral haplotypes (asterisk). Haplotype sharing is much more extensive in the lines from northern Sweden than in those from southern Sweden. (c) Schematic of the transposition event most likely responsible for the observed pattern. (d) Pattern of LD across the swept region (red bar in c).

References

    1. Fournier-Level A, et al. A map of local adaptation in Arabidopsis thaliana. Science. 2011;334:86–89. - PubMed
    1. Hancock AM, et al. Adaptation to climate across the Arabidopsis thaliana genome. Science. 2011;334:83–86. - PubMed
    1. Platt A, et al. The scale of population structure in Arabidopsis thaliana. PLoS Genet. 2010;6:e1000843. - PMC - PubMed
    1. Koornneef M, Alonso-Blanco C, Vreugdenhil D. Naturally occurring genetic variation in Arabidopsis thaliana. Annu. Rev. Plant Biol. 2004;55:141–172. - PubMed
    1. Atwell S, et al. Genome-wide association study of 107 phenotypes in Arabidopsis thaliana inbred lines. Nature. 2010;465:627–631. - PMC - PubMed

Publication types