. 2013 Jul;19(7):901-908.
doi: 10.1038/nm.3217. Epub 2013 Jun 23.

BCAT1 promotes cell proliferation through amino acid catabolism in gliomas carrying wild-type IDH1

Affiliations

BCAT1 promotes cell proliferation through amino acid catabolism in gliomas carrying wild-type IDH1

Martje Tönjes et al. Nat Med. 2013 Jul.

Abstract

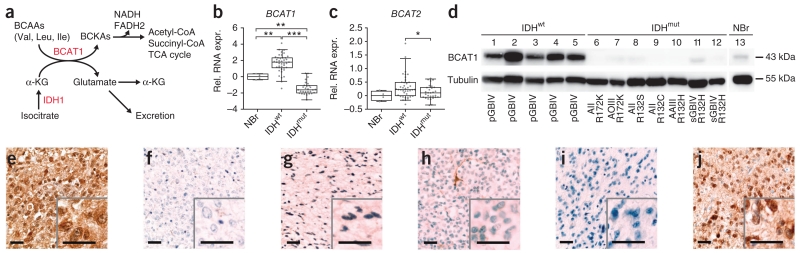
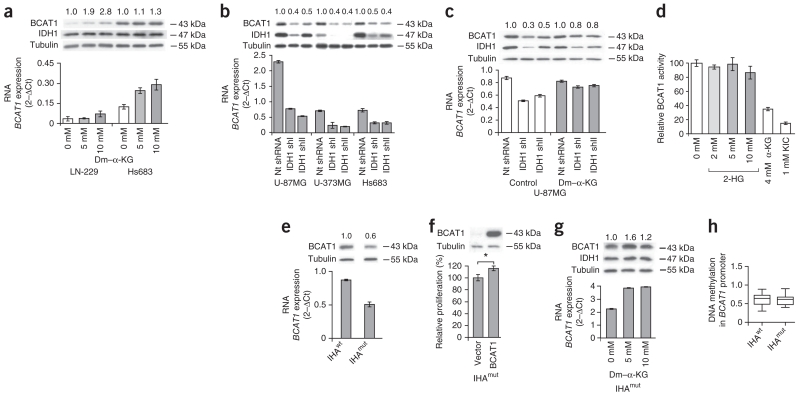
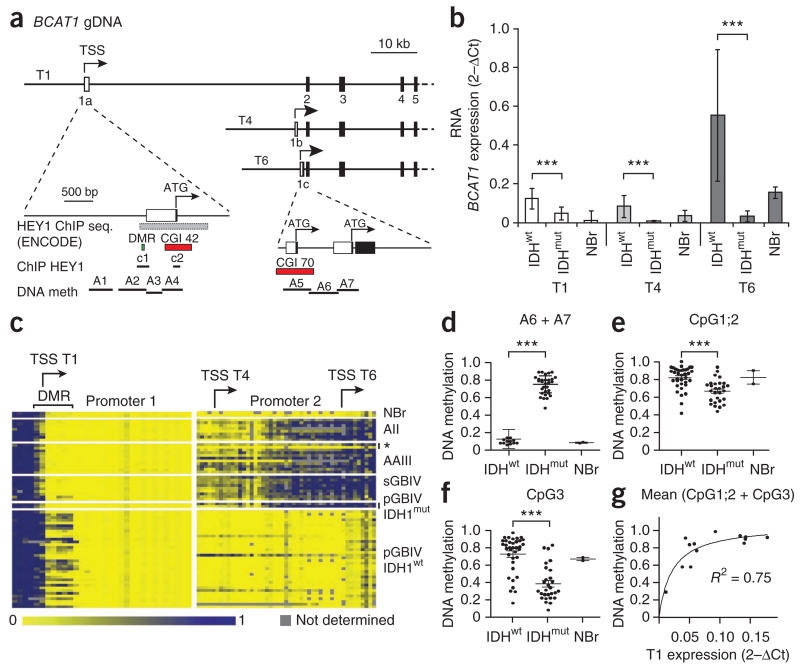
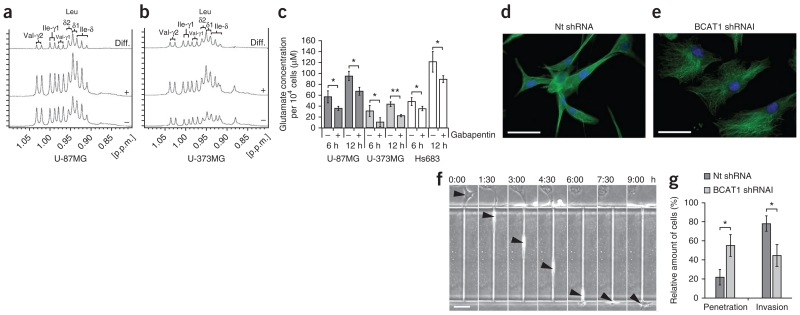
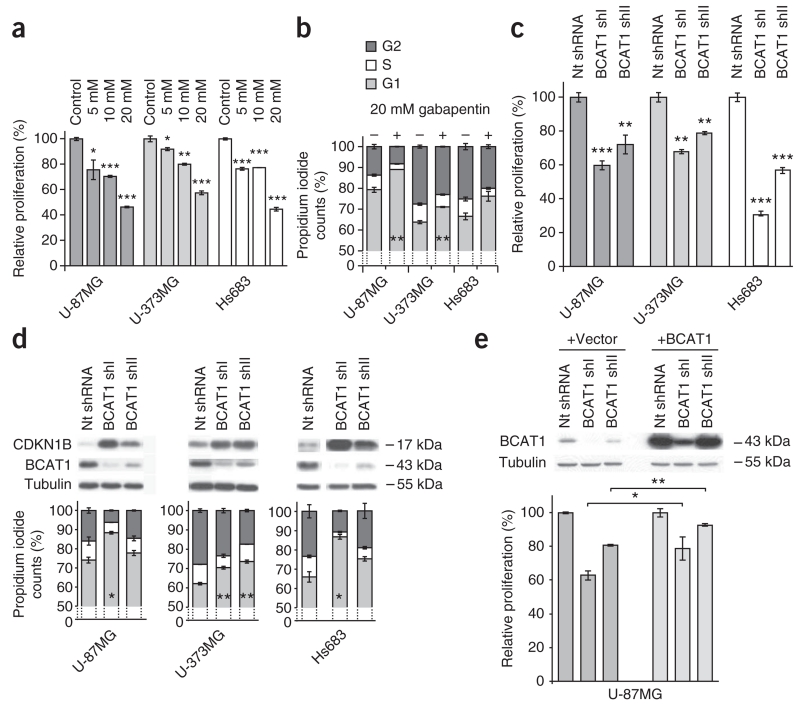
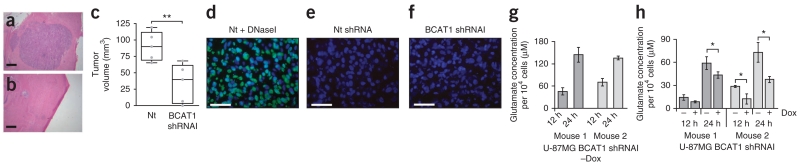
Here we show that glioblastoma express high levels of branched-chain amino acid transaminase 1 (BCAT1), the enzyme that initiates the catabolism of branched-chain amino acids (BCAAs). Expression of BCAT1 was exclusive to tumors carrying wild-type isocitrate dehydrogenase 1 (IDH1) and IDH2 genes and was highly correlated with methylation patterns in the BCAT1 promoter region. BCAT1 expression was dependent on the concentration of α-ketoglutarate substrate in glioma cell lines and could be suppressed by ectopic overexpression of mutant IDH1 in immortalized human astrocytes, providing a link between IDH1 function and BCAT1 expression. Suppression of BCAT1 in glioma cell lines blocked the excretion of glutamate and led to reduced proliferation and invasiveness in vitro, as well as significant decreases in tumor growth in a glioblastoma xenograft model. These findings suggest a central role for BCAT1 in glioma pathogenesis, making BCAT1 and BCAA metabolism attractive targets for the development of targeted therapeutic approaches to treat patients with glioblastoma.


Figures

Figure 1
Figure 1
IDHwt astrocytic gliomas are characterized by high BCAT1 expression. (a) Schematic representation of BCAA catabolism. BCKAs, branched-chain ketoacids; TCA, tricarboxylic acid. (b,c) BCAT1 (b) and BCAT2 (c) RNA expression (relative RNA expression, rel. RNA exp.) in 70 astrocytic gliomas (41 IDHwt and 29 IDHmut) normalized to expression in normal brain (4 NBr). Whiskers mark the 5th and 95th percentiles. *P < 0.05, **P < 0.01, ***P < 0.001 (two-tailed Student’s t test). (d) Western blot analysis showing BCAT1 protein expression in astrocytic gliomas with wild-type IDH1 and IDH2 (lanes 1–5), different mutations in IDH2 (lanes 6–7) or IDH1 (lanes 8–12) and normal brain tissue (lane 13). AII, diffuse astrocytoma WHO grade 2; AAIII, anaplastic astrocytoma WHO grade 3; sGBIV, secondary glioblastoma WHO grade 4; pGBIV, primary glioblastoma WHO grade 4; AOIII, anaplastic oligodendroglioma WHO grade 3. (e–h) Immunohistochemical stainings of BCAT1 in an IDHwt primary glioblastoma (e), a primary glioblastoma with the R132H IDH1 mutation (f), a diffuse astrocytoma with the R132C IDH1 mutation (g) and an anaplastic oligodendroglioma with the R172K IDH2 mutation (h). (i,j) Immunohistochemical staining of R132H IDH1 in the same tumors as those in e and f, respectively. Insets show representative areas at 2.5× relative magnification. Scale bars, 50 μm.
Figure 2
Figure 2
BCAT1 shows substrate-dependent expression in glioblastoma cell lines. (a–c) Effects of α-KG on BCAT1 expression in glioma cell lines. The numbers above the western blots indicate the fold ratios of protein expression relative to control cells after normalization to the tubulin loading control. The mRNA expression values represent the mean ± s.d. of triplicate samples. (a) Effect of cell-permeable dimethyl–α-KG (dm–α-KG) for 24 h on BCAT1 expression. (b) BCAT1 expression after lentiviral knockdown of α-KG–producing cytoplasmic IDH1 with two different shRNAs (shI and shII). nt, nontargeting. (c) BCAT1 expression after shRNA-mediated knockdown of IDH1 and additional supplementation of the culture medium with 1 mM cell-permeable dm–α-KG for 6 d. (d) Effect of branched-chain α-ketoacid substrates and 2-HG on brain BCAT1 activities. Values are the means ± s.d. of three independent experiments. (e) Western blot analysis showing BCAT1 protein expression in IHAwt and IHAmut cells. (f) Effect of lentiviral overexpression of BCAT1 in IHAmut cells on proliferation determined using the Click-iT EdU cell proliferation assay. Values in the graphs (e,f) represent the mean ± s.d. for n = 3 replicates. *P < 0.05 compared to empty vector control (Student’s t test). (g) Effect of dm–α-KG treatment for 24 h on BCAT1 expression in IHAmut cells. Values in the graph represent the mean ± s.d. for n = 3 replicates. (h) DNA methylation of CpGs (n = 19) in the BCAT1 promoter in IHAwt and IHAmut cells (Gene Expression Omnibus GSE30338). The average absolute methylation levels are shown. Box plots represent the median, the 25th and 75th percentiles (boxes) and the 5th and 95th percentiles (whiskers).
Figure 3
Figure 3
Expression levels of the three BCAT1 transcripts are associated with differential methylation of two alternative promoters. (a) Schematic drawing of exons 1–5 of BCAT1 showing the exon structure of the three transcripts, T1, T4 and T6. The two alternative promoters, 1 and 2 with exons 1a and 1c, respectively, are shown in the enlarged sections on the lower left and lower right, respectively. gDNA, genomic DNA; TSS, transcription start site; seq., sequence; meth, methylation; CGI, CpG island; c1 and c2, amplicons for HEY1 chromatin immunoprecipiation assay. (b) qRT-PCR quantification of the RNA expression of transcripts T1, T4 and T6 in astrocytic gliomas (13 IDHwt and 18 IDHmut) and a pool of RNAs from normal brain tissues (23 NBr). Values represent the mean ± s.d. of triplicate samples. ***P < 0.001 (Student’s t test). (c) DNA methylation patterns detected in BCAT1 promoters 1 (left) and 2 (right) by MassARRAY analysis of bisulfite PCR amplicons A1–A7 in normal brain and astrocytic gliomas WHO grade 2–4. The asterisk indicates IDHwt anaplastic astrocytoma. (d–f) Extent of DNA methylation in NBr, IDHwt and IDHmut tumors in the average of all CpGs in promoter 2 (d; ***P < 0.0001), CpG1;2 (e; ***P = 0.0003) and CpG3 in promoter 1 (f; ***P < 0.0001). Statistical significance in d–f was calculated by Student’s t test. (g) Correlation of the average methylation grades of CpG1;2 and CpG3 and BCAT1 T1 expression.
Figure 4
Figure 4
BCAT1 suppression reduces glutamate release by glioma cells and limits glioblastoma cell invasion potential. (a,b) BCAA methyl group region of the 1H-NMR spectra obtained from extracts of U-87MG (a) and U-373MG (b) cells after treatment with solvent control (−) or 20 mM gabapentin (+) for 20 h. The horizontal axis represents the resonance frequency in p.p.m. relative to the trimethylsilyl propionate (TSP) reference. The vertical axis represents absolute signal intensities scaled to a constant cell count. Difference (diff.) spectra (treatment minus control) are shown at the top. After inhibitor treatment, the levels of valine (Val), leucine (Leu) and isoleucine (Ile) increased by factors of 1.09, 1.38, 1.19, respectively, in U-87MG cells and by factors of 1.83, 2.18 and 2.32, respectively, in U-373MG cells. δ values indicate chemical shifts, and γ values indicate gyromagnetic ratios. (c) Glutamate release by glioma cells at 6 and 12 h after the start of treatment with 20 mM gabapentin for BCAT1 inhibition (+) or solvent control (20 mM HEPES; −). Values represent the mean ± s.d. for n = 3 replicates. *P < 0.05, **P < 0.01 compared to the respective controls (Student’s t test). (d,e) Immunofluorescence labeling of tubulin (green) in control (d) and BCAT1 knockdown (e) U-87MG cells. Blue, DAPI. Scale bars, 50 μm. (f) Sequential images showing the permeation of a U-87MG cell (arrowheads) through a 5 μm × 11 μm × 300 μm microchannel over a period of 9 h. Scale bar, 100 μm. The labels above the images show the time elapsed as hours:minutes. (g) Effect of BCAT1 knockdown on the invasion potential of U-87MG cells compared to cells transduced with nontargeting shRNA. Results indicate the mean ± s.d. of three independent replicates (*P = 0.0146, Student’s t test).
Figure 5
Figure 5
BCAT1 is essential for glioblastoma progression. (a–e) Cell proliferation using the Click-iT EdU cell proliferation assay and cell cycle analyses performed using DNA staining with propidium iodide of glioma cells after suppression of BCAT1 expression. The DNA distribution is shown for living cells. (a,b) Proliferation analysis (a) and cell cycle distribution (b) of glioma cell lines after BCAT1 inhibition with gabapentin for 20 h relative to control cells treated with solvent only. (c,d) Proliferation analysis (c) and cell cycle analysis (d) of glioma cells after knockdown of BCAT1 with two different shRNAs relative to cells treated with nontargeting shRNA. The western blots show protein expression of the G1 arrest marker CDKN1B, BCAT1 and the loading control tubulin. (e) Western blot and proliferation analyses of U-87MG cells treated with two BCAT1-targeting shRNAs or nontargeting shRNA after co-transduction with empty pLVX vector or the pLVX-BCAT1 vector, respectively. Values in the graphs (a–e) represent the mean ± s.d. for n = 3 replicates. *P < 0.05, **P < 0.01, ***P < 0.001 compared to the respective controls (Student’s t test).
Figure 6
Figure 6
BCAT1 knockdown affects tumor growth in vivo. (a,b) Cross-sections of tumors 28 d after intracranial injection of U-87MG glioblastoma cells into CD-1 nu/nu mice. H&E staining is shown for mice injected with control nontargeting shRNA–transduced (a) or BCAT1 shRNAI–transduced (b) cells. Scale bars, 1 mm. (c) Quantification of tumor volumes (n = 5 mice for each group; **P = 0.0091, Student’s t test). (d–f) TUNEL staining of apoptotic cells (green) and nuclear counterstaining (blue) of representative orthotopic tumors from xenograft mice. (d) Brain sections treated with DNaseI, which served as positive control. (e,f) TUNEL staining of tumors that developed when mice were injected with control cells (e) or cells transduced with BCAT1 shRNAI (f). Scale bars, 50 μm. (g) Glutamate release by U-87MG cells 36 h after their explantation from xenograft tumors. Cells had been stably transduced with pLKO-Tet-On-BCAT1 shRNAI and were isolated 25 d after cranial implantation into CD1 nu/nu mice that did not receive doxycycline (−Dox). (h) Glutamate excretion by the same cells as those in g after 5 d in normal medium (−) or after doxycycline-induced knockdown of BCAT1 expression (+; 2 μg ml−1 doxycycline in cell culture medium). Values (g,h) represent the mean ± s.d. of quadruplicate samples. *P < 0.05 (Student’s t test).

Comment in

References

    1. Lieth E, et al. Nitrogen shuttling between neurons and glial cells during glutamate synthesis. J. Neurochem. 2001;76:1712–1723. - PubMed
    1. Hutson SM. The case for regulating indispensable amino acid metabolism: the branched-chain α-keto acid dehydrogenase kinase-knockout mouse. Biochem. J. 2006;400:e1–e3. - PMC - PubMed
    1. Ichihara A, Koyama E. Transaminase of branched chain amino acids. I. Branched chain amino acids–α-ketoglutarate transaminase. J. Biochem. 1966;59:160–169. - PubMed
    1. Taylor RT, Jenkins WT. Leucine aminotransferase. II. Purification and characterization. J. Biol. Chem. 1966;241:4396–4405. - PubMed
    1. García-Espinosa MA, Wallin R, Hutson SM, Sweatt AJ. Widespread neuronal expression of branched-chain aminotransferase in the CNS: implications for leucine/glutamate metabolism and for signaling by amino acids. J. Neurochem. 2007;100:1458–1468. - PubMed

Publication types

MeSH terms