. 2013 Aug;10(8):781-7.
doi: 10.1038/nmeth.2524. Epub 2013 Jun 23.

Biowire: a platform for maturation of human pluripotent stem cell-derived cardiomyocytes

Affiliations

Biowire: a platform for maturation of human pluripotent stem cell-derived cardiomyocytes

Sara S Nunes et al. Nat Methods. 2013 Aug.

Abstract

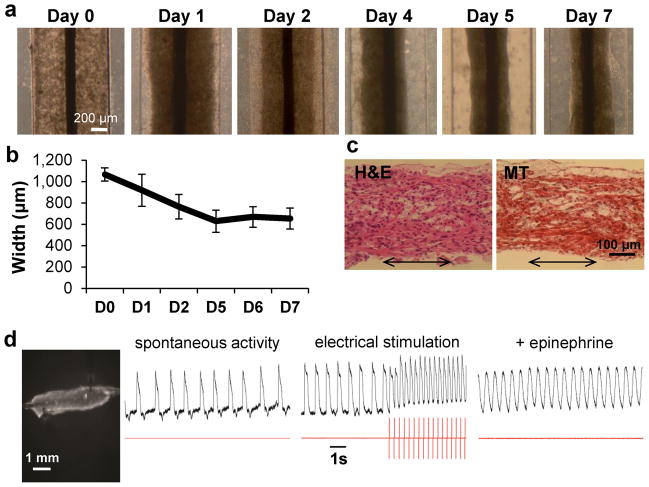
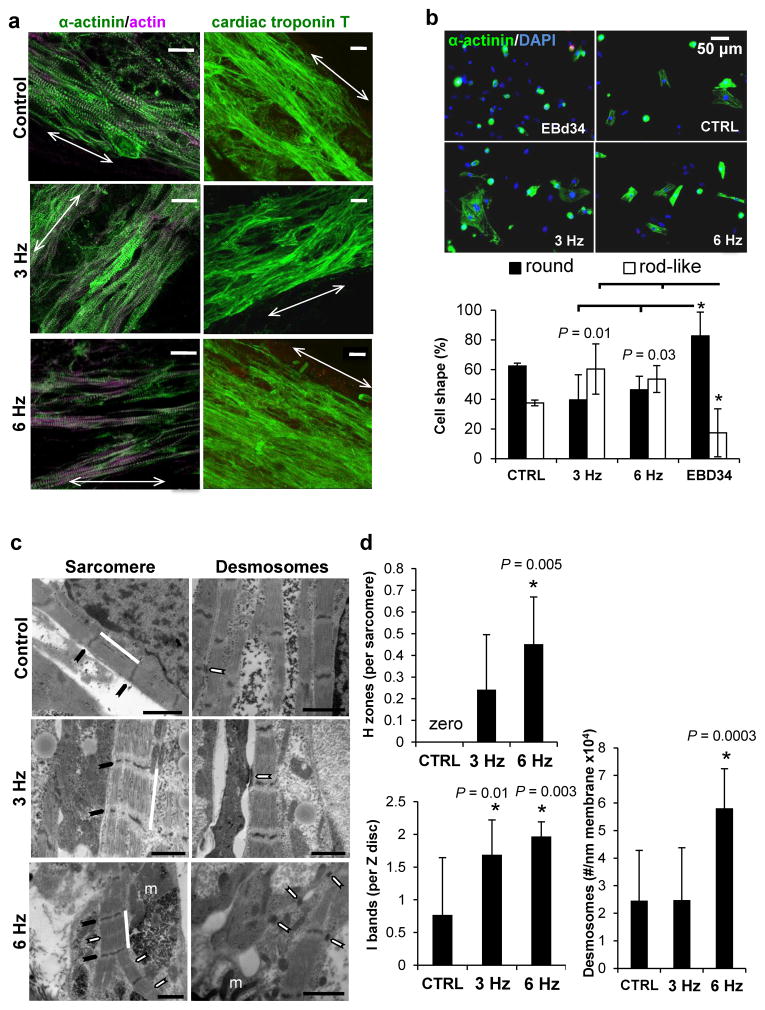
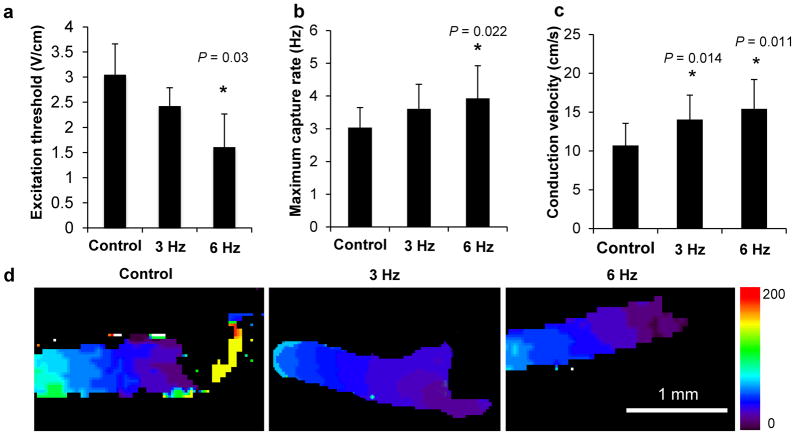
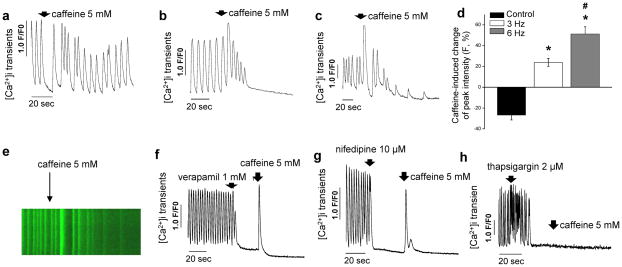
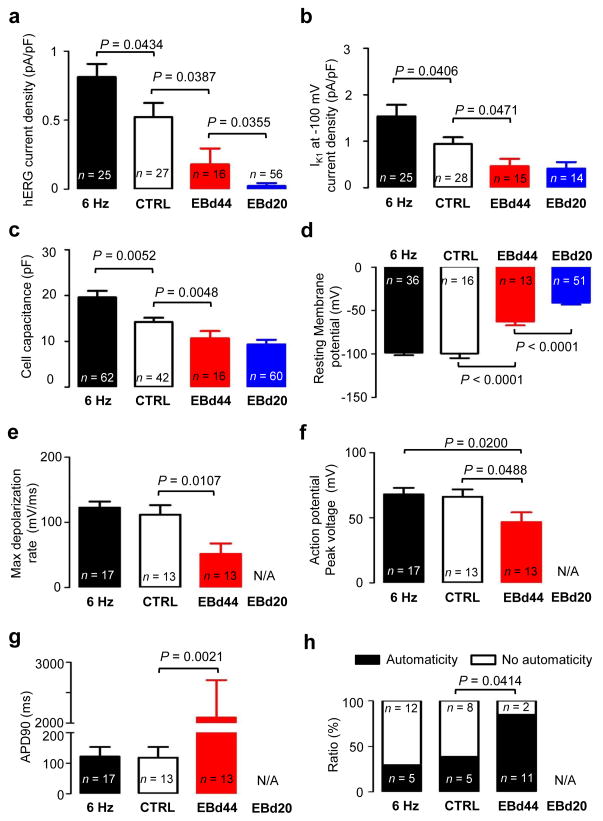
Directed differentiation protocols enable derivation of cardiomyocytes from human pluripotent stem cells (hPSCs) and permit engineering of human myocardium in vitro. However, hPSC-derived cardiomyocytes are reflective of very early human development, limiting their utility in the generation of in vitro models of mature myocardium. Here we describe a platform that combines three-dimensional cell cultivation with electrical stimulation to mature hPSC-derived cardiac tissues. We used quantitative structural, molecular and electrophysiological analyses to explain the responses of immature human myocardium to electrical stimulation and pacing. We demonstrated that the engineered platform allows for the generation of three-dimensional, aligned cardiac tissues (biowires) with frequent striations. Biowires submitted to electrical stimulation had markedly increased myofibril ultrastructural organization, elevated conduction velocity and improved both electrophysiological and Ca(2+) handling properties compared to nonstimulated controls. These changes were in agreement with cardiomyocyte maturation and were dependent on the stimulation rate.


Conflict of interest statement

Competing financial interests: M. A. Laflamme is a co-founder and scientific advisor for BEAT BioTherapeutics Corp.

Figures

Figure 1
Figure 1
Generation of human cardiac biowires. (a) Pre-culture of hESC-cardiomyocyte in biowire template for 7 days allowed cells to remodel the gel and contract around the suture. (b) Quantification of gel contraction demonstrated compaction of ~40% (average ± s.d., n = 3–4 wires). (c) Hematoxylin and Eosin (H&E) and Masson’s Trichrome (MT) staining of biowire sections show cell alignment along the suture axis (arrows represent suture axis). (d) Optical mapping of impulse propagation. A representative picture (left) of a biowire being imaged with potentiometric fluorophore (DI-4-ANEPPS) showing the spontaneous electrical activity, with impulse propagation recording (left trace recording), response to electrical stimulation (middle trace recording, stimulation frequency is depicted in red trace below; electrical capture can be seen during stimulation along with associated change in morphology of action potential and positive baseline shift) and increase in frequency of spontaneous response under pharmacological stimulation (epinephrine, right trace recording). (e, f) Electrical stimulation regimens applied. Pre-cultured biowires were submitted to electrical stimulation at 3–4 V/cm for 1 week. (e) Electrical stimulation started at 1 Hz and was progressively increased to 3 Hz where it was kept for the remainder of the week (low frequency ramp-up stimulation regimen or 3 Hz). (f) Stimulation rate was progressively increased from 1 to 6 Hz (High frequency ramp-up stimulation regimen or 6 Hz). (g) At the end of the stimulation, biowires were assessed for functional, ultrastructural, cellular and molecular responses as depicted. (ad) Illustrate results with Hes2 hESC-derived cardiomyocytes.
Figure 2
Figure 2
Culture in biowire in combination with electrical stimulation promoted physiological cell hypertrophy and improved cardiomyocyte phenotype. (a) Representative confocal images of non-stimulated (control) and electrically stimulated biowires (3 and 6 Hz ramp-up) showing cardiomyocyte alignment and frequent Z disks (arrows represent suture axis). Scale bar 20 μm. (b) Analysis of cardiomyocyte cell shape in different conditions reveals that biowires cultivated under electrical stimulation displayed significantly less round cells and more rod-like cells (average ± s.d., EBd34 vs. 3 Hz P = 0.01 for both rod and round like; EBd34 vs. 6 Hz P = 0.03 for both round and rod-like). (c) Ultrastructural analysis shows that electrical stimulation at 6 Hz induces cardiomyocyte self-organization. Representative images of non-stimulated (control) and electrically stimulated biowires showing sarcomere structure (Sarcomere panel, white bar; Z disks, black arrow; H zones, white arrows; m, mitochondria) and presence of desmosomes (Desmosomes panel, white arrows). Scale bar 1 μm. (d) Morphometric analysis (average ± s.d.) showing ratio of H zones to sarcomeres (CTRL vs. 6 Hz, P = 0.005) ratio of I bands to Z disks (CTRL vs. 3 Hz, P = 0.01; CTRL vs. 6 Hz, P = 0.003) and number of desmosomes per membrane length (CTRL vs. 6 Hz, P = 0.0003). *denotes statistically significant difference between group and control. In normal adult cells the ratio of H zones to sarcomeres is 1 and of I bands to Z disks is 2. (ad) Illustrate results with Hes2 hESC-derived cardiomyocytes. n = 3–4 per condition.
Figure 3
Figure 3
Functional assessment of engineered biowires demonstrated that electrical stimulation significantly improved electrical properties. Electrical stimulation improves (a) excitation threshold (CTRL vs. 6 Hz, P = 0.03, as measured by field stimulation and videomicroscopy), (b) maximum capture rate (CTRL vs. 6 Hz, P = 0.022, as measured by point stimulation and optical mapping) and (c) electrical impulse propagation rates (CTRL vs. 3 Hz, P = 0.014; CTRL vs. 6 Hz, P = 0.011, as measured by point stimulation and optical mapping). (d) Representative images of conduction velocity activation maps in biowires. *denotes statistically significant difference between group and control. Heat map = 0 to 200 ms. Average ± s.d., n = 6–10 per condition. (ad) Illustrate results with hESC-derived cardiomyocytes obtained from Hes2 cell line.
Figure 4
Figure 4
Electrical stimulation promoted improvement in Ca2+ handling properties. (a) Non-stimulated control cells did not respond to caffeine while cells from (b) 3 Hz ramp-up and (c) 6 Hz ramp-up protocols respond to caffeine by releasing more Ca2+ into the cytoplasm and depleting sarcoplasmic reticulum. (d) Caffeine-induced change of peak fluorescent intensity among different experimental groups (mean ± s.e.m. after normalizing the peak fluorescence intensity before administration of caffeine) (CTRL vs. 3 Hz, P = 1.1x10⁻⁶; CTRL vs. 6 Hz, P = 2.1 x10⁻⁷; 3 Hz vs. 6 Hz, P = 0.003; n = 8–10 per condition). (e) Representative fluorescence recording of Ca2+ transients before and after administration of caffeine at 5 mM (arrow) in 6 Hz stimulated cells. Inhibition of L-type Ca2+ channels with (f) verapamil or (g) nifedipine and blockage of SERCA channels with (h) thapsigargin in 6 Hz cells before addition of caffeine shows that cardiomyocytes stimulated with the 6 Hz regimen display Ca2+ handling properties compatible with functional sarcoplasmic reticulum. *denotes statistically significant difference between group and control. #denotes statistically significant difference between 3 Hz and 6 Hz group. (ah) Illustrate results with hESC-derived cardiomyocytes obtained from Hes2 cell line and represent measurements performed in single cell cardiomyocytes after dissociation from biowires.
Figure 5
Figure 5
Electrophysiological properties in single cell cardiomyocytes isolated from biowires or embryoid bodies and recorded with patch-clamp. Six Hz stimulated biowire (black), control biowire (white), EBd44 (red) and EBd20 (blue) are shown. (a) hERG tail current density, (b) IK1 current density measured at −100 mV, (c) cell capacitance, (d) resting membrane potential, (e) maximum depolarization rate of action potential, (f) action potential peak voltage, (g) action potential duration measured at 90% repolarization and (h) ratio of cells displaying spontaneous beating (automaticity) or no spontaneous beating (no automaticity). (ah) Illustrate results with hESC-derived cardiomyocytes obtained from Hes2 cell line. Average ± s.e.m.

References

    1. Kehat I, et al. Human embryonic stem cells can differentiate into myocytes with structural and functional properties of cardiomyocytes. J Clin Invest. 2001;108:407–414. - PMC - PubMed
    1. Yang L, et al. Human cardiovascular progenitor cells develop from a KDR+ embryonic-stem-cell-derived population. Nature. 2008;453:524–528. - PubMed
    1. Zhang J, et al. Functional cardiomyocytes derived from human induced pluripotent stem cells. Circ Res. 2009;104:e30–41. - PMC - PubMed
    1. Kattman SJ, et al. Stage-specific optimization of activin/nodal and BMP signaling promotes cardiac differentiation of mouse and human pluripotent stem cell lines. Cell Stem Cell. 2011;8:228–240. - PubMed
    1. Carvajal-Vergara X, et al. Patient-specific induced pluripotent stem-cell-derived models of LEOPARD syndrome. Nature. 2010;465:808–812. - PMC - PubMed

Publication types

MeSH terms