. 2013 Jun;32(1):189-210.
doi: 10.1007/s11032-013-9862-8. Epub 2013 Apr 10.

Quantitative trait loci for leaf chlorophyll fluorescence parameters, chlorophyll and carotenoid contents in relation to biomass and yield in bread wheat and their chromosome deletion bin assignments

Affiliations

Quantitative trait loci for leaf chlorophyll fluorescence parameters, chlorophyll and carotenoid contents in relation to biomass and yield in bread wheat and their chromosome deletion bin assignments

I Czyczyło-Mysza et al. Mol Breed. 2013 Jun.

Abstract

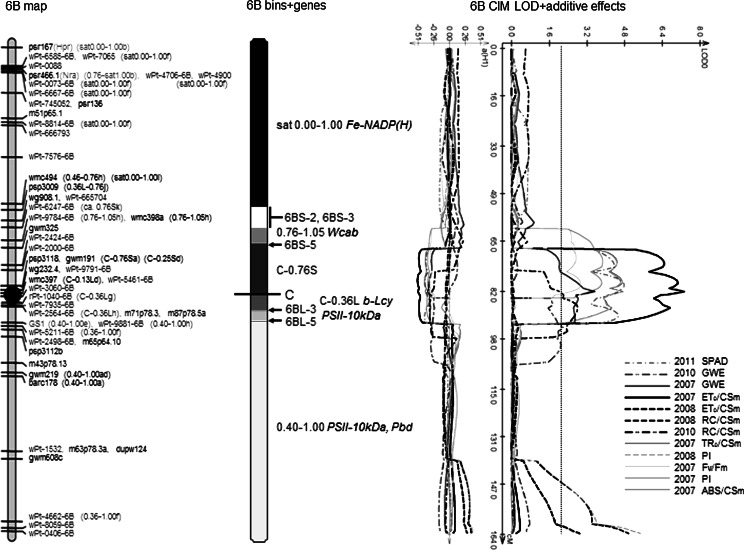
Relatively little is known of the genetic control of chlorophyll fluorescence (CF) and pigment traits important in determining efficiency of photosynthesis in wheat and its association with biomass productivity. A doubled haploid population of 94 lines from the wheat cross Chinese Spring × SQ1 was trialled under optimum glasshouse conditions for 4 years to identify quantitative trait loci (QTL) for CF traits including, for the first time in wheat, JIP-test parameters per excited cross section (CSm): ABS/CSm, DIo/CSm, TRo/CSm, RC/CSm and ETo/CSm, key parameters determining efficiency of the photosynthetic apparatus, as well as chlorophyll and carotenoid contents to establish associations with biomass and grain yield. The existing genetic map was extended to 920 loci by adding Diversity Arrays Technology markers. Markers and selected genes for photosynthetic light reactions, pigment metabolism and biomass accumulation were located to chromosome deletion bins. Across all CF traits and years, 116 QTL for CF were located on all chromosomes except 7B, and 39 QTL were identified for pigments on the majority of chromosomes, excluding 1A, 2A, 4A, 3B, 5B, 1D, 2D, 5D, 6D and 7D. Thirty QTL for plant productivity traits were mapped on chromosomes 3A, 5A, 6A, 7A, 1B, 2B, 4B, 6B, 7B, 3D and 4D. A region on chromosome 6B was identified where 14 QTL for CF parameters coincided with QTL for chlorophyll content and grain weight per ear. Thirty-five QTL regions were coincident with candidate genes. The environment was shown to dominate in determining expression of genes for those traits.

Keywords: Chlorophyll fluorescence kinetics; Deletion bin; Photosynthetic pigment content; Quantitative trait loci; Triticum aestivum; Yield and biomass.


Figures

Fig. 1
Fig. 1
See Supplementary Figure S3 for a color version of chromosome 6B and the other 20 chromosomes. Maps for chromosome 6B, divided into the genetic map (left), the deletion bin map, break points and gene locations (center) and CIM LOD and additive traces for traits (right). Explanations for the genetic map are as described for Figure S2. Markers that were assigned to specific deletion bins are identified with the fraction length for the bin, followed by a lower-case letter indicating how the bin was identified (explained in Supplementary Table S1). C, S and L on bin fraction lengths indicate the chromosome centromere, short arm and long arm, respectively. On the center map, chromosome break points and bin fraction lengths are selected according to Sourdille et al. (2004). The white area indicates uncertainty in the location of the break point. The centromere is identified as a black line crossing the chromosome. Genes (explained in Supplementary Table S2) are located to the middle of the relevant bin. Genes are colored according to type of function: photosynthetic light reactions—blue, chlorophyll and carotenoid synthesis and metabolism—red, and biomass (carbohydrate) productivity—green; gene abbreviations are explained in Supplementary Table S2. The right-hand map shows the CIM LOD output only for those traits giving a LOD maximum approaching 1.8 or more. The dotted black line indicates a LOD score of 2.0. Underneath the LOD traces, the additive effects are shown as fractions of ±1 standard deviation. Additive effects show the direction of the QTL: positive where the Chinese Spring allele, and negative where the SQ1 allele increased the trait. (Color figure online)

References

    1. Agenbag GM, Pretorius ZA, Boyd LA, Bender CM, Prins R. Identification of adult plant resistance to stripe rust in the wheat cultivar Cappelle-Desprez. Theor Appl Genet. 2012;125:109–120. doi: 10.1007/s00122-012-1819-5. - DOI - PubMed
    1. Akbari M, Wenzl P, Caig V, Carling J, et al. Diversity arrays technology (DArT) for high-throughput profiling of the hexaploid wheat genome. Theor Appl Genet. 2006;113:1409–1420. doi: 10.1007/s00122-006-0365-4. - DOI - PubMed
    1. Araus JL, Slafer GA, Royo C, Serret MD. Breeding for yield potential and stress adaptation in cereals. Crit Rev Plant Sci. 2008;27:1–36. doi: 10.1080/07352680802467736. - DOI
    1. Asada K. The water–water cycle in chloroplasts: scavenging of active oxygen and dissipation of excess photons. Annu Rev Plant Physiol Plant Mol Biol. 1999;50:601–639. doi: 10.1146/annurev.arplant.50.1.601. - DOI - PubMed
    1. Baker NR, Rosenqvist E. Applications of chlorophyll fluorescence can improve crop production strategies: an examination of future possibilities. J Exp Bot. 2004;55:1607–1621. doi: 10.1093/jxb/erh196. - DOI - PubMed

LinkOut - more resources