. 2011 May;4(2):95-110.
doi: 10.1037/a0020684.

A Model-Based fMRI Analysis with Hierarchical Bayesian Parameter Estimation

Affiliations

A Model-Based fMRI Analysis with Hierarchical Bayesian Parameter Estimation

Woo-Young Ahn et al. J Neurosci Psychol Econ. 2011 May.

Abstract

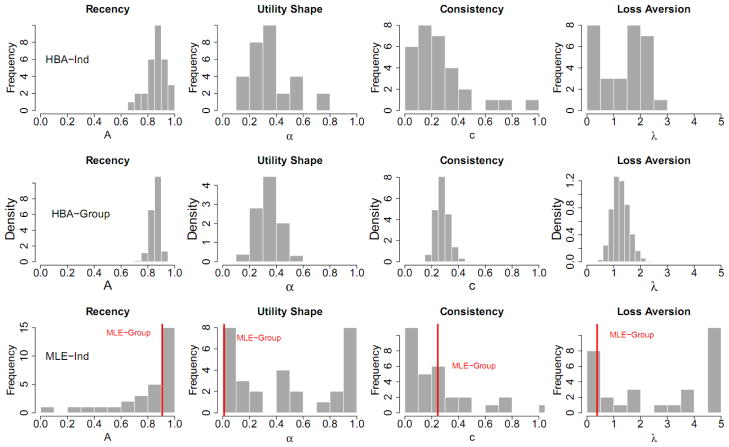
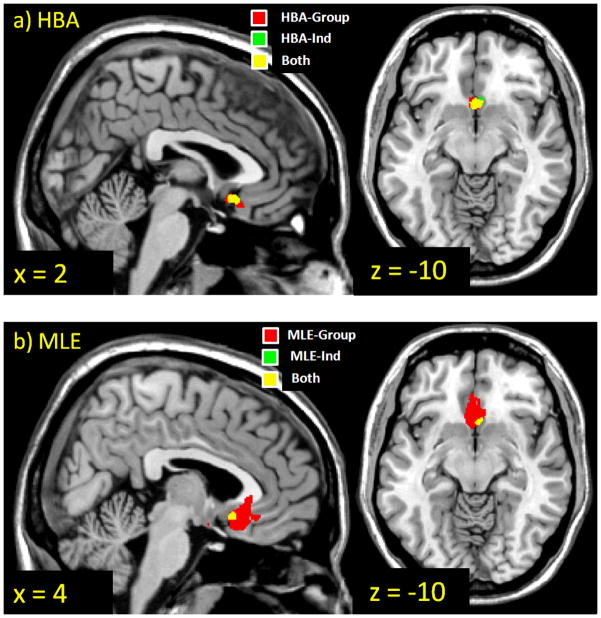
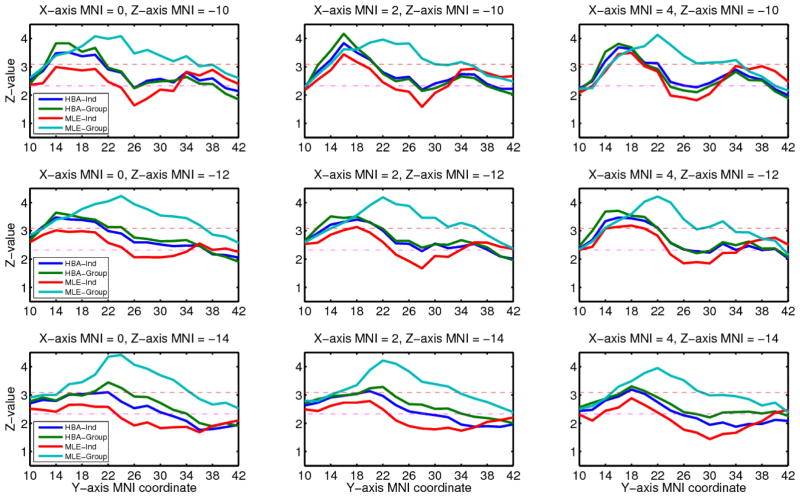
A recent trend in decision neuroscience is the use of model-based fMRI using mathematical models of cognitive processes. However, most previous model-based fMRI studies have ignored individual differences due to the challenge of obtaining reliable parameter estimates for individual participants. Meanwhile, previous cognitive science studies have demonstrated that hierarchical Bayesian analysis is useful for obtaining reliable parameter estimates in cognitive models while allowing for individual differences. Here we demonstrate the application of hierarchical Bayesian parameter estimation to model-based fMRI using the example of decision making in the Iowa Gambling Task. First we use a simulation study to demonstrate that hierarchical Bayesian analysis outperforms conventional (individual- or group-level) maximum likelihood estimation in recovering true parameters. Then we perform model-based fMRI analyses on experimental data to examine how the fMRI results depend upon the estimation method.


Figures

Figure 1
Figure 1
Graphical depiction of the hierarchical Bayesian analysis for the Prospect Valence Learning model. Clear shapes indicate latent variables, shaded shapes indicate observed variables; single outlines indicate probabilistic functions of input, double outlines indicate deterministic functions of input; circles indicate continuous variables, squares indicate discrete variables; rounded rectangular plates indicate replication over the indexing variable. See the main text for a description of the individual parameters.
Figure 2
Figure 2
For the simulation study, parameter estimates of the four free parameters in the PVL model for each simulated participant from both HBA and MLE. Shown in the graphs are: true parameter values (black circles), MLE-Ind estimates (red triangles), mean HBA-Ind estimates (big blue squares), MLE-Group estimates (red horizontal dashed lines), and 50 random samples from the posterior distribution of the HBA estimate for each participant (small sky-blue squares). A = recency; α = utility shape; c = choice sensitivity; λ = loss aversion. HBA = hierarchical Bayesian analysis; MLE = maximum likelihood estimation; Ind = individual-level estimates; Group = group-level estimates.
Figure 3
Figure 3
For the simulation study, histograms of the true parameter values and the parameter estimates from each estimation method for all of the simulated participants (except for the third row, which shows the posterior distributions of the group parameters for HBA-Group). HBA = hierarchical Bayesian analysis; MLE = maximum likelihood estimation; Bayes = non-hierarchical Bayesian analysis; Ind = individual-level estimates; Group = group-level estimates.
Figure 4
Figure 4
Time-course of the Iowa Gambling Task in a rapid event-related fMRI design.
Figure 5
Figure 5
For the model-based fMRI study, histograms of each participant’s parameter estimates with each estimation method. Note that the HBA-Ind parameters in the first row were used as the true parameters in the simulation study. HBA = hierarchical Bayesian analysis; MLE = maximum likelihood estimation; Ind = individual-level estimates; Group = group-level estimates.
Figure 6
Figure 6
Brain regions whose decision-time activation correlates significantly with the choice probability assigned by the PVL model using parameter estimates from each estimation method. Thresholded at p < .001, uncorrected, cluster size >= 8 voxels. HBA = hierarchical Bayesian analysis; MLE = maximum likelihood estimation; Ind = individual-level estimates; Group = group-level estimates.
Figure 7
Figure 7
The z-values as a function of MNI coordinates for decision-time activation correlated with the choice probability assigned by the PVL model using parameter estimates from each estimation method. Red dashed lines indicate thresholds for p < .001 (z = 3.06), and pink dashed lines indicate thresholds for p < .01 (z = 2.33). HBA = hierarchical Bayesian analysis; MLE = maximum likelihood estimation; Ind = individual-level estimates; Group = group-level estimates.

References

    1. Ahn WY, Busemeyer JR, Wagenmakers EJ, Stout JC. Comparison of decision learning models using the generalization criterion method. Cognitive Science. 2008;32:1376–1402. - PubMed
    1. Arthurs OJ, Boniface SJ. What aspect of the fMRI BOLD signal best reflects the underlying electrophysiology in human somatosensory cortex? Clinical Neurophysiology. 2003;114(7):1203–1209. - PubMed
    1. Bechara A, Damasio AR, Damasio H, Anderson SW. Insensitivity to future consequences following damage to human prefrontal cortex. Cognition. 1994;50(1–3):7–15. - PubMed
    1. Bechara A, Damasio H, Tranel D, Damasio AR. Deciding advantageously before knowing the advantageous strategy. Science. 1997;275(5304):1293–1295. - PubMed
    1. Bechara A, Dolan S, Denburg N, Hindes A, Anderson SW, Nathan PE. Decision-making deficits, linked to a dysfunctional ventromedial prefrontal cortex, revealed in alcohol and stimulant abusers. Neuropsychologia. 2001;39(4):376–389. - PubMed

LinkOut - more resources