. 2013 Aug 15;73(16):5242-52.
doi: 10.1158/0008-5472.CAN-13-0690. Epub 2013 Jun 24.

Intratumoral modeling of gefitinib pharmacokinetics and pharmacodynamics in an orthotopic mouse model of glioblastoma

Affiliations

Intratumoral modeling of gefitinib pharmacokinetics and pharmacodynamics in an orthotopic mouse model of glioblastoma

Jyoti Sharma et al. Cancer Res. .

Abstract

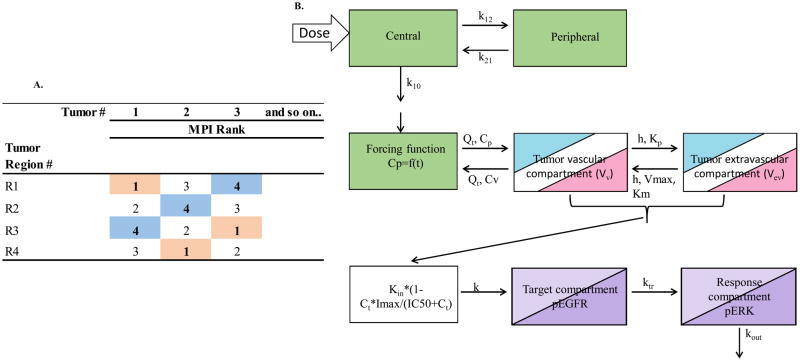
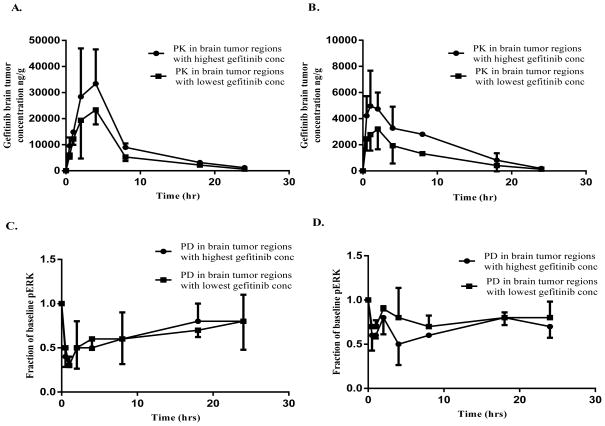
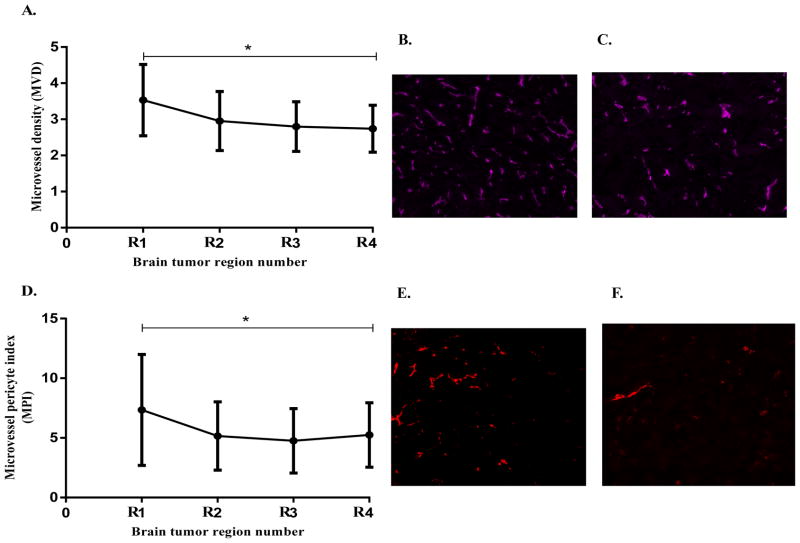
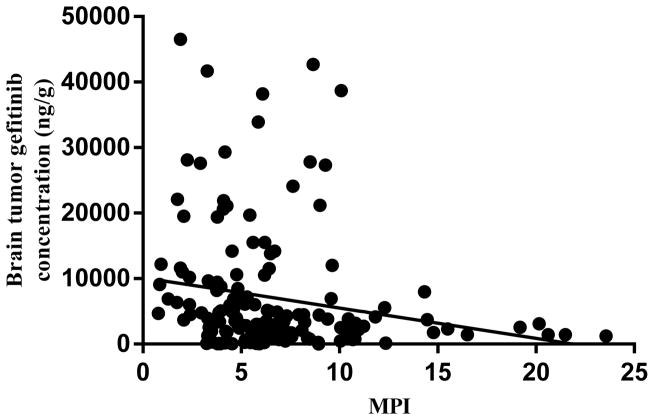
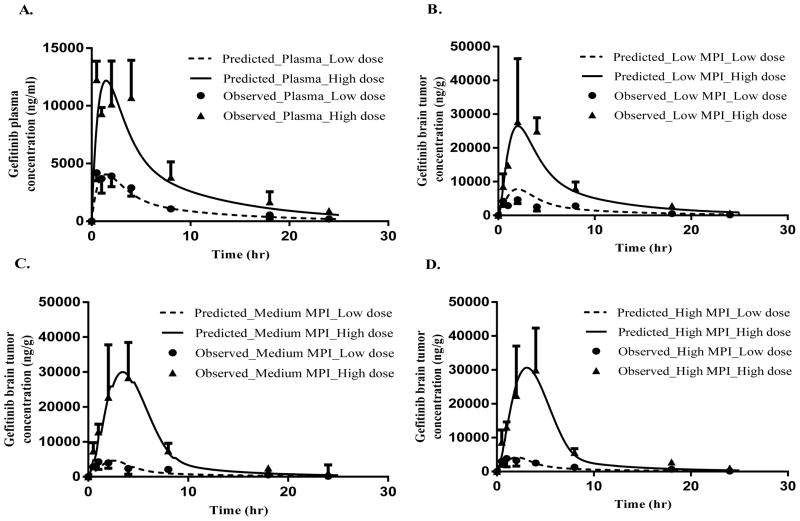
Like many solid tumors, glioblastomas are characterized by intratumoral biologic heterogeneity that may contribute to a variable distribution of drugs and their associated pharmacodynamic responses, such that the standard pharmacokinetic approaches based on analysis of whole-tumor homogenates may be inaccurate. To address this aspect of tumor pharmacology, we analyzed intratumoral pharmacokinetic/pharmacodynamic characteristics of the EGFR inhibitor gefitinib in mice with intracerebral tumors and developed corresponding mathematical models. Following a single oral dose of gefitinib (50 or 150 mg/kg), tumors were processed at selected times according to a novel brain tumor sectioning protocol that generated serial samples to measure gefitinib concentrations, phosphorylated extracellular signal-regulated kinase (pERK), and immunohistochemistry in 4 different regions of tumors. Notably, we observed up to 3-fold variations in intratumoral concentrations of gefitinib, but only up to half this variability in pERK levels. As we observed a similar degree of variation in the immunohistochemical index termed the microvessel pericyte index (MPI), a measure of permeability in the blood-brain barrier, we used MPI in a hybrid physiologically-based pharmacokinetic (PBPK) model to account for regional changes in drug distribution that were observed. Subsequently, the PBPK models were linked to a pharmacodynamic model that could account for the variability observed in pERK levels. Together, our tumor sectioning protocol enabled integration of the intratumoral pharmacokinetic/pharmacodynamic variability of gefitinib and immunohistochemical indices followed by the construction of a predictive PBPK/pharmacodynamic model. These types of models offer a mechanistic basis to understand tumor heterogeneity as it impacts the activity of anticancer drugs.


Conflict of interest statement

Conflict of interest: No potential conflict of interests were disclosed.

Figures

Figure 1
Figure 1
Gefitinib intratumoral PK/PD modeling scheme. A. Schematic representation of intratumoral data segregation strategy based on regional MPI rank. Each of the four brain tumor regions in each mouse were assigned an MPI rank based on their measured values. The rank of 1 [highlighted in pink] formed the low MPI group, ranks of 2 and 3 formed the medium MPI group and the rank of 4 [highlighted in blue] formed the high MPI group. The gefitinib brain tumor-tumor concentrations and corresponding pERK values were binned according to the MPI rank. B. Schematic representation of a physiologically-based hybrid PK/PD model consisting of a two compartment systemic disposition model [green], a two compartment tumor model [3 colors for each MPI group], and a three compartment sequence of a link compartment connected to a target-response model [2 colors for low and high dose groups]. Parameters shown in systemic disposition model are; the elimination rate constant (k10), intercompartment transfer rate constants (k12 and k21), for the tumor model; blood flow rate to tumor (Qt), maximum rate of active efflux from tumor extravascular to vascular compartment (Vmax), tumor transcellular transport rate constant (h), Michaelis-Menten constant (Km), and tumor vascular to extravascular paracellular transport rate constant (Kp), total gefitinib tumor concentration (Ct), and for the PD model; gefitinib tumor concentrations for 50% inhibition of pEGFR (IC50), the zero-order rate constant for formation of pEGFR (Kin), the first order rate constant for signal propagation from the drug target pEGFR compartment to the response pERK compartment (ktr), and a first-order rate constant for degradation and dephosphorylation of pERK (kout). The parameter “k” was used to link gefitinib tumor concentrations to the pEGFR target compartment and fixed at a value of 1. Refer to text for other model parameters and fitting procedure.
Figure 2
Figure 2
Intratumoral variability in gefitinib PK/PD following single oral doses of 150 mg/kg and 50 mg/kg gefitinib to mice bearing intracerebral U87/vIII tumors. A. Gefitinib brain tumor concentrations at 150 mg/kg and B. 50 mg/kg and C. PD responses based on pERK (fraction of baseline pERK) at 150 mg/kg and D. 50 mg/kg, in the regions with the lowest and highest variability. All observed points represent the mean + or − SD.
Figure 3
Figure 3
Intratumoral immunohistochemical analysis of MVD and MPI in U87vIII brain tumors following single oral doses of 150mg/kg gefitinib; data points = mean ± SD values from each tumor region from all the animals in the study (n=21). A. Regional variability in MVD showing decreasing MVD values from tumor periphery to center (p < 0.05), B and C. Representative images of MVD (CD31 staining) at tumor periphery and center, respectively. D. Regional variability in MPI showing decreasing MPI values from tumor periphery to center (significant difference, p < 0.05), and E and F. Representative images of microvessel pericyte coverage (α-SMA staining) at tumor periphery and center, respectively. Each image was acquired as a grayscale image at a resolution of 1.0 μm per pixel and then pseudo-colored for presentation.
Figure 4
Figure 4
Regional gefitinib brain tumor concentrations as a function of the corresponding regional MPI (as determined by immunohistochemical analysis) values following single doses of 50 mg/kg and 150 mg/kg gefitinib orally (all mice and regions included). A significant negative correlation was found, Pearson correlation coefficient = −0.19, P= 0.014.
Figure 5
Figure 5
Intratumoral PK modeling of gefitinib in athymic mice bearing intracerebral U87vIII tumors following either 50 mg/kg or 150 mg/kg single oral doses. The model predicted (—, 50 mg/kg; ---, 150 mg/kg) and observed (Mean + or − SD) (n=3) (●, 50 mg/kg; ▲, 150 mg/kg) gefitinib concentrations are presented for A. plasma, B. Low MPI tumor group, C. Medium MPI tumor group, and D. High MPI tumor group.

References

    1. Iacob G, Dinca EB. Current data and strategy in glioblastoma multiforme. J Med Life. 2009;2(4):386–93. - PMC - PubMed
    1. Louis DN, Ohgaki H, Wiestler OD, Cavenee WK, Burger PC, Jouvet A, et al. The 2007 WHO classification of tumours of the central nervous system. Acta Neuropathol. 2007;114(2):97–109. - PMC - PubMed
    1. Jung V, Romeike BF, Henn W, Feiden W, Moringlane JR, Zang KD, et al. Evidence of focal genetic microheterogeneity in glioblastoma multiforme by area-specific CGH on microdissected tumor cells. J Neuropathol Exp Neurol. 1999 Sep;58(9):993–9. - PubMed
    1. Bonavia R, Inda MM, Cavenee WK, Furnari FB. Heterogeneity maintenance in glioblastoma: A social network. Cancer Res. 2011;71(12):4055–60. - PMC - PubMed
    1. Little SE, Popov S, Jury A, Bax DA, Doey L, Al-Sarraj S, et al. Receptor tyrosine kinase genes amplified in glioblastoma exhibit a mutual exclusivity in variable proportions reflective of individual tumor heterogeneity. Cancer Res. 2012;72(7):1614–20. - PubMed

Publication types

MeSH terms