. 2013 Jul 1;27(13):1462-72.
doi: 10.1101/gad.213686.113. Epub 2013 Jun 24.

A survey of intragenic breakpoints in glioblastoma identifies a distinct subset associated with poor survival

Affiliations

A survey of intragenic breakpoints in glioblastoma identifies a distinct subset associated with poor survival

Siyuan Zheng et al. Genes Dev. .

Abstract

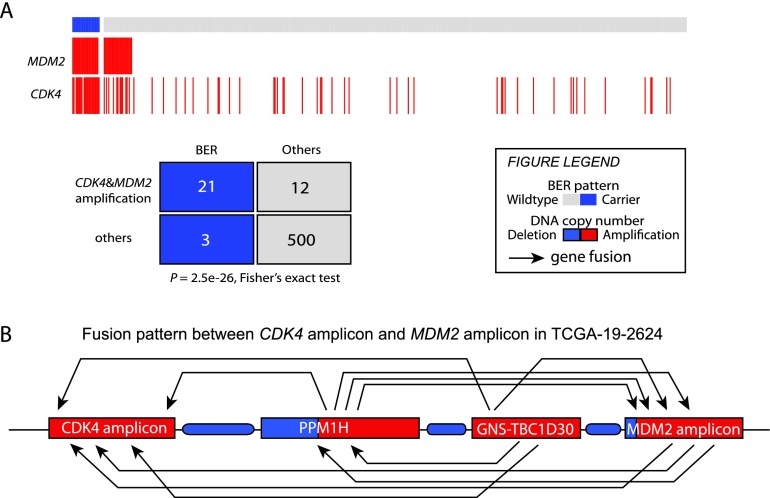
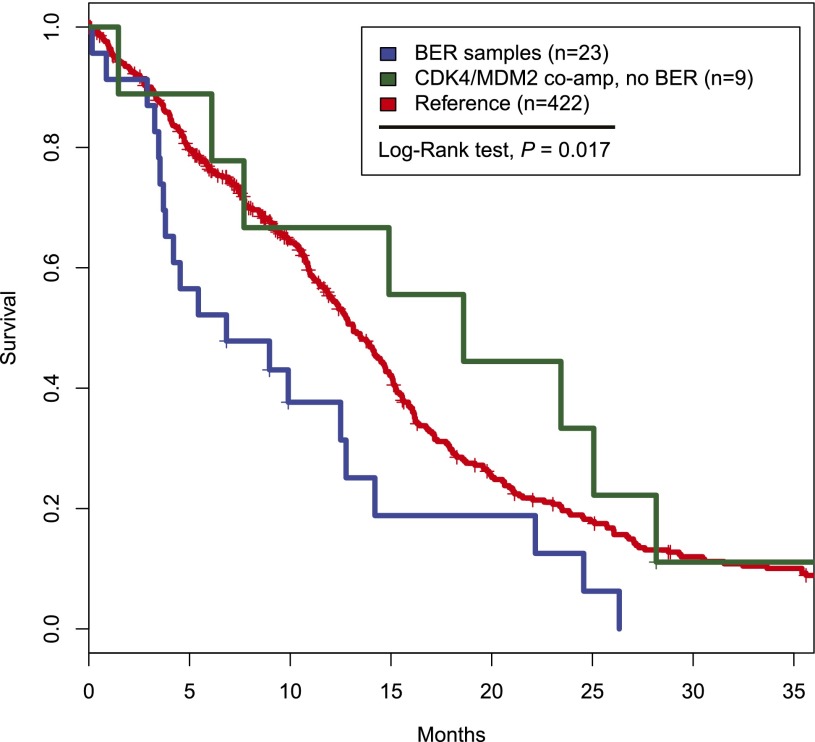
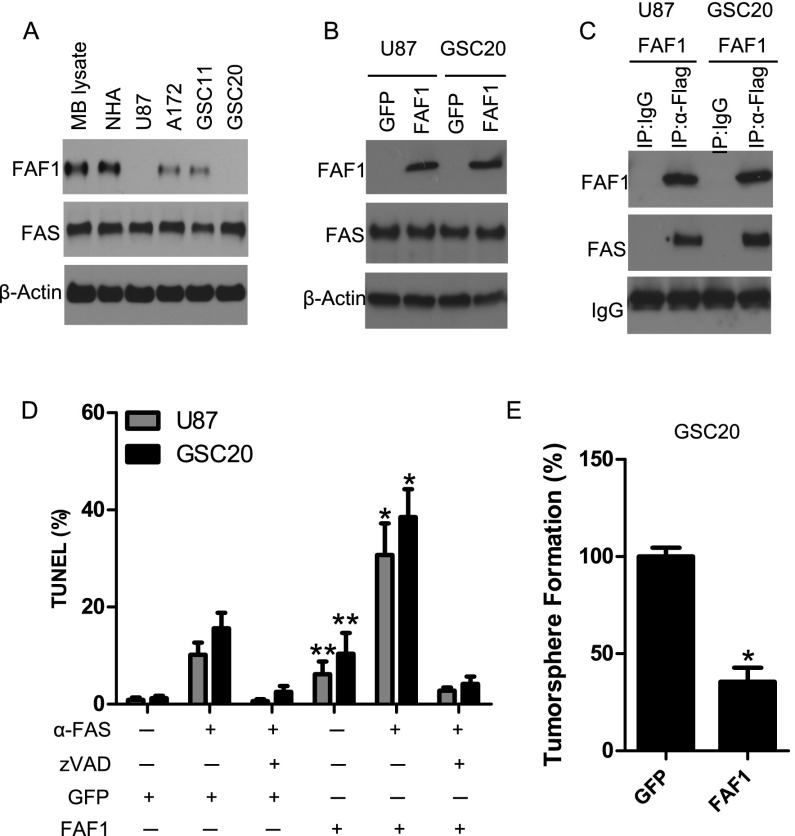
With the advent of high-throughput sequencing technologies, much progress has been made in the identification of somatic structural rearrangements in cancer genomes. However, characterization of the complex alterations and their associated mechanisms remains inadequate. Here, we report a comprehensive analysis of whole-genome sequencing and DNA copy number data sets from The Cancer Genome Atlas to relate chromosomal alterations to imbalances in DNA dosage and describe the landscape of intragenic breakpoints in glioblastoma multiforme (GBM). Gene length, guanine-cytosine (GC) content, and local presence of a copy number alteration were closely associated with breakpoint susceptibility. A dense pattern of repeated focal amplifications involving the murine double minute 2 (MDM2)/cyclin-dependent kinase 4 (CDK4) oncogenes and associated with poor survival was identified in 5% of GBMs. Gene fusions and rearrangements were detected concomitant within the breakpoint-enriched region. At the gene level, we noted recurrent breakpoints in genes such as apoptosis regulator FAF1. Structural alterations of the FAF1 gene disrupted expression and led to protein depletion. Restoration of the FAF1 protein in glioma cell lines significantly increased the FAS-mediated apoptosis response. Our study uncovered a previously underappreciated genomic mechanism of gene deregulation that can confer growth advantages on tumor cells and may generate cancer-specific vulnerabilities in subsets of GBM.

Keywords: Glioblastoma multiforme; The Cancer Genome Atlas; gene fusion; genomic instability; genomic rearrangement; intragenic breakpoint.


Figures

Figure 1.
Figure 1.
The landscape of intragenic breakpoints in GBM. (A) Circos plot of intragenic breakpoints identified using copy number profiles of 537 GBMs. The outermost circle represents chromosomes and cytogenetic bands. The next circle represents significant copy number alterations identified using genomic identification of significant targets in cancer (GISTIC) (Beroukhim et al. 2007). Green indicates deletion, and red indicates amplification. The purple circle represents the frequency of intragenic breakpoints. The black text circle lists selected genes with frequent breakpoints, and the innermost circle lists known GBM driver genes. (B) Genes with frequent breakpoints (n ≥ 10) show greater length and lower GC content. Each dot represents a gene. Green means the gene is close to or in a deletion peak, and red means the same for an amplification peak. The asterisk means the gene is in a chromosome-fragile site. Interquartile reference GC content and gene length are indicated by purple and blue bars. (C) Linear correlation of the number of intragenic breakpoints and chromosome arm lengths. Red and green indicate whether the arm is frequently targeted by amplification or deletion determined by GISTIC.
Figure 2.
Figure 2.
A shattered copy number pattern is observed on 12q14-15. (A) Breakpoint frequency on 12q per 1-Mb bin, across 537 GBMs. (B) Integrative genomics viewer (IGV) copy number screenshot of the 18-Mb region in GBMs. Red and blue represent copy number gain and loss, respectively.
Figure 3.
Figure 3.
The 12q14-15 BER samples show coamplification of CDK4 and MDM2. (A) Significant coamplification of CDK4 and MDM2 in BER samples. GISTIC thresholded copy number data in data freeze October 10, 2012, were used (n = 536). (B) A diagram shows transcript fusions in the 12q14-12q15 region in TCGA-19-2624. Red and blue represent amplification and deletion on DNA copy number.
Figure 4.
Figure 4.
Kaplan-Meier survival curve of 12q14-15 BER samples and CDK4/MDM2 coamplified samples. GCIMP samples were excluded from the analysis because of their reported favorable outcomes. Of the 493 well-classified samples, 454 had clinical data that were used in the analysis.
Figure 5.
Figure 5.
FAF1 intragenic break disrupts protein production and reduces FAS-mediated apoptosis. (A) Expression of endogenous FAF1 protein in the mouse brain (MB lysate), normal human astrocytes (NHA), established glioma cell lines, and glioma stem cell lines. A mouse monoclonal antibody was used to probe the C-terminal sequence of FAF1 protein. (B) Overexpression of the Flag-tagged FAF1 gene in glioma cells harboring N-terminal deletion of the FAF1 gene. Wild-type FAS levels are shown. Green fluorescent protein (GFP) was used as control. (C) FAF1 interacts with FAS in glioma cells. Cell lysate was immunoprecipitated by anti-Flag antibody. Isotype IgG was used as Immunoprecipitation control. (D) FAF1 enhances FAS-mediated induction of apoptosis in glioma cells. TUNEL assay was used to detect apoptotic cells following anti-FAS antibody or treatment with pan-caspase inhibitor zVAD. (*) P < 0.05 as compared with GFP control treated with anti-FAS antibody; (**) P < 0.05 as compared with GFP control. (E) FAF1 impairs the tumorsphere formation of glioma-initiating cells. GSC20 cells stably expressing GFP or FAF1 were dissociated into single cells and grown for 7 d. Tumorspheres in the GFP group were treated as 100%. (*) P < 0.05 as compared with GFP control.

Comment in

References

    1. Altomare DA, Menges CW, Pei J, Zhang L, Skele-Stump KL, Carbone M, Kane AB, Testa JR 2009. Activated TNF-α/NF-κB signaling via down-regulation of Fas-associated factor 1 in asbestos-induced mesotheliomas from Arf knockout mice. Proc Natl Acad Sci 106: 3420–3425 - PMC - PubMed
    1. Baca SC, Prandi D, Lawrence MS, Mosquera JM, Romanel A, Drier Y, Park K, Kitabayashi N, Macdonald TY, Ghandi M, et al. 2013. Punctuated evolution of prostate cancer genomes. Cell 153: 666–677 - PMC - PubMed
    1. Barretina J, Caponigro G, Stransky N, Venkatesan K, Margolin AA, Kim S, Wilson CJ, Lehar J, Kryukov GV, Sonkin D, et al. 2012. The Cancer Cell Line Encyclopedia enables predictive modelling of anticancer drug sensitivity. Nature 483: 603–607 - PMC - PubMed
    1. Bass AJ, Lawrence MS, Brace LE, Ramos AH, Drier Y, Cibulskis K, Sougnez C, Voet D, Saksena G, Sivachenko A, et al. 2011. Genomic sequencing of colorectal adenocarcinomas identifies a recurrent VTI1A-TCF7L2 fusion. Nat Genet 43: 964–968 - PMC - PubMed
    1. Bengtsson H, Wirapati P, Speed TP 2009. A single-array preprocessing method for estimating full-resolution raw copy numbers from all Affymetrix genotyping arrays including GenomeWideSNP 5 & 6. Bioinformatics 25: 2149–2156 - PMC - PubMed

Publication types

MeSH terms

Substances