. 2013 Jul 1;210(7):1403-18.
doi: 10.1084/jem.20122426.

Identification of beryllium-dependent peptides recognized by CD4+ T cells in chronic beryllium disease

Affiliations

Identification of beryllium-dependent peptides recognized by CD4+ T cells in chronic beryllium disease

Michael T Falta et al. J Exp Med. .

Abstract

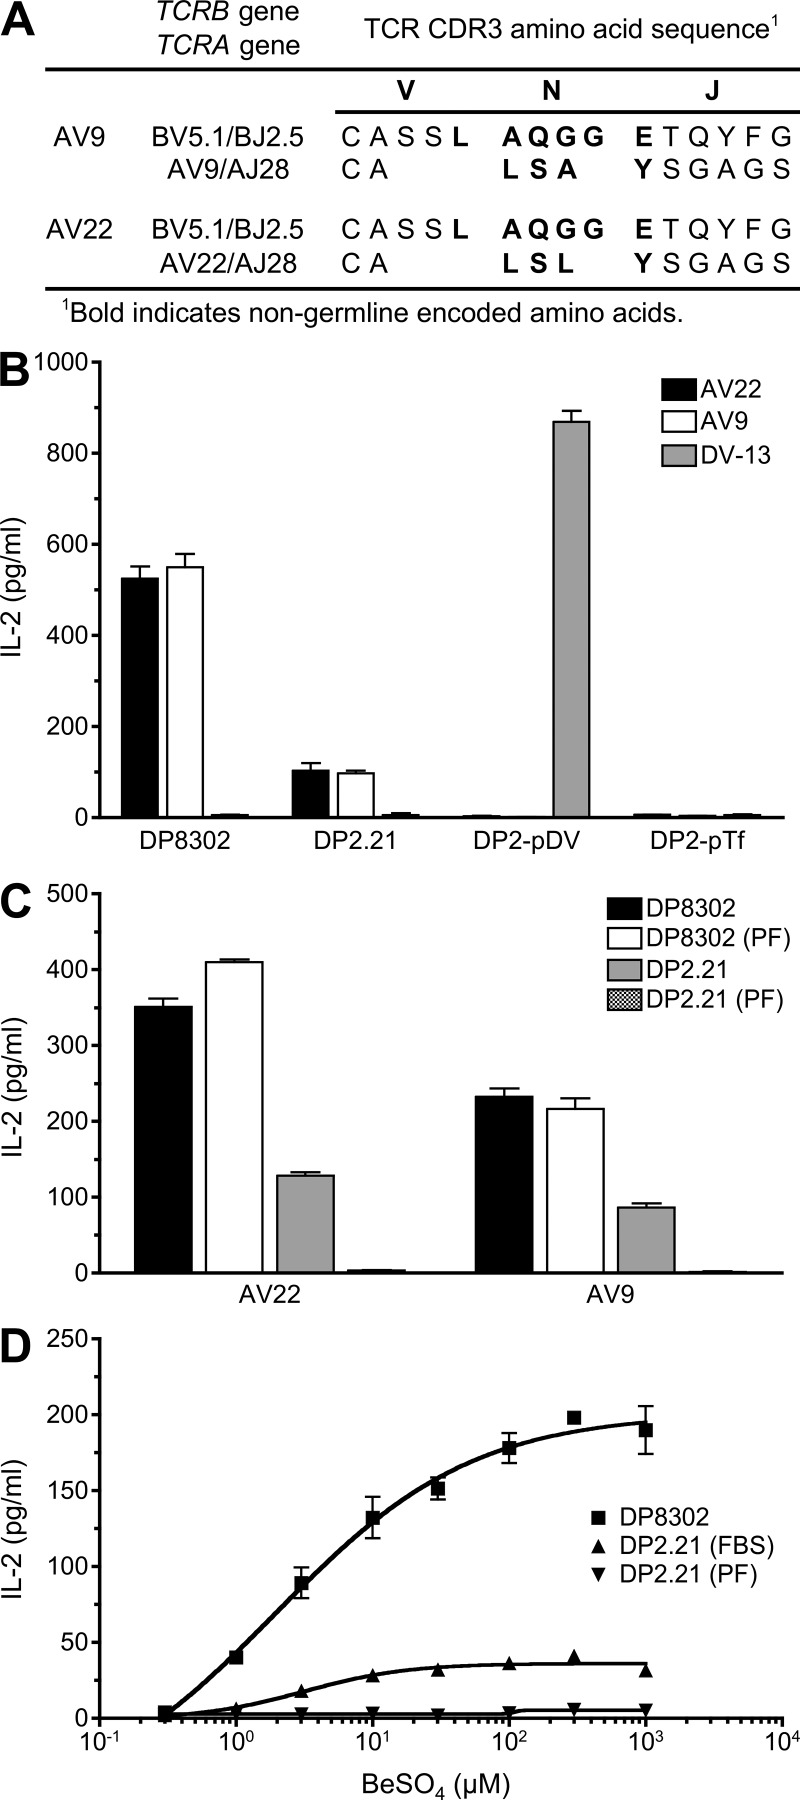
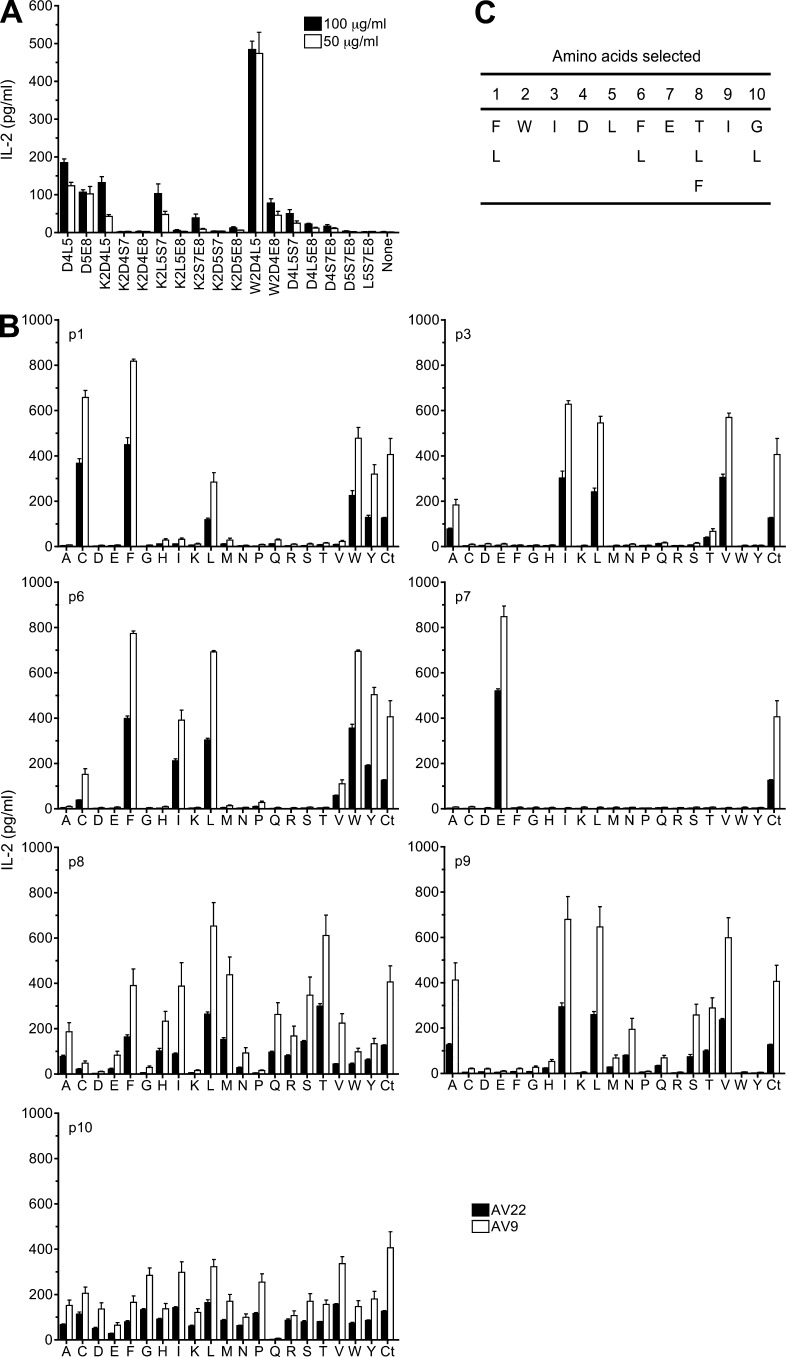
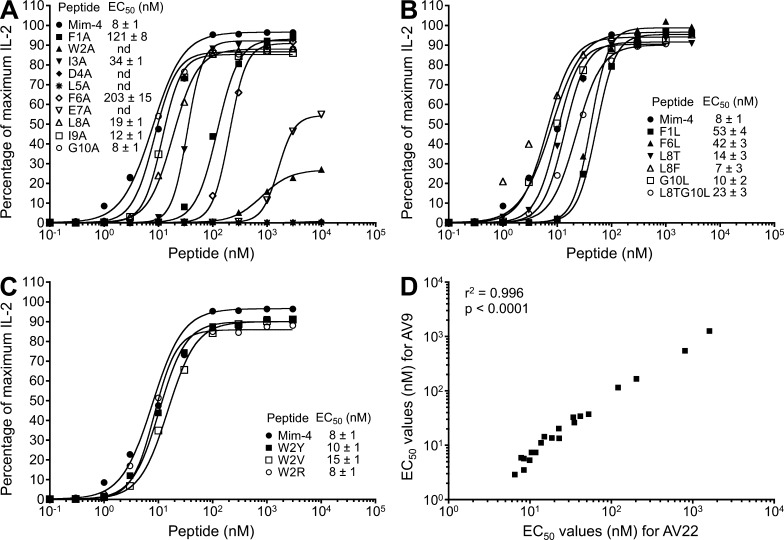
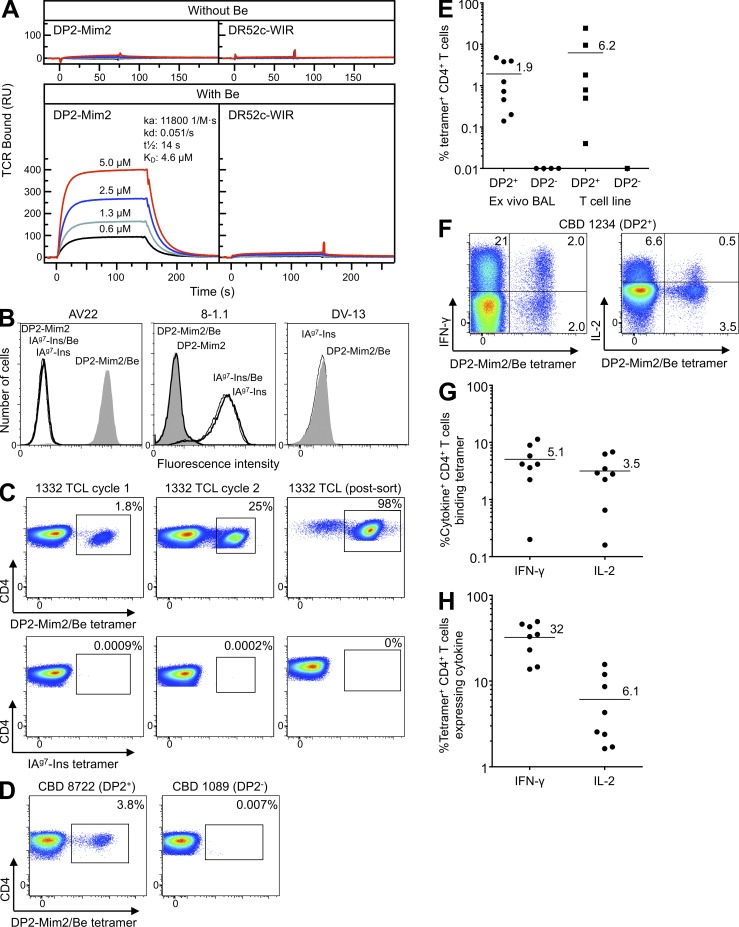
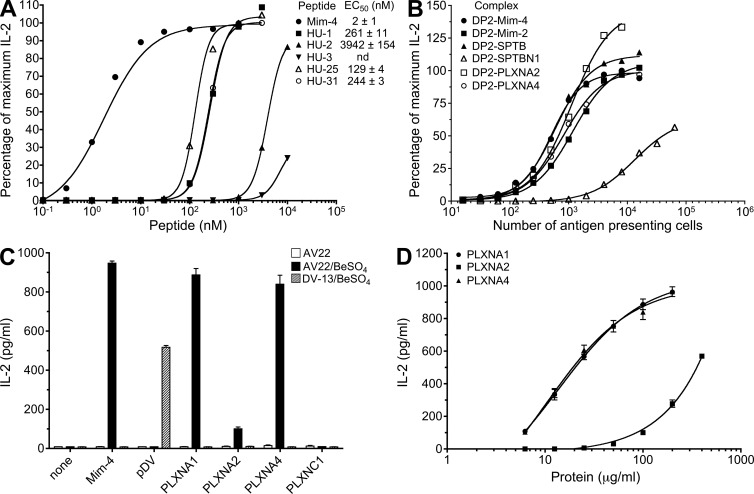
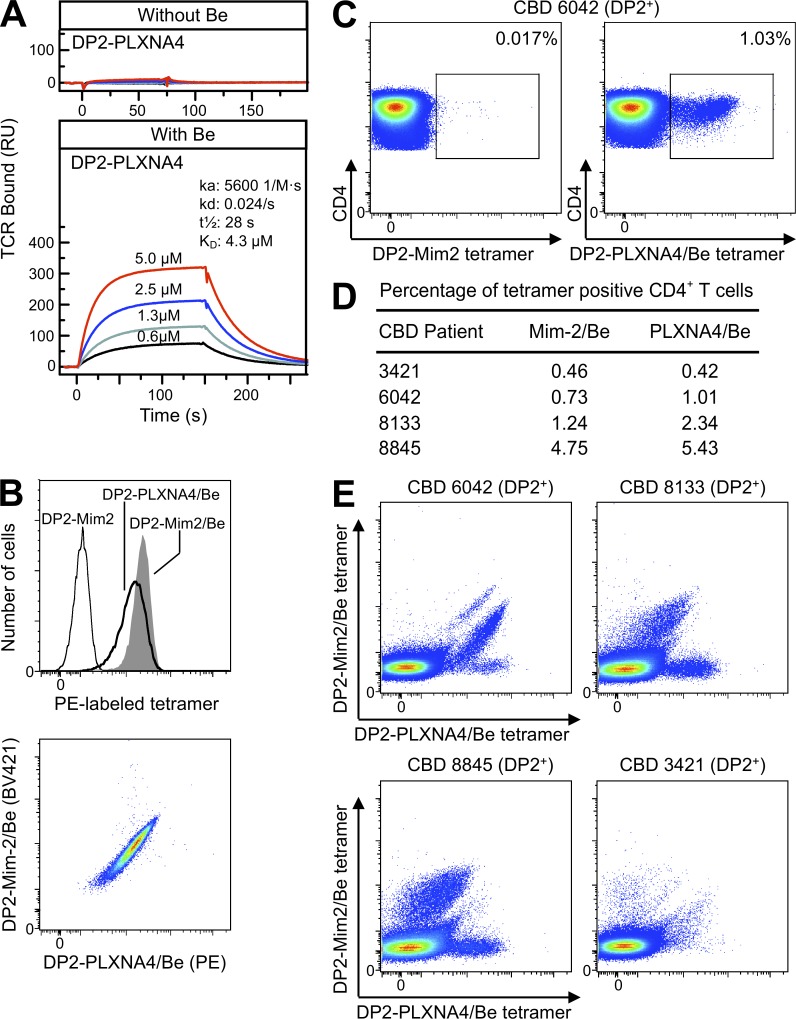
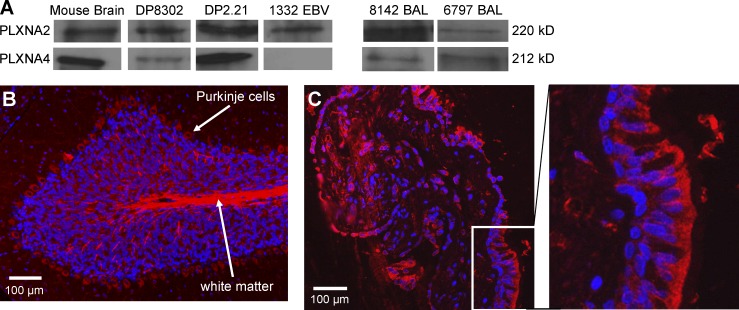
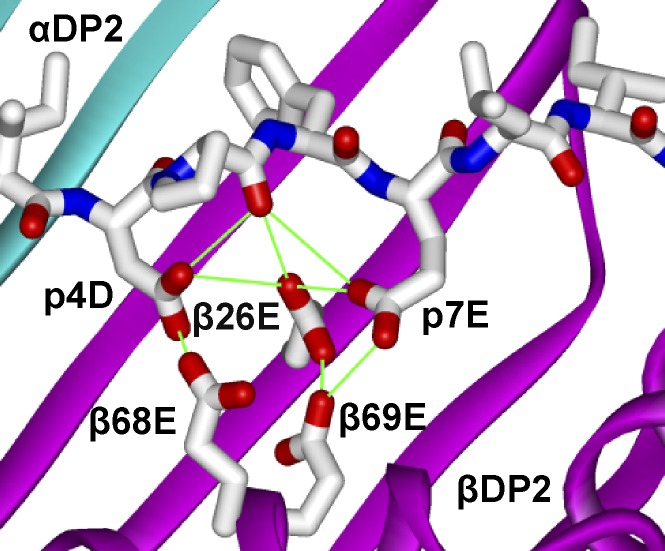
Chronic beryllium disease (CBD) is a granulomatous disorder characterized by an influx of beryllium (Be)-specific CD4⁺ T cells into the lung. The vast majority of these T cells recognize Be in an HLA-DP–restricted manner, and peptide is required for T cell recognition. However, the peptides that stimulate Be-specific T cells are unknown. Using positional scanning libraries and fibroblasts expressing HLA-DP2, the most prevalent HLA-DP molecule linked to disease, we identified mimotopes and endogenous self-peptides that bind to MHCII and Be, forming a complex recognized by pathogenic CD4⁺ T cells in CBD. These peptides possess aspartic and glutamic acid residues at p4 and p7, respectively, that surround the putative Be-binding site and cooperate with HLA-DP2 in Be coordination. Endogenous plexin A peptides and proteins, which share the core motif and are expressed in lung, also stimulate these TCRs. Be-loaded HLA-DP2–mimotope and HLA-DP2–plexin A4 tetramers detected high frequencies of CD4⁺ T cells specific for these ligands in all HLADP2+ CBD patients tested. Thus, our findings identify the first ligand for a CD4⁺ T cell involved in metal-induced hypersensitivity and suggest a unique role of these peptides in metal ion coordination and the generation of a common antigen specificity in CBD.


Figures

Figure 1.
Figure 1.
Be-specific CD4+ T cells require Be and a specific peptide for antigen recognition. (A) TCR gene segment usage and junctional region amino acid sequence of the Be-specific T cell hybridomas AV22 and AV9. (B) Be-specific (AV22 and AV9) and dengue virus–specific (DV-13) T cell hybridomas were stimulated with the following antigen-presenting cell lines: HLA-DP2–transfected mouse DAP3.L cells (DP8302), fibroblasts (B6 DK10) derived from MHCII- and invariant chain-deficient mice and transfected with native HLA-DP2 (DP2.21), and B6 DK10 cells transfected with HLA-DP2 with a transferrin receptor peptide (DP2-pTf, EPLSYTRFSLAR) or a dengue virus NS3–derived peptide (DP2-pDV, REIVDLMCHATF) covalently attached to the N terminus of the DP2 β-chain. 200 µM BeSO4 was added to all antigen-presenting cells except DP2-pDV–expressing fibroblasts, and the IL-2 response (mean ± SEM pg/ml) by the hybridomas was measured by ELISA. (C) AV22 and AV9 T cell hybridomas were stimulated with 200 µM BeSO4 presented by HLA-DP2–transfected fibroblasts grown in either FBS or protein-free (PF) medium. IL-2 secretion (mean ± SEM pg/ml) was measured by ELISA. (B and C) Data shown are representative of three experiments performed in triplicate. (D) AV22 hybridoma cells were stimulated over a range of BeSO4 concentrations (0.3–1,000 µM) using DP8302 cells grown in FBS-containing medium compared with DP2.21 cells grown in FBS and protein-free conditions. Data shown (mean IL-2 ± SD pg/ml) are representative of three experiments performed in triplicate.
Figure 2.
Figure 2.
Deconvolution strategy to define Be-dependent peptides that stimulate T cell hybridomas AV22 and AV9. (A) AV22 cells were stimulated with selected decapeptide mixtures with three positions fixed in the presence of 75 µM BeSO4. Two concentrations of mixtures were used, and IL-2 response (mean ± SEM pg/ml) was measured by ELISA. Mixtures with two fixed positions (D4L5 and D5E8) were included as positive controls. Data are representative of three separate experiments performed in triplicate. (B) IL-2 response of three separate experiments (mean ± SEM) of AV22 and AV9 to a biased decapeptide positional scanning library (W2D4L5) is shown. Peptide mixtures were fixed at W2, D4, and L5, and one additional peptide position (p1, p3, p6, p7, p8, p9, and p10) was scanned with each of 20 amino acids (140 mixtures). Each panel shows the response of hybridomas to 20 µg/ml mixtures and 75 µM BeSO4 compared with the W2D4L5 mixture with no additional fixed positions (Ct). For A and B, the x axis denotes the amino acid (single letter code) fixed at each defined position, and mixtures did not stimulate hybridomas in the absence of BeSO4. (C) Selection of amino acids for each peptide position based on the most active mixtures in the presence of BeSO4.
Figure 3.
Figure 3.
Be-specific T cell hybridoma response to alanine substitutions and analogues of mimotope-4. Peptide dose–response curves were completed for T cell hybridoma AV22. (A–C) Equal numbers of AV22 cells and DP2.21 antigen-presenting cells were mixed with 75 µM BeSO4 and the following highly purified peptides: peptides with single alanine substitutions at each position of mimotope-4 (A), analogues of mimotope-4, selected based on the demonstrated potency of other mimotopes (B), and mimotope-4 variants at the p2 position of the peptide (C). IL-2 secretion was measured by ELISA after 22 h of culture, and data are plotted as the percentage of maximum IL-2 secretion against peptide concentration in the presence of BeSO4. EC50 values (mean ± SEM nM) for mimotope-4 and each variant peptide from four independent experiments are shown. Note that error bars have been left out for viewing clarity. (D) Correlation of EC50 values of all variants of mimotope-4 between hybridomas AV22 and AV9.
Figure 4.
Figure 4.
HLA-DP2–mimotope-2/Be tetramer staining of Be-specific T cell lines and ex vivo BAL cells from CBD patients. (A) Approximately 2,000 resonance units (RU) of biotinylated HLA-DP2–mimotope-2 and control HLA-DR52c–WIR complex were immobilized in flow cells of a BIAcore streptavidin biosensor chip. Various concentrations of soluble AV22 TCR were injected through the flow cells before and after loading with 200 µM BeSO4, and the surface plasmon resonance signal was obtained. Data shown are representative of three independent experiments. (B) Staining of T cell hybridomas (Be-specific AV22, insulin B:9-23–specific 8-1.1, and dengue virus–specific DV-13) with HLA-DP2–mimotope-2 (DP2-Mim2) and IAg7-insulin (IAg7-Ins) tetramers prepared into complexes either in the presence or absence of BeSO4. Cells were stained with 20 µg/ml of tetramers, and fluorescence intensity was evaluated by flow cytometry. Representative results from three independent experiments are shown. All hybridomas expressed high levels of TCR (not depicted). (C) Detection of HLA-DP2–mimotope-2/Be tetramer–binding T cells from parental T cell line derived from CBD patient 1332. BAL T cells after one and two cycles of stimulation with BeSO4 and after Vβ5.1 sorting were stained with the HLA-DP2–mimotope-2/Be (top) and IAg7-insulin (bottom) tetramers, and the frequency of CD4+ T cells stained with each tetramer is shown in each density plot. Representative staining results from two independent experiments are shown. (D) HLA-DP2–mimotope-2/Be tetramer staining of ex vivo BAL cells from CBD patients who are HLA-DP2+ (8722) and HLA-DP2 (1089). Density plots show tetramer staining of CBD patients, excluding cells staining with CD8, CD14, and CD19, and gating for CD3 and CD4 expression. Results are representative of ex vivo BAL cells from eight HLA-DP2+ and four HLA-DP2 CBD subjects. (E) Frequency (mean) of CD4+ T cells staining with the HLA-DP2–mimotope-2/Be tetramer is shown for ex vivo BAL cells (n = 12) and BAL T cell lines (n = 7) derived from DP2+ and DP2 CBD patients. Frequency was determined by subtracting nonspecific staining observed with the control tetramer from staining with the HLA-DP2 tetramer. (F) Flow cytometric analysis of dual intracellular cytokine and tetramer staining of ex vivo BAL cells from a DP2+ CBD patient is shown. Density plots show IFN-γ (left) and IL-2 (right) expression relative to HLA-DP2–mimotope-2/Be tetramer staining. Data are representative of the eight HLA-DP2+ CBD subjects studied. (G and H) For ex vivo BAL cells, the mean frequency of IFN-γ– and IL-2–expressing CD4+ T cells that bind the HLA-DP2–mimotope-2/Be tetramer (G) and the frequency of tetramer-positive cells that secrete these cytokines (H) are shown. (E, G, and H) Mean values for each group are indicated with horizontal bars.
Figure 5.
Figure 5.
Characterization of candidate endogenous peptides that stimulate Be-specific T cell hybridomas. (A) Dose–response curves to stimulatory peptides identified from the biometric analysis of T cell hybridoma AV22 are shown. Equal numbers of AV22 cells and DP2.21 antigen-presenting cells were mixed with 75 µM BeSO4 and highly purified peptides. IL-2 secretion was measured by ELISA after 22 h of culture, and data are plotted as the percentage of maximum IL-2 secretion against concentration of peptide in the presence of BeSO4. EC50 values (mean ± SEM nM) for mimotope-4 and each human peptide from four independent experiments are shown. Note that error bars have been left out for viewing clarity. (B) AV22 response to antigen-presenting cells expressing HLA-DP2 with spectrin and plexin peptides covalently attached to the N terminus of the β-chain. Percentage of maximum IL-2 secretion versus the number of antigen-presenting cells added per well is shown. Results are representative of three independent experiments. (C) IL-2 response (mean ± SD pg/ml) of AV22 and dengue virus–specific hybridoma DV-13 to plexin proteins presented by an EBV-transformed B cell line derived from CBD patient 1332 is shown. Plexin proteins (A1, A2, A4, and C1, all at 100 µg/ml) were added in the presence and absence of 75 µM BeSO4. Control peptides, mimotope-4 and dengue viral peptide, were added at 100 nM and 20 µM, respectively. Representative results from three independent experiments are shown. (D) Dose–response curves of AV22 to plexin A1, A2, and A4 proteins presented by EBV-transformed B cells in the presence of 75 µM BeSO4 are shown. Representative results from three independent experiments (mean IL-2 ± SD pg/ml) performed in triplicate are shown.
Figure 6.
Figure 6.
HLA-DP2–PLXNA4/Be tetramer staining of ex vivo BAL cells from CBD patients. (A) The binding kinetics of soluble AV22 TCR to biotinylated HLA-DP2–PLXNA4 with and without Be are shown. Four concentrations of soluble AV22 TCR were injected through the flow cells before and after loading with 200 µM BeSO4, and the surface plasmon resonance signal was obtained. Data shown are representative of three independent experiments. (B) Staining of the AV22 T cell hybridoma with HLA-DP2–mimotope-2, HLA-DP2–mimotope-2/Be, and HLA-DP2–PLXNA4/Be tetramers individually (top) and costaining with Be-saturated mimotope-2 (BV421 labeled) and PLXNA4 (PE labeled) tetramers (bottom). The fluorescence intensity of cells was evaluated after staining with 20 µg/ml of tetramers for 2 h at 37°C. Representative results from three independent experiments are shown. (C) Density plots showing control HLA-DP2–mimotope-2 without Be (left) and HLA-DP2–PLXNA4/Be (right) tetramer staining of CD4+ T cells from ex vivo BAL cells of a HLA-DP2+ CBD patient. Results are representative of four HLA-DP2+ CBD subjects stained. (D) Summary of the frequency of tetramer staining of ex vivo BAL CD4+ T cells from four HLA-DP2+ CBD patients individually stained with the HLA-DP2–mimotope-2/Be and HLA-DP2–PLXNA4/Be tetramers. (E) Density plots of ex vivo BAL cells from four DP2+ CBD patients costained with HLA-DP2–PLXNA4/Be and HLA-DP2–mimotope-2/Be tetramers are shown.
Figure 7.
Figure 7.
Distribution of plexin A proteins in antigen-presenting cells, BAL fluid, and lung tissue derived from CBD patients. (A) Western blot analysis of cell extracts from the mouse fibroblast cell lines (DP8302 and DP2.21) and EBV-transformed B cells from CBD patient 1332 and BAL fluid from two representative CBD patients is shown. Anti-plexin antibodies cross-react to mouse and human plexin A2 and A4. BAL fluid samples were concentrated 300-fold and resolved on a 7.5% polyacrylamide gel. Results are representative of a minimum of three independent experiments for cell extracts and BAL fluids. (B and C) Immunofluorescence staining of plexin A2 (red) and cell nuclei (blue) in mouse cerebellum (B) and transbronchial lung biopsy tissue from a CBD patient (C) is shown. An enlarged view of the area within the white box in C showing plexin A2 expression in bronchial epithelial cells is shown in the right panel. Results are representative of the three transbronchial lung biopsy specimens analyzed.
Figure 8.
Figure 8.
Model of mimotope-2 in the peptide-binding groove of HLA-DP2. The amino acids of mimotope-2 were introduced into the peptide of the HLA-DP2–pDRa structure (Protein Data Bank accession no. 3LQZ) using Swiss PDB Viewer 4.0. Rotamers of the amino acids of mimotope-2 that avoided conflict with the structure were selected. Ribbon representations of DP2 α (cyan)- and DP2 β (magenta)-chains are shown. Wireframe representations of the side chains of mimotope-2, βGlu26, βGlu68, and βGlu69 with CPK coloring are shown.

References

    1. Bill J.R., Mack D.G., Falta M.T., Maier L.A., Sullivan A.K., Joslin F.G., Martin A.K., Freed B.M., Kotzin B.L., Fontenot A.P. 2005. Beryllium presentation to CD4+ T cells is dependent on a single amino acid residue of the MHC class II β-chain. J. Immunol. 175:7029–7037 - PubMed
    1. Boen E., Crownover A.R., McIlhaney M., Korman A.J., Bill J. 2000. Identification of T cell ligands in a library of peptides covalently attached to HLA-DR4. J. Immunol. 165:2040–2047 - PubMed
    1. Bowerman N.A., Falta M.T., Mack D.G., Kappler J.W., Fontenot A.P. 2011. Mutagenesis of beryllium-specific TCRs suggests an unusual binding topology for antigen recognition. J. Immunol. 187:3694–3703 10.4049/jimmunol.1101872 - DOI - PMC - PubMed
    1. Crawford F., Kozono H., White J., Marrack P., Kappler J. 1998. Detection of antigen-specific T cells with multivalent soluble class II MHC covalent peptide complexes. Immunity. 8:675–682 10.1016/S1074-7613(00)80572-5 - DOI - PubMed
    1. Crawford F., Stadinski B., Jin N., Michels A., Nakayama M., Pratt P., Marrack P., Eisenbarth G., Kappler J.W. 2011. Specificity and detection of insulin-reactive CD4+ T cells in type 1 diabetes in the nonobese diabetic (NOD) mouse. Proc. Natl. Acad. Sci. USA. 108:16729–16734 10.1073/pnas.1113954108 - DOI - PMC - PubMed

Publication types

MeSH terms