. 2013 Oct;32(10):1901-9.
doi: 10.1109/TMI.2013.2268978. Epub 2013 Jun 17.

Including spatial information in nonlinear inversion MR elastography using soft prior regularization

Including spatial information in nonlinear inversion MR elastography using soft prior regularization

Matthew McGarry et al. IEEE Trans Med Imaging. 2013 Oct.

Abstract

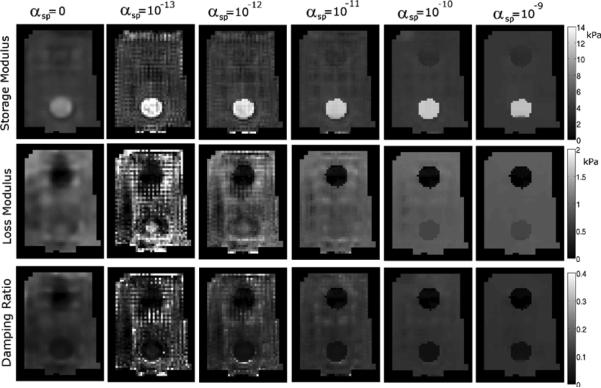
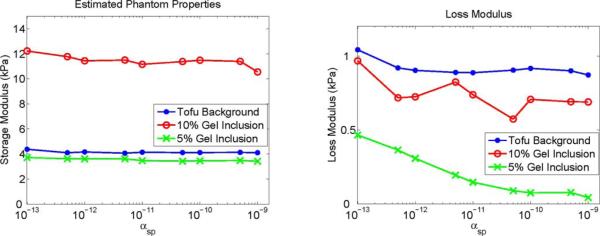
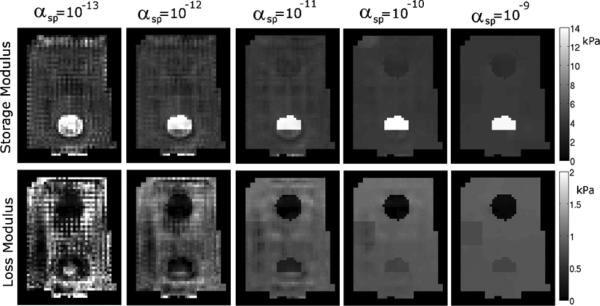
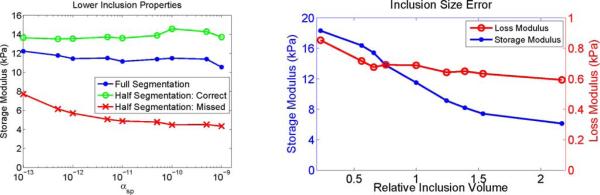
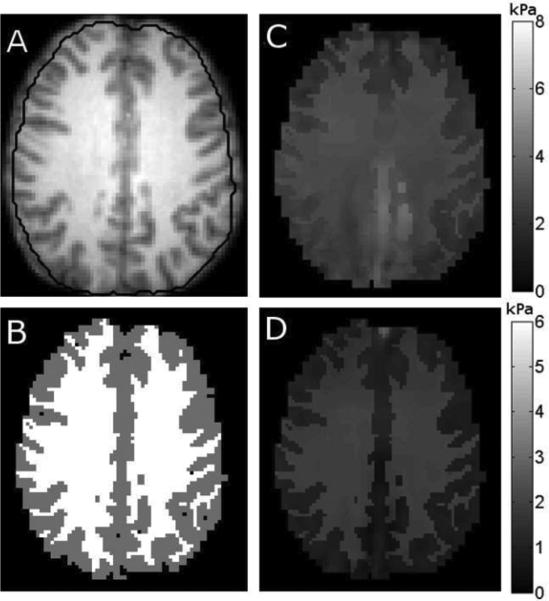
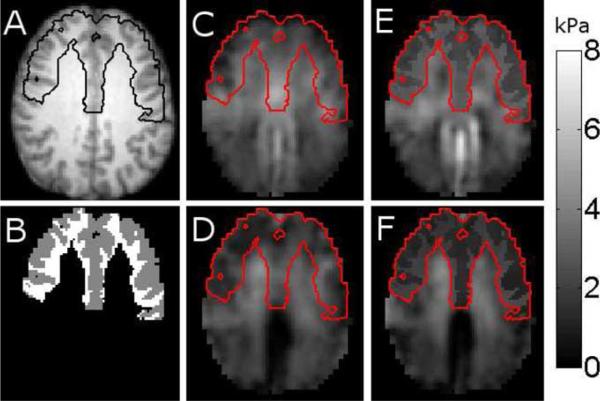
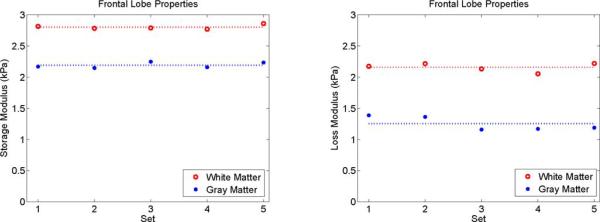
Tissue displacements required for mechanical property reconstruction in magnetic resonance elastography (MRE) are acquired in a magnetic resonance imaging (MRI) scanner, therefore, anatomical information is available from other imaging sequences. Despite its availability, few attempts to incorporate prior spatial information in the MRE reconstruction process have been reported. This paper implements and evaluates soft prior regularization (SPR), through which homogeneity in predefined spatial regions is enforced by a penalty term in a nonlinear inversion strategy. Phantom experiments and simulations show that when predefined regions are spatially accurate, recovered property values are stable for SPR weighting factors spanning several orders of magnitude, whereas inaccurate segmentation results in bias in the reconstructed properties that can be mitigated through proper choice of regularization weighting. The method was evaluated in vivo by estimating viscoelastic mechanical properties of frontal lobe gray and white matter for five repeated scans of a healthy volunteer. Segmentations of each tissue type were generated using automated software, and statistically significant differences between frontal lobe gray and white matter were found for both the storage modulus and loss modulus . Provided homogeneous property assumptions are reasonable, SPR produces accurate quantitative property estimates for tissue structures which are finer than the resolution currently achievable with fully distributed MRE.


Figures

Fig. 1
Fig. 1
Example slice of the 3-D simulated brain experiment. The 1.3 mm resolution gray (GM) and white matter (WM) distribution in A was used to generate a high resolution displacement field, one component of which is shown in C. High-resolution field was then sampled at 2 mm to simulate MRE data acquisition, the resulting gray and white matter segmentation is shown in B, and the MRE displacement field in D. Finite element meshing process does not allow elements to extend outside the mask and results in some erosion of the boundaries.
Fig. 2
Fig. 2
MR magnitude image of the phantom (left) with the correct (center) and incorrect (right) segmentation. Background is silken soft tofu, the upper inclusion is 5% gelatin, and the lower inclusion is 10% gelatin. Each region utilized by the SPR is indicated by a different color, and regions where average property values are reported are designated with letters. Region G is the portion of the lower inclusion that is incorrectly included as part of the background. Region H is a false segmentation of the background.
Fig. 3
Fig. 3
Representative slice of MRE reconstructions with simulated data (see Fig. 1). Left column of images shows the high resolution property distribution used to generate the simulated displacement data. Other columns show reconstructions without SPR (center) and with SPR (right). Images computed from displacement data with 0% and 5% added noise are shown for the storage modulus (upper images) and loss modulus (lower images).
Fig. 4
Fig. 4
Recovered storage and loss modulus values as a function of simulated MR measurement noise (mean values over each region). True property values used to generate the simulated displacements are indicated by dotted lines.
Fig. 5
Fig. 5
Representative slice of the recovered properties from a tofu phantom with an accurate SPR segmentation. Each column shows results generated with the indicated value of αsp. At low αsp values the property solutions become noisy due to insufficient regularization because spatial filtering and total variation minimization are disabled in these cases. When αsp = 0, standard spatial filtering and total variation minimization weights were used.
Fig. 6
Fig. 6
Property values of each phantom material using SPR with the correct segmentation as a function of αsp.
Fig. 7
Fig. 7
Representative slice of the recovered properties from a tofu phantom with errors in the SPR segmentation (see Fig. 2). Each column shows results generated with the value of αsp indicated.
Fig. 8
Fig. 8
Plots illustrating the effect of segmentation errors on recovered properties. Left: Mean properties of the 10% gelatin inclusion as a function of αsp. The “full segmentation,” “half segmentation: correct,” and “half segmentation: missed” labels correspond to regions A, F, and G, respectively, in Fig. 2. Right: Effect of segmentation size errors on the estimated properties of the 10% gel inclusion with SPR. The recovered inclusion storage and loss moduli are given on the left and right axes, respectively, and the relative inclusion size is the ratio of the segmented inclusion volume to the true volume.
Fig. 9
Fig. 9
Representative slice of brain properties with an inappropriate application of SPR, where all of the white matter and cortical gray matter is assigned to regions. A shows the T1 weighted image with the reconstruction mask marked, B shows the gray and white matter segmentation, C is the storage modulus, and D is the loss modulus.
Fig. 10
Fig. 10
Representative slice of brain properties estimated using fully distributed reconstruction and SPR when the white and gray matter of the frontal lobe were assigned to two regions, and the rest of the tissue was included in region 0 (no SPR). A shows the T1 weighted image with the frontal lobe boundary marked, B shows the gray and white matter segmentation of the frontal lobe. C and D are the reconstructed storage and loss moduli, respectively, for fully distributed reconstruction. E and F are the reconstructed storage and loss moduli when SPR is applied to the frontal lobe. The boundary of the frontal lobe is marked in red on the mechanical property images.
Fig. 11
Fig. 11
Property values of the gray and white matter of the frontal lobe using SPR for repeated scans of the same subject. Means across the five scans are indicated with dotted lines. Statistically significant differences between frontal lobe gray and white matter were found for both storage modulus (p = 8×10⁻⁸) and loss modulus (p = 3 × 10⁻⁷).

Similar articles

Cited by

References

    1. Muthupillai R, Lomas DJ, Rossman PJ, Greenleaf JF, Manduca A, Ehman RL. Magnetic resonance elastography by direct visualization of propagating acoustic strain waves. Science. 1995 Sep.269:1854–1857. - PubMed
    1. Huwart L, et al. Magnetic resonance elastography for the noninvasive staging of liver fibrosis. Gastroenterology. 2008;135(1):32–40. - PubMed
    1. Ehman RL. Science to practice: Can MR elastography be used to detect early steatohepatitis in fatty liver disease. Radiology. 2009;253(1):1. - PubMed
    1. Asbach P, Klatt D, Hamhaber U, Braun J, Somasundaram R, Hamm B, Sack I. Assessment of liver viscoelasticity using multifrequency MR elastography. Magn. Reson. Med. 2008;60(2):373–379. - PubMed
    1. Chen J, Talwalkar JA, Yin M, Glaser KJ, Sanderson SO, Ehman RL. Early detection of nonalcoholic steatohepatitis in patients with nonalcoholic fatty liver disease by using MR elastography. Radiology. 2011;259(3):749–756. - PMC - PubMed

Publication types