

Supervisory control system for monitoring a pharmaceutical hot melt extrusion process
- PMID: 23797304
- PMCID: PMC3755147
- DOI: 10.1208/s12249-013-9992-7
Supervisory control system for monitoring a pharmaceutical hot melt extrusion process
Abstract
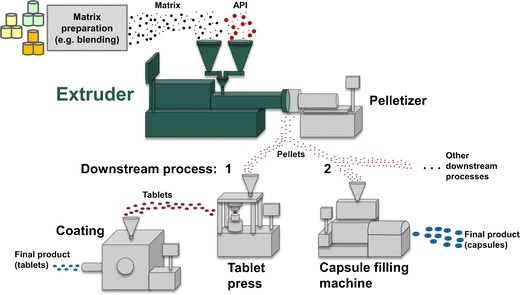
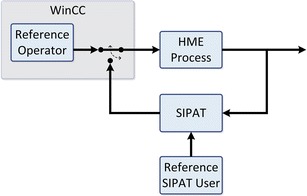
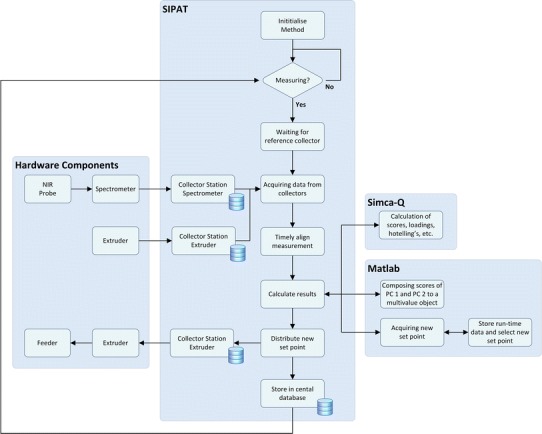
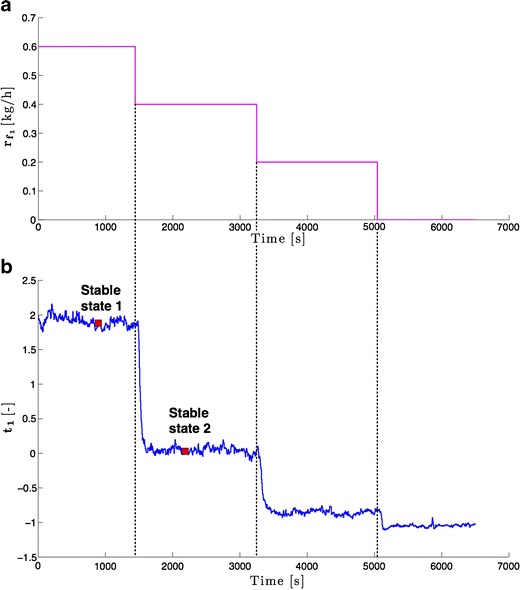
Continuous pharmaceutical manufacturing processes are of increased industrial interest and require uni- and multivariate Process Analytical Technology (PAT) data from different unit operations to be aligned and explored within the Quality by Design (QbD) context. Real-time pharmaceutical process verification is accomplished by monitoring univariate (temperature, pressure, etc.) and multivariate (spectra, images, etc.) process parameters and quality attributes, to provide an accurate state estimation of the process, required for advanced control strategies. This paper describes the development and use of such tools for a continuous hot melt extrusion (HME) process, monitored with generic sensors and a near-infrared (NIR) spectrometer in real-time, using SIPAT (Siemens platform to collect, display, and extract process information) and additional components developed as needed. The IT architecture of such a monitoring procedure based on uni- and multivariate sensor systems and their integration in SIPAT is shown. SIPAT aligned spectra from the extrudate (in the die section) with univariate measurements (screw speed, barrel temperatures, material pressure, etc.). A multivariate supervisory quality control strategy was developed for the process to monitor the hot melt extrusion process on the basis of principal component analysis (PCA) of the NIR spectra. Monitoring the first principal component and the time-aligned reference feed rate enables the determination of the residence time in real-time.
Figures


References
-
- FDA . Guidance for Industry. PAT - a framework for innovative pharmaceutical development, manufacturing, and quality assurance. Quality Assurance. Rockville: US Department of Health; 2004.
-
- ICH. ICH Q8(R2), Pharmaceutical Development, Part I: Pharmaceutical development, and Part II: Annex to pharmaceutical development. 2009.
-
- Simpson, MB (2010) Near-infrared spectroscopy for process analytical technology: theory, technology and implementation. Bakeev, K (ed) Process analytical technology: spectroscopic tools and implementation strategies for the chemical and pharmaceutical industries (second ed.). Wiley: NY, p. 107–55.
-
- Koller DM, Posch A, Hörl G, Voura C, Radl S, Urbanetz N, et al. Continuous quantitative monitoring of powder mixing dynamics by near-infrared spectroscopys. Powder Technol. 2011;205(1–3):87–96. doi: 10.1016/j.powtec.2010.08.070. - DOI
MeSH terms
LinkOut - more resources
Full Text Sources
Other Literature Sources
Miscellaneous
