. 2013 Jul 9;110(28):E2552-61.
doi: 10.1073/pnas.1302191110. Epub 2013 Jun 24.

Quantitative dissection of hydrogen bond-mediated proton transfer in the ketosteroid isomerase active site

Affiliations

Quantitative dissection of hydrogen bond-mediated proton transfer in the ketosteroid isomerase active site

Paul A Sigala et al. Proc Natl Acad Sci U S A. .

Abstract

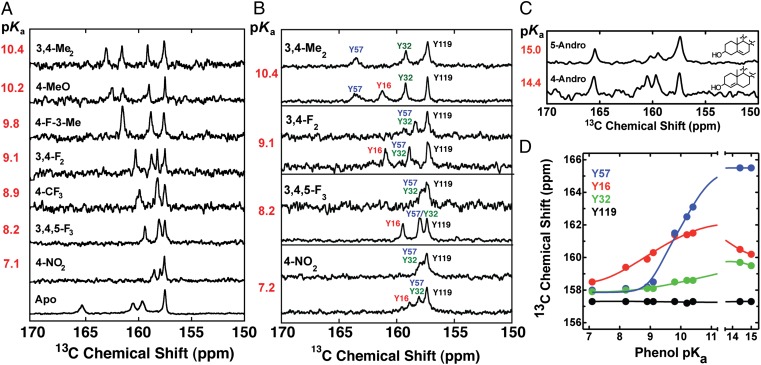
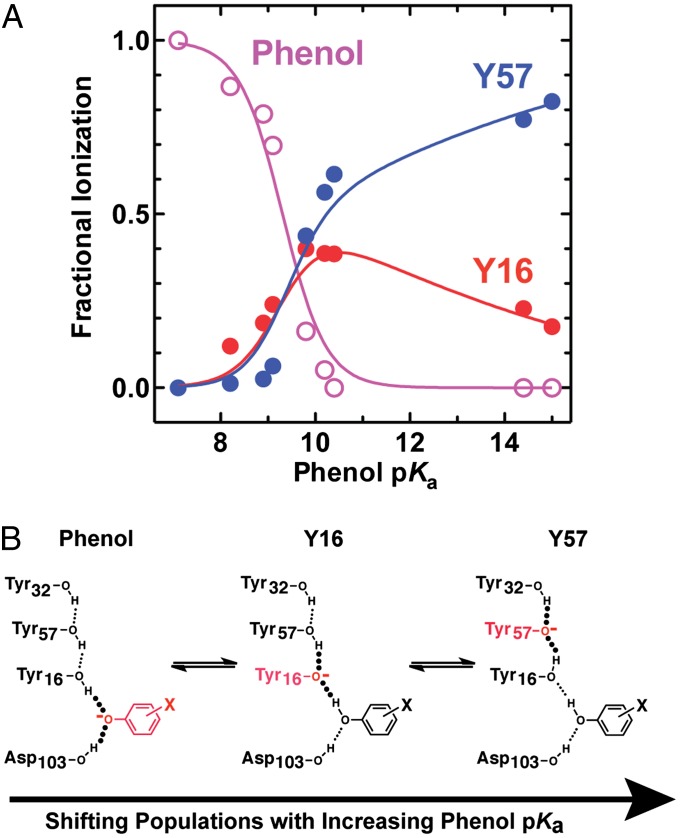
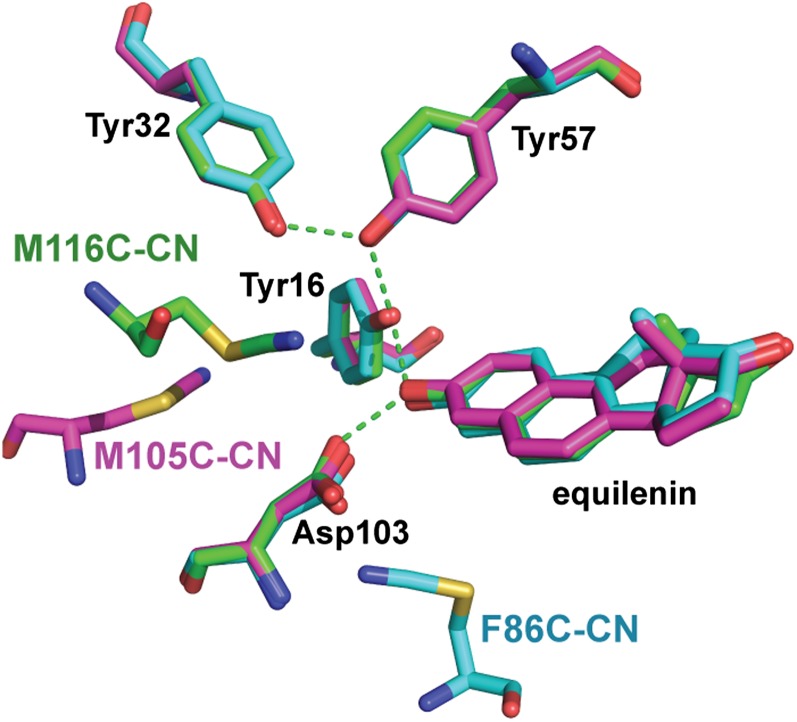
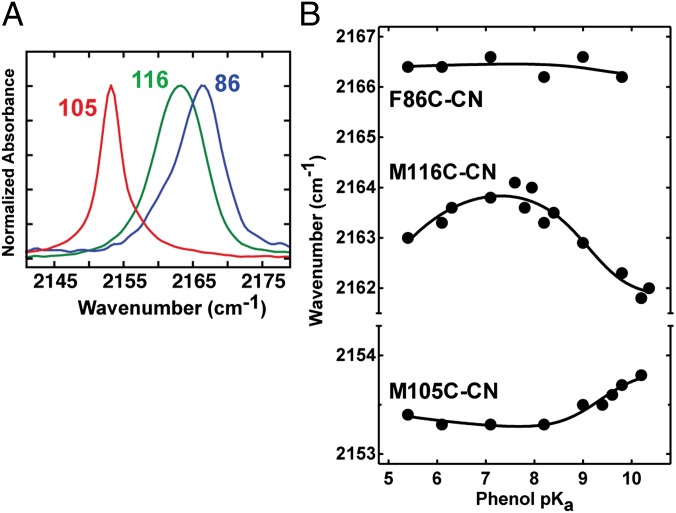
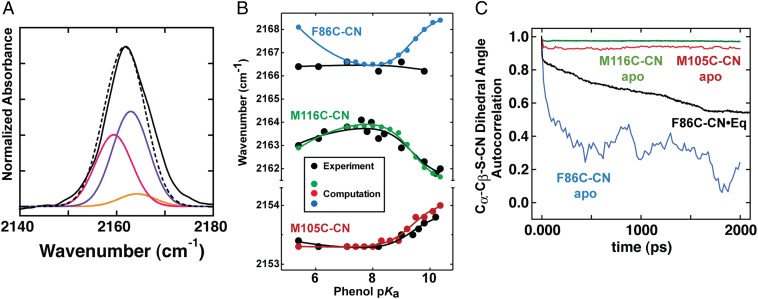
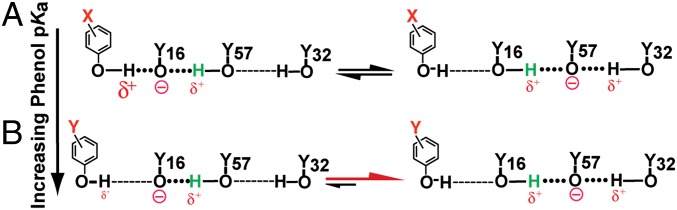
Hydrogen bond networks are key elements of protein structure and function but have been challenging to study within the complex protein environment. We have carried out in-depth interrogations of the proton transfer equilibrium within a hydrogen bond network formed to bound phenols in the active site of ketosteroid isomerase. We systematically varied the proton affinity of the phenol using differing electron-withdrawing substituents and incorporated site-specific NMR and IR probes to quantitatively map the proton and charge rearrangements within the network that accompany incremental increases in phenol proton affinity. The observed ionization changes were accurately described by a simple equilibrium proton transfer model that strongly suggests the intrinsic proton affinity of one of the Tyr residues in the network, Tyr16, does not remain constant but rather systematically increases due to weakening of the phenol-Tyr16 anion hydrogen bond with increasing phenol proton affinity. Using vibrational Stark spectroscopy, we quantified the electrostatic field changes within the surrounding active site that accompany these rearrangements within the network. We were able to model these changes accurately using continuum electrostatic calculations, suggesting a high degree of conformational restriction within the protein matrix. Our study affords direct insight into the physical and energetic properties of a hydrogen bond network within a protein interior and provides an example of a highly controlled system with minimal conformational rearrangements in which the observed physical changes can be accurately modeled by theoretical calculations.

Keywords: active site environment; computational modeling; enzyme catalysis; protein electrostatics; protein semisynthesis.


Conflict of interest statement

The authors declare no conflict of interest.

Figures

Fig. 1.
Fig. 1.
KSI reaction and reaction intermediate analog. (A) KSI reaction mechanism for isomerization of 5-androstene-3,17-dione. (B) Schematic depiction of an ionized substituted phenol bound at the KSI D40N active site.
Fig. 2.
Fig. 2.
Spectroscopic and structural analysis of phenols bound to pKSI D40N. (A) 19F NMR spectra and chemical shifts of the 4-F group for F-substituted phenols bound to KSI at pH 7.2 (black peaks) or free in solution (red dashes) at pH 2 (neutral) or pH 12 (ionized). Phenol pKa values are shown in parentheses. (B) Superposition of the 1.30-Å resolution D40N–3-F-4-NO2-phenol (carbon atoms are colored green; PDB ID code 3VGN) and 1.25-Å resolution D40N–phenol (carbon atoms are colored cyan; PDB ID code 2PZV) X-ray crystal structures. Oxygen, nitrogen, and fluorine atoms are colored red, blue, and magenta, respectively.
Fig. 3.
Fig. 3.
13C NMR spectra of pKSI D40N containing 13Cζ-Tyr labels. (A) Spectra of recombinant D40N uniformly labeled with 13Cζ-Tyr and bound to a series of phenols with increasing solution pKa (values are colored red, and phenol substituent groups are indicated above each spectrum). Spectra of D40N apoenzyme and 4-nitrophenol-bound D40N were previously published (20). (B) Spectra of recombinant (Lower) or semisynthetic (Upper) D40N/R15K/D21N/D24C (explanations of additional mutations are provided in the main text and SI Materials and Methods) bearing 13Cζ-Tyr labels at all four Tyrs (recombinant) or only at Y32/Y57/Y119 (semisynthetic) and bound to the indicated phenols. Peaks have been assigned as described in the text. (C) Spectra of recombinant D40N uniformly labeled with 13Cζ-Tyr and bound to 5-Andro or 4-Andro. For simplicity, only the A and B steroid rings are shown. (D) Chemical shift for each assigned Tyr peak is plotted as a function of phenol pKa. Trend lines are empirical fits to guide the eye.
Fig. 4.
Fig. 4.
Quantitative fractional ionization model of hydrogen bonding groups within the KSI D40N active site with bound phenols of increasing solution pKa. (A) Fractional ionization values (estimated uncertainty ± 0.15) were derived from the 13C NMR data as explained in the main text and SI Materials and Methods. The data were globally fit (R2 values of individual fits = 0.92–0.97) with the equilibrium proton transfer model given in Methods to give best-fit values of 8.6 for parameter a, 0.1 for parameter b (the slope of the linear dependence of Y16 acidity on phenol pKa), and 9.6 for the apparent pKa of Y57. (B) Schematic depiction of the ionization states present within the active site hydrogen bond network whose fractional populations shift as a function of increasing phenol pKa.
Fig. 5.
Fig. 5.
Structural comparison of KSI-CN variants bound to equilenin. Superposition of the 1.7-Å resolution D40N/M116C-CN–equilenin (carbon atoms are colored green; PDB ID code 3OWS), the 1.7-Å resolution D40N/F86C-CN–equilenin (carbon atoms are colored cyan; PDB ID code 3OWU), and the 2.3-Å resolution D40N/M105C-CN–equilenin (carbon atoms are colored magenta; PDB ID code 3OWY) X-ray crystal structures. Oxygen, nitrogen, and sulfur atoms are colored red, blue, and gold, respectively. Each KSI-CN variant contained a single nitrile group.
Fig. 6.
Fig. 6.
Nitrile IR stretching frequency for KSI-CN variants as a function of phenol pKa. (A) IR spectra in nitrile stretch region of D40N mutants of M105C-CN (red), M116C-CN (green), and F86C-CN (blue) with bound 3-F-4-NO2-phenol (pKa = 6.1). (B) IR peak frequencies for the nitrile stretch of F86C-CN, M116C-CN, and M105C-CN bound to phenols of differing pKa (data are from Table S2). Trend lines are empirical fits to guide the eye. Note that for clarity, the y-axis scale has been expanded for M105C-CN.
Fig. 7.
Fig. 7.
Analysis of spectral width and asymmetry of the nitrile IR absorption spectra of D40N/M116C-CN bound to phenols of differing pKa. (A) Room temperature IR absorption spectra in the nitrile stretching region of D40N/M116C-CN bound to 4-NO2-phenol (blue), 3-Cl-phenol (red), 4-F-3-Me-phenol (green), and 4-MeO-phenol (black). (B) First derivative of the absorption spectrum calculated from the data in A, highlighting the appearance of a shoulder (inflections, which indicate a shoulder, are marked with arrows) and increasing peak width and asymmetry (i.e., increasing ratio of peak height to trough depth) for higher pKa phenols. (C) Superposition of the nitrile stretch peak observed for 4-F-3-Me-phenol (pKa = 9.8) bound to D40N/M116C-CN at 298 K in buffer (green) or at 80 K in 50% glycerol/buffer (black). (D) Nitrile stretch peak observed for D40N/M116C-CN with bound 2,6-d2-4-F-phenol (pKa = 10.0) at 80 K in 50% glycerol/buffer. A single C-F stretch peak corresponding to the neutral phenol was also observed for this complex at 80 K (Fig. S7B), consistent with our assignment in Fig. 4A that a bound phenol with a pKa of ∼10 is predominantly neutral and supporting assignment of the two peaks in C and D to the KSI tautomers with ionized Y16 or Y57.
Fig. 8.
Fig. 8.
Comparison of computational and experimental results for KSI-CN variants. (A) Experimental spectrum of D40N/M116C-CN bound to 4-MeO-phenol (solid black line) modeled with a three-spectra basis set (dashed black line) composed of calculated spectra for negative charge on the hydroxylic oxygen of 4-MeO-phenolate (orange), Y16 (red), or Y57 (violet) and weighted by the fractional populations of these species at a pKa of 10.2 as shown in Fig. 4. (B) Superposition of experimental (black) and calculated (colored) nitrile IR peak shifts for phenols of increasing pKa bound to F86C-CN (cyan), M116C-CN (green), and M105C-CN (red). Computed IR peak shifts were modeled as described in the main text and SI Materials and Methods. Trend lines are empirical fits to guide the eye. Note that the y-axis scale has been expanded for M105C-CN. (C) Plot of the dihedral angle autocorrelation for each probe as a function of time during molecular dynamics simulations of nitrile mobility in the KSI-CN variants. Eq, equilenin.
Fig. 9.
Fig. 9.
Schematic model for preferential ionization of Y57 vs. Y16 with increasing phenol pKa. Increasing the solution pKa of the bound phenol going from A to B weakens its hydrogen bond to Y16, which destabilizes Y16 ionization and shifts the proton transfer equilibrium toward ionization of Y57, where charge is stabilized by hydrogen bonds from Y16 and Y32. For clarity, the transferred proton is shown in green and the D103–phenol hydrogen bond has been omitted.

References

    1. Fersht AR. Structure and Mechanism in Protein Science. New York: Freeman; 1999.
    1. Ladd MFC, Palmer RA. Structure Determination by X-Ray Crystallography. New York: Kluwer Academic/Plenum; 2003.
    1. Fitch CA, et al. Experimental pK(a) values of buried residues: Analysis with continuum methods and role of water penetration. Biophys J. 2002;82(6):3289–3304. - PMC - PubMed
    1. Antosiewicz J, McCammon JA, Gilson MK. The determinants of pKas in proteins. Biochemistry. 1996;35(24):7819–7833. - PubMed
    1. Karp DA, et al. High apparent dielectric constant inside a protein reflects structural reorganization coupled to the ionization of an internal Asp. Biophys J. 2007;92(6):2041–2053. - PMC - PubMed

Publication types

LinkOut - more resources