

Correlations in ion channel expression emerge from homeostatic tuning rules
- PMID: 23798391
- PMCID: PMC3710808
- DOI: 10.1073/pnas.1309966110
Correlations in ion channel expression emerge from homeostatic tuning rules
Abstract
Experimental observations reveal that the expression levels of different ion channels vary across neurons of a defined type, even when these neurons exhibit stereotyped electrical properties. However, there are robust correlations between different ion channel expression levels, although the mechanisms that determine these correlations are unknown. Using generic model neurons, we show that correlated conductance expression can emerge from simple homeostatic control mechanisms that couple expression rates of individual conductances to cellular readouts of activity. The correlations depend on the relative rates of expression of different conductances. Thus, variability is consistent with homeostatic regulation and the structure of this variability reveals quantitative relations between regulation dynamics of different conductances. Furthermore, we show that homeostatic regulation is remarkably insensitive to the details that couple the regulation of a given conductance to overall neuronal activity because of degeneracy in the function of multiple conductances and can be robust to "antihomeostatic" regulation of a subset of conductances expressed in a cell.
Keywords: computational models; control theory; neuronal excitability; robustness.
Conflict of interest statement
The authors declare no conflict of interest.
Figures
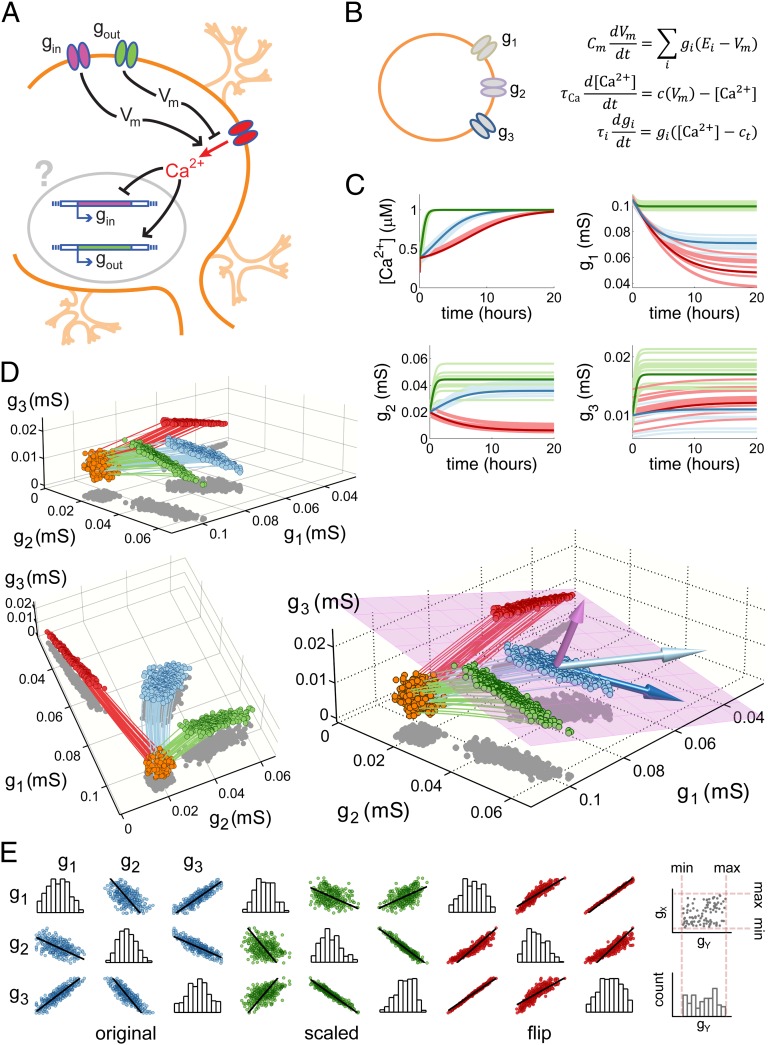
 (Methods) and each conductance is regulated with a specific regulation time constant,
  , according to the difference between [Ca2+] and a target value,
  . (C) Behavior of three versions of the model with different sets of regulation rates. The traces show the evolution of the three conductances and internal [Ca2+] in 30 simulations of each version of the model. Blue traces, original rates (
 ); green traces, scaled rates (
 ); red traces, g2 rate flipped
  . (D) Steady-state conductance distributions. 3D plots showing all three conductances for 300 runs using each of the three sets of regulation rates (orange points, random initial values; blue, original rates; green, scaled rates; red, rate flipped). Each 3D plot is a different view of the same data and the colored curves are the sample trajectories plotted in C. The large plot to the right shows the calculated solution space of conductance values that give target [Ca2+] (pink plane). The arrows represent the surface normal of the solution plane (pink), the velocity vector for the trajectory of the mean model trace with the original rate set (light blue), and the vector obtained by projecting this velocity vector onto the solution plane (dark blue). (E) Scatterplot matrices showing pairwise scatterplots (off-diagonals) between the three maximal conductances in each version of the model. Histograms (diagonals) show the distribution of each maximal conductance by itself. Black lines in each scatterplot are the correlations predicted by resolving the model trajectory onto the solution set (Methods) as illustrated in the right plot of D. The schematic to the right of the plots show how the axes in the plots are organized.
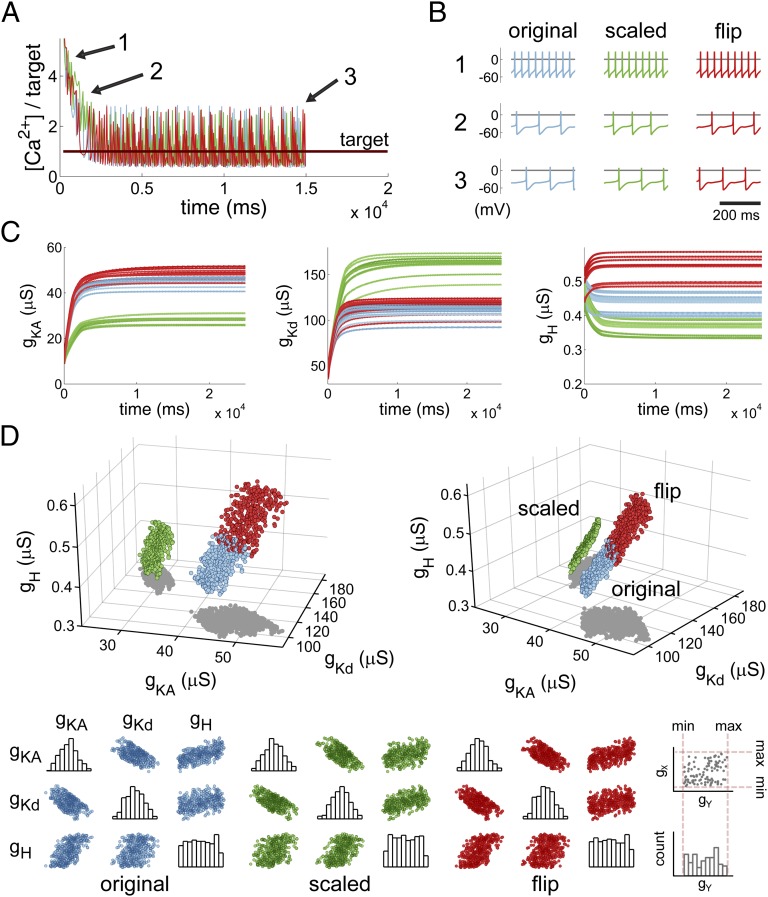
 , blue plots; Methods), scaled (
 ; green), and the regulation rate for gH flipped (
 ; red). (A) Example traces of [Ca2+] in each of the three versions of the model (traces truncated at 1,500 ms). (B) Example membrane potential traces at different time points (1, 2, and 3) for each version of the model. (C) Example traces showing the evolution of the three regulated conductances in 30 simulations of each version of the model. (D) (Upper) 3D scatterplot showing the steady-state conductance distributions for 300 model simulations with each set of rates. The two plots show two rotated views of the same data. (Lower) Correlation plots of steady-state conductances for each version of the model.
References
-
- Bean BP. The action potential in mammalian central neurons. Nat Rev Neurosci. 2007;8(6):451–465. - PubMed
-
- Coetzee WA, et al. Molecular diversity of K+ channels. Ann N Y Acad Sci. 1999;868:233–285. - PubMed
-
- Hille B. Ion Channels of Excitable Membranes. Sunderland, MA: Sinauer; 2001.
-
- Marder E, Goaillard JM. Variability, compensation and homeostasis in neuron and network function. Nat Rev Neurosci. 2006;7(7):563–574. - PubMed
Publication types
MeSH terms
Substances
Grants and funding
LinkOut - more resources
Full Text Sources
Other Literature Sources
Molecular Biology Databases
