. 2013 Jul 9;110(28):11349-54.
doi: 10.1073/pnas.1300801110. Epub 2013 Jun 24.

Cell geometric constraints induce modular gene-expression patterns via redistribution of HDAC3 regulated by actomyosin contractility

Affiliations

Cell geometric constraints induce modular gene-expression patterns via redistribution of HDAC3 regulated by actomyosin contractility

Nikhil Jain et al. Proc Natl Acad Sci U S A. .

Abstract

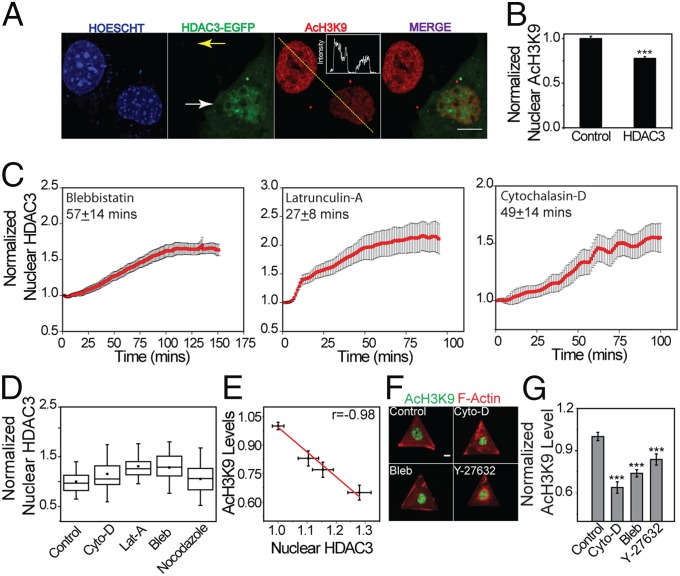
Physical forces in the form of substrate rigidity or geometrical constraints have been shown to alter gene expression profile and differentiation programs. However, the underlying mechanism of gene regulation by these mechanical cues is largely unknown. In this work, we use micropatterned substrates to alter cellular geometry (shape, aspect ratio, and size) and study the nuclear mechanotransduction to regulate gene expression. Genome-wide transcriptome analysis revealed cell geometry-dependent alterations in actin-related gene expression. Increase in cell size reinforced expression of matrix-related genes, whereas reduced cell-substrate contact resulted in up-regulation of genes involved in cellular homeostasis. We also show that large-scale changes in gene-expression profile mapped onto differential modulation of nuclear morphology, actomyosin contractility and histone acetylation. Interestingly, cytoplasmic-to-nuclear redistribution of histone deacetylase 3 modulated histone acetylation in an actomyosin-dependent manner. In addition, we show that geometric constraints altered the nuclear fraction of myocardin-related transcription factor. These fractions exhibited hindered diffusion time scale within the nucleus, correlated with enhanced serum-response element promoter activity. Furthermore, nuclear accumulation of myocardin-related transcription factor also modulated NF-κB activity. Taken together, our work provides modularity in switching gene-expression patterns by cell geometric constraints via actomyosin contractility.

Keywords: MRTF-A signaling; cell matrix interaction; chromatin remodelling; substrate geometry; transcription control.


Conflict of interest statement

The authors declare no conflict of interest.

Figures

Fig. 1.
Fig. 1.
Cell geometry imposes modular changes in gene expression. (A) NIH 3T3 fibroblast cells cultured on fibronectin coated patterns of different sizes, shapes, or AR. (AR is defined as cell adhering to micropatterns of similar area but different ratio of short axis to long axis.) (B) Two-dimensional matrix showing total number of differentially regulated genes among cells of different geometries. (C) GO analysis of 290 differentially regulated genes in small circle compared with larger cells of AR 1:5. The pie chart includes significantly (P < 0.05) represented gene clusters (25 up-regulated and 20 down-regulated genes). (D) GO analysis of 200 differentially regulated genes in small triangle compared with large triangle. The pie-chart includes significantly (P < 0.05) represented gene clusters (42 up-regulated and 34 down-regulated genes).
Fig. 2.
Fig. 2.
Geometric regulation of actin-related genes and TFs. (AC) Color maps showing differentially regulated genes between cells of different geometries: size (A), AR (B), and shape (C). (D) Actin-related genes differentially expressed between cells cultured on smaller and larger triangular patterns. (E) TF showing significant binding sites in differentially regulated genes between circular and triangular cells of equal area (1,800 μm2).
Fig. 3.
Fig. 3.
Correlation between cell and nuclear size with global histone acetylation. (AC) Normalized immunofluorescence intensity of AcH3K9 and nuclear volume as a function of shape (A), AR (B), or size (C) of cell. (D) Representative images of control cells and TSA- or Cyto-D–treated cells stained with phalloidin (red) and AcH3K9 (green) antibody. (E) Bar graph shows changes in nuclear volume and histone acetylation upon treatment with TSA or Cyto-D. (F) Log vs. log plot showing correlation between nuclear volume and histone acetylation levels. Data is given as mean ± SE with 50 < n < 275. (Scale bar: 10 μm.) *P < 0.05; **P < 0.01; ***P < 0.001.
Fig. 4.
Fig. 4.
Actomyosin contractility governs histone acetylation by regulating spatial redistribution of HDAC3. (A) HDAC3-EGFP–transfected (white arrow) and nontransfected (yellow arrow) cell stained with Hoechst (blue) and AcH3K9 (red). Line plot shows the intensity profile across two nuclei. (B) Bar graph shows the differences in the levels of AcH3K9 between control and HDAC3 overexpressed cells. (C) HDAC3-EGFP nuclear translocation dynamics upon treatment with different inhibitors for actomyosin contractility. Translocation follows sigmoidal kinetic with different time constants dependent on inhibitor use. (D) Quantification of endogenous nuclear HDAC3 levels by perturbation of actomyosin contractility by different inhibitors. (E) Correlation plot between histone acetylation levels and nuclear HDAC3. (F) Representative images of cells treated with Cyto-D, Blebbistatin (Bleb), and Y-27632. (G) Modulation of AcH3K9 levels by perturbation of actomyosin activity by different inhibitors. Data is given as mean ± SE with 50 < n < 100. (Scale bar: 10 μm.) *P < 0.05; **P < 0.01; ***P < 0.001.
Fig. 5.
Fig. 5.
Modulation of actomyosin contractility and HDAC3 levels by cell geometry. (A) Representative images of actin stress fibers (red) and phosphorylated myosin light chain (p-MLC, green) in cells of same shape but different spreading area. (B) F-actin and p-MLC levels as a function of cell spreading area. (C) Box plot of F-actin and p-MLC levels in cells of different shapes but equal area (1,800 μm2). The box represents 25th and 75th percentiles, median is denoted by middle horizontal line, mean is indicated by small open squares, and whiskers indicate SD. (D) Bar graph shows the differences in the levels of F-actin and p-MLC in cells of different AR but of equal area (1,800 μm2). (E) Color-coded images of HDAC3 in cells of different sizes. (F) Quantification of nuclear HDAC3 levels between cells of different sizes. (G) Distribution of correlation time of MRTF-A in the nucleus for smaller (n = 426) and bigger (n = 410) triangular cells. (G, Inset) Typical autocorrelation curves for the two geometries. Bar graph shows the difference in the average correlation time scale between cells of different area. Data is given as mean ± SE with 50 < n < 500. (Scale bar: 10 μm.) *P < 0.05; **P < 0.01; ***P < 0.001.
Fig. 6.
Fig. 6.
Reporter assays reveal geometry-dependent transcriptional activity. (A) Representative images of cells on circular and triangular cells expressing SRE-EGFP reporter plasmid. (B) Bar graph shows comparison of normalized mean EGFP intensity in cells transfected with SRE-EGFP reporter plasmid. (C) Box plot of total actin levels in cells of different shapes but equal area (1,800 μm2). Inset shows the fold change observed in RNA levels by RT-PCR. (D) Representative images of cells stained with phalloidin (red) and MRTF-A (green). (E) Graph represents variation of total actin as a function of nuclear MRTF-A for triangular cells. Inset shows the significant difference in the normalized slope of triangular and circular cells. (F) Representative images of cells on circular or triangular pattern of equal area (1,800 μm2) stained with p65 (green) and Hoechst (blue). (G) Comparison of nuclear-to-cytoplasmic levels of p65 between circular and triangular cells. (H) Representative images of control cells, Lat-A–treated cells, and Blebbistatin-treated cells transfected either with CMV-EGFP, SRE-EGFP, or NF-κB–EGFP. (I) Alteration in corresponding reporter activity before and after treatment with Lat-A. (J) Alteration in corresponding reporter activity before and after treatment with Blebbistatin. Data is given as mean ± SE with 50 < n < 500. (Scale bar: 10 μm.) *P < 0.05; **P < 0.01; ***P < 0.001.
Fig. 7.
Fig. 7.
Schematic for cell geometry-regulated gene expression.

Similar articles

Cited by

References

    1. Jean RP, Gray DS, Spector AA, Chen CS. Characterization of the nuclear deformation caused by changes in endothelial cell shape. J Biomech Eng. 2004;126(5):552–558. - PubMed
    1. Versaevel M, Grevesse T, Gabriele S. Spatial coordination between cell and nuclear shape within micropatterned endothelial cells. Nat Commun. 2012;3:671. - PubMed
    1. Théry M, Pépin A, Dressaire E, Chen Y, Bornens M. Cell distribution of stress fibres in response to the geometry of the adhesive environment. Cell Motil Cytoskeleton. 2006;63(6):341–355. - PubMed
    1. Le Beyec J, et al. Cell shape regulates global histone acetylation in human mammary epithelial cells. Exp Cell Res. 2007;313(14):3066–3075. - PMC - PubMed
    1. Vergani L, Grattarola M, Nicolini C. Modifications of chromatin structure and gene expression following induced alterations of cellular shape. Int J Biochem Cell Biol. 2004;36(8):1447–1461. - PubMed

Publication types

LinkOut - more resources