

Trade-off between curvature tuning and position invariance in visual area V4
- PMID: 23798444
- PMCID: PMC3710868
- DOI: 10.1073/pnas.1217479110
Trade-off between curvature tuning and position invariance in visual area V4
Abstract
Humans can rapidly recognize a multitude of objects despite differences in their appearance. The neural mechanisms that endow high-level sensory neurons with both selectivity to complex stimulus features and "tolerance" or invariance to identity-preserving transformations, such as spatial translation, remain poorly understood. Previous studies have demonstrated that both tolerance and selectivity to conjunctions of features are increased at successive stages of the ventral visual stream that mediates visual recognition. Within a given area, such as visual area V4 or the inferotemporal cortex, tolerance has been found to be inversely related to the sparseness of neural responses, which in turn was positively correlated with conjunction selectivity. However, the direct relationship between tolerance and conjunction selectivity has been difficult to establish, with different studies reporting either an inverse or no significant relationship. To resolve this, we measured V4 responses to natural scenes, and using recently developed statistical techniques, we estimated both the relevant stimulus features and the range of translation invariance for each neuron. Focusing the analysis on tuning to curvature, a tractable example of conjunction selectivity, we found that neurons that were tuned to more curved contours had smaller ranges of position invariance and produced sparser responses to natural stimuli. These trade-offs provide empirical support for recent theories of how the visual system estimates 3D shapes from shading and texture flows, as well as the tiling hypothesis of the visual space for different curvature values.
Keywords: Gabor model; feature selectivity; natural stimuli; object recognition; vision.
Conflict of interest statement
The authors declare no conflict of interest.
Figures
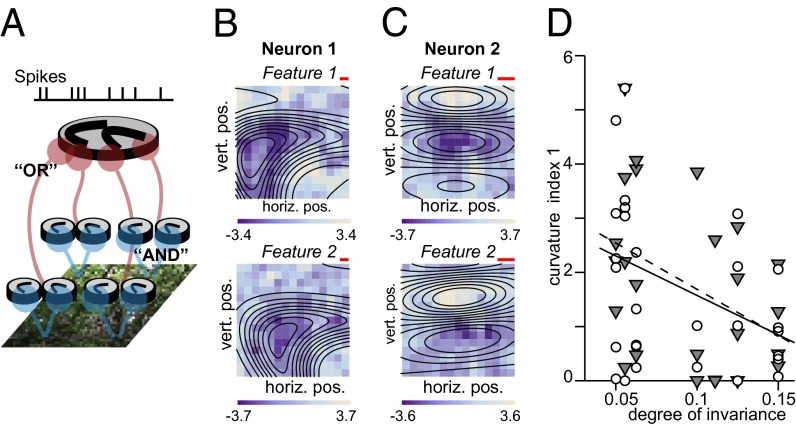
 from the fitted curved Gabor models normalized such that the stimulus frame size has a unit length of 1. We find that this curvature index decreases with the range of position invariance for both the first MIID (gray triangles) and the second MIID (open circles). The solid line shows the least-square fit for all points (P = 0.005 linear correlation); the dashed line is the fit just through points for the first MIID (P = 0.042, linear correlation).
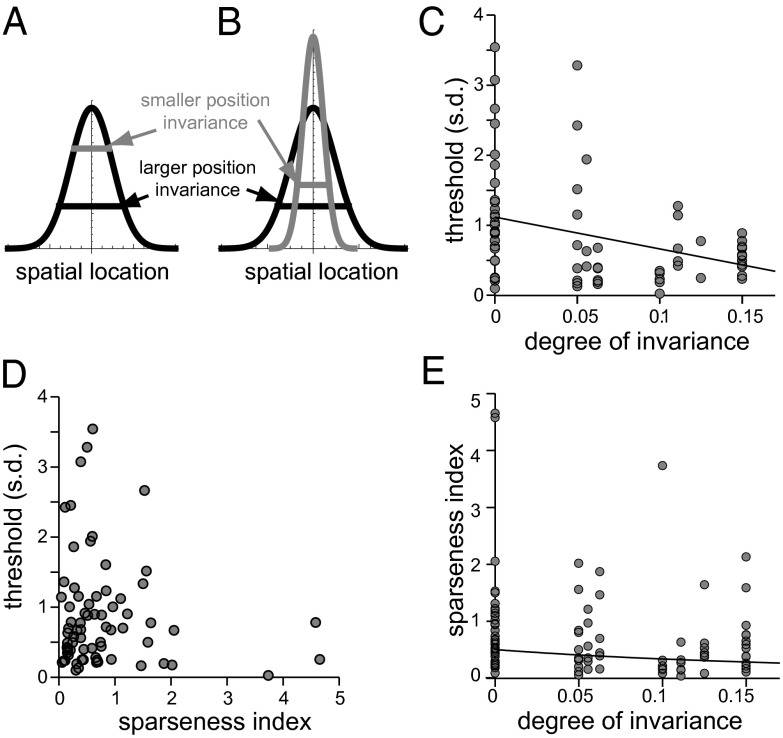
 with invariance range x was better described by an inverse quadratic function (solid line shows the best fit) rather than a linear function; P = 0.03, correlation between invariance range and
References
-
- Serre T, Wolf L, Bileschi S, Riesenhuber M, Poggio T. Robust object recognition with cortex-like mechanisms. IEEE Trans Pattern Anal Mach Intell. 2007;29(3):411–426. - PubMed
Publication types
MeSH terms
Grants and funding
LinkOut - more resources
Full Text Sources
Other Literature Sources
