. 2013 Aug 9;288(32):23331-47.
doi: 10.1074/jbc.M113.463984. Epub 2013 Jun 24.

An unbiased approach to identifying tau kinases that phosphorylate tau at sites associated with Alzheimer disease

Affiliations

An unbiased approach to identifying tau kinases that phosphorylate tau at sites associated with Alzheimer disease

Annalisa Cavallini et al. J Biol Chem. .

Abstract

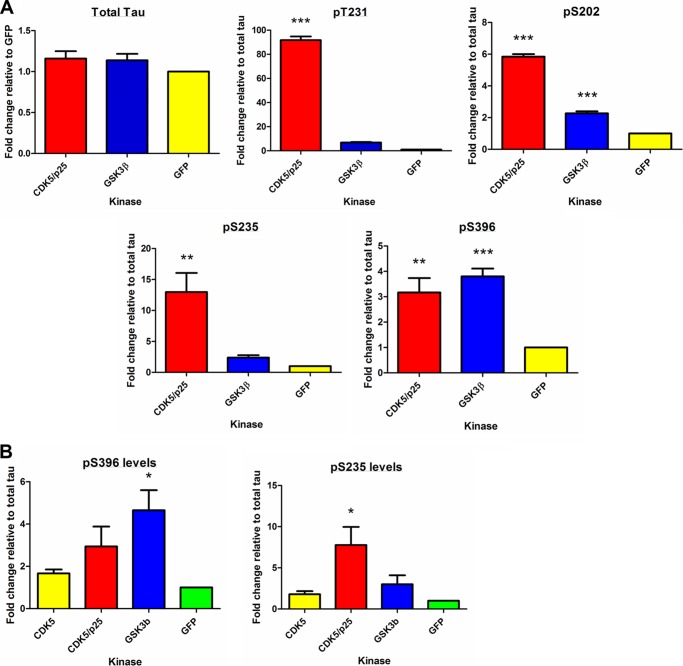
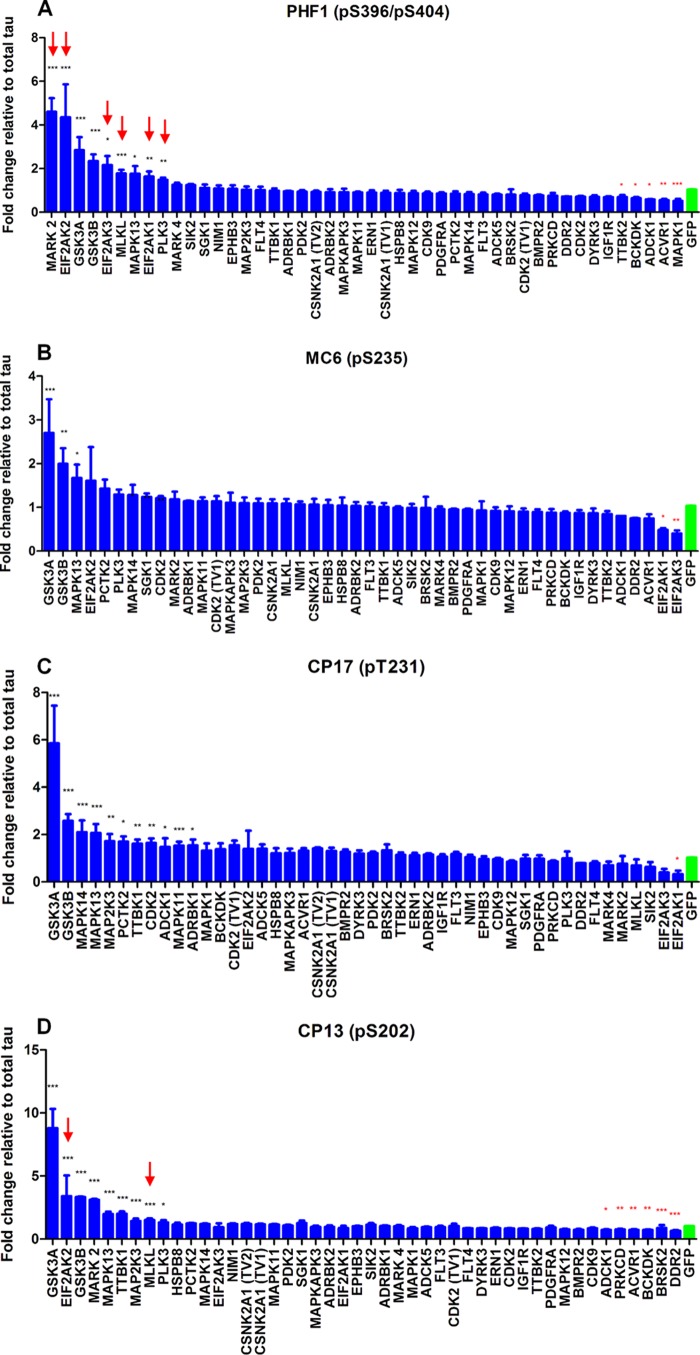
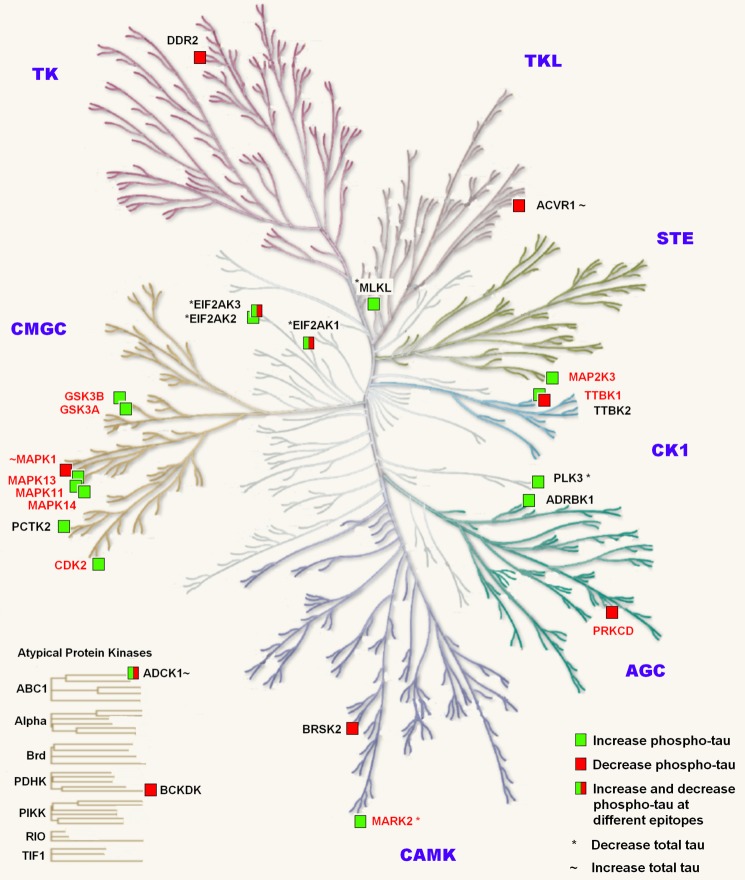
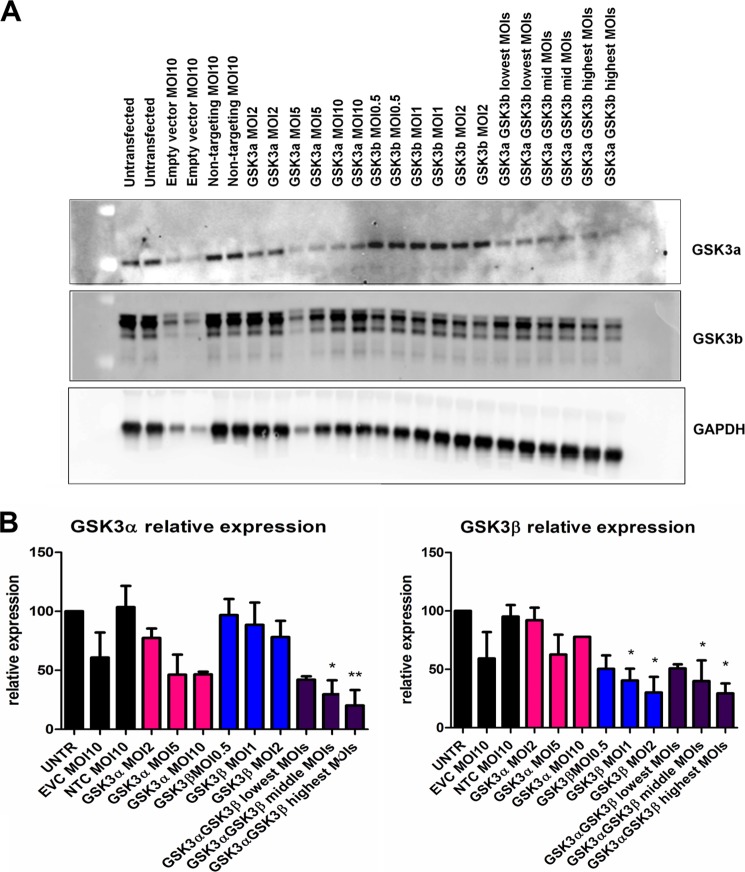
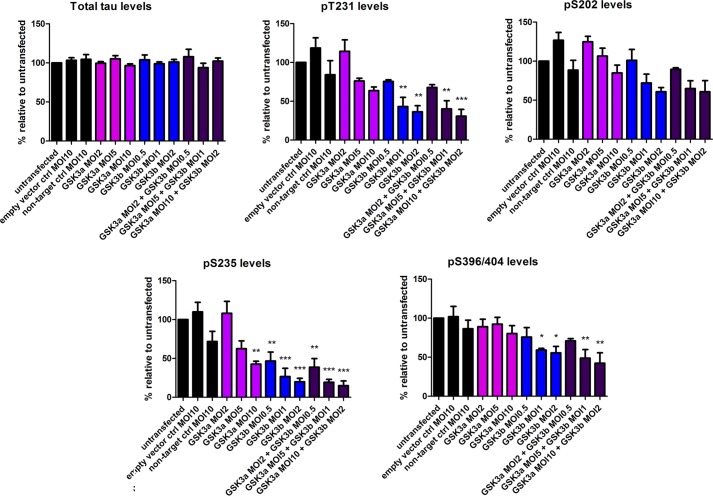
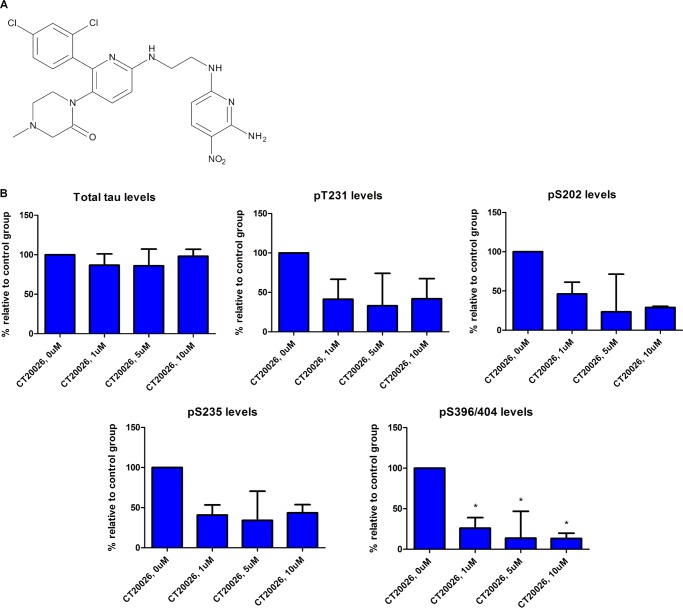
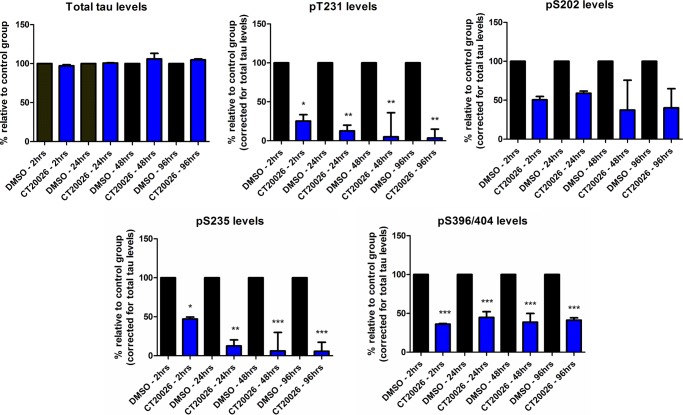
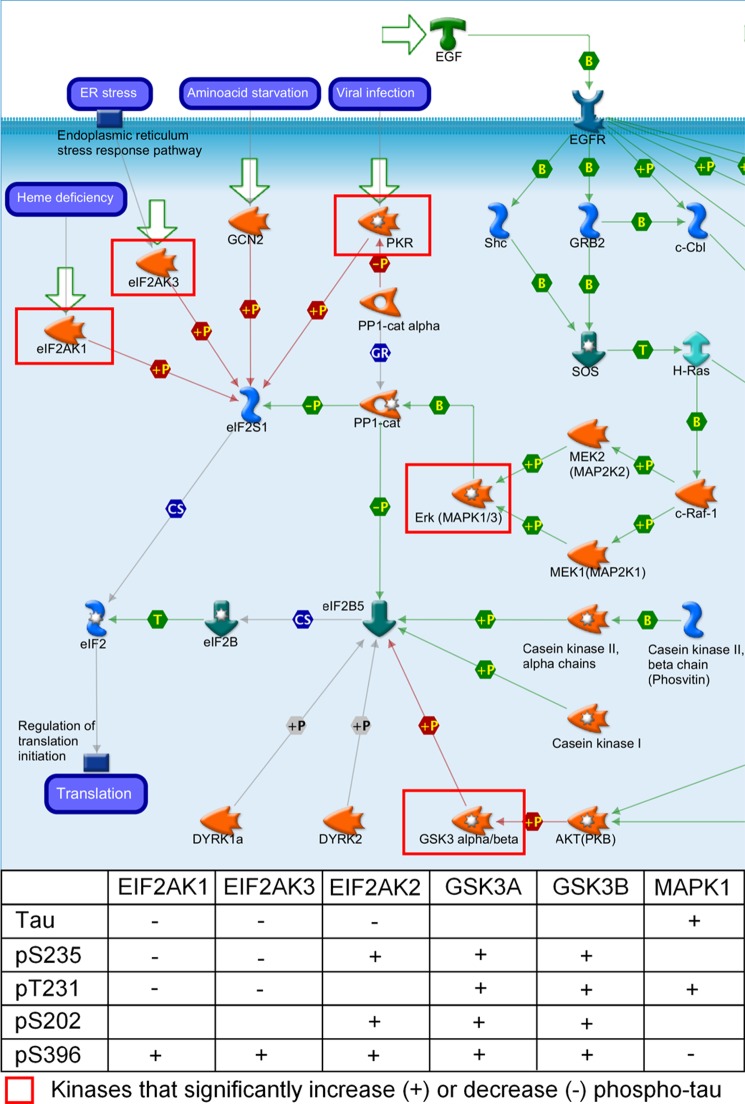
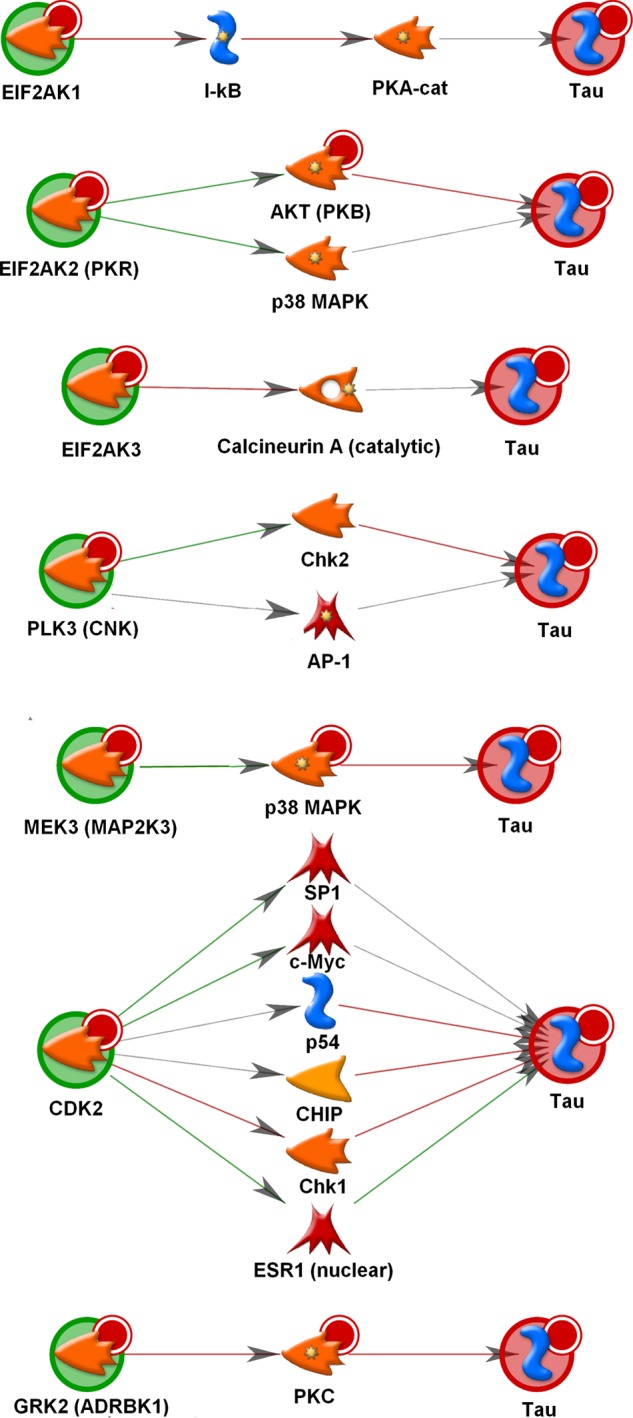
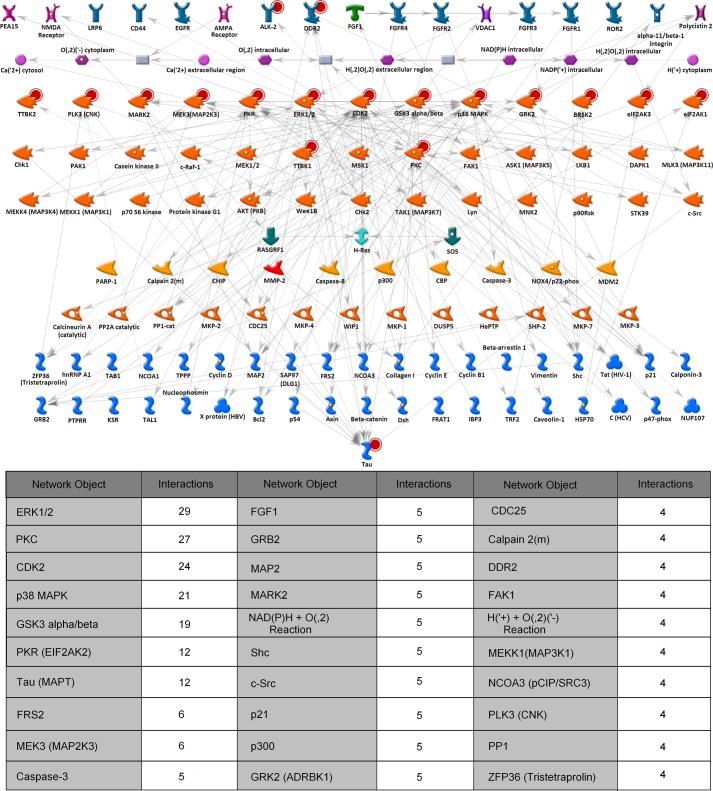
Neurofibrillary tangles, one of the hallmarks of Alzheimer disease (AD), are composed of paired helical filaments of abnormally hyperphosphorylated tau. The accumulation of these proteinaceous aggregates in AD correlates with synaptic loss and severity of dementia. Identifying the kinases involved in the pathological phosphorylation of tau may identify novel targets for AD. We used an unbiased approach to study the effect of 352 human kinases on their ability to phosphorylate tau at epitopes associated with AD. The kinases were overexpressed together with the longest form of human tau in human neuroblastoma cells. Levels of total and phosphorylated tau (epitopes Ser(P)-202, Thr(P)-231, Ser(P)-235, and Ser(P)-396/404) were measured in cell lysates using AlphaScreen assays. GSK3α, GSK3β, and MAPK13 were found to be the most active tau kinases, phosphorylating tau at all four epitopes. We further dissected the effects of GSK3α and GSK3β using pharmacological and genetic tools in hTau primary cortical neurons. Pathway analysis of the kinases identified in the screen suggested mechanisms for regulation of total tau levels and tau phosphorylation; for example, kinases that affect total tau levels do so by inhibition or activation of translation. A network fishing approach with the kinase hits identified other key molecules putatively involved in tau phosphorylation pathways, including the G-protein signaling through the Ras family of GTPases (MAPK family) pathway. The findings identify novel tau kinases and novel pathways that may be relevant for AD and other tauopathies.

Keywords: Alzheimer Disease; Bioinformatics; Enzymes; Glycogen Synthase Kinase 3; Kinase; Phosphorylation; Tau.


Figures

FIGURE 1.
FIGURE 1.
Effect of known tau kinases on tau phosphorylation. A, the effect of CDK5/p25, GSK3β, and GFP on the phosphorylation of Ser(P)-202, Ser(P)-235, Ser(P)-396, and Thr(P)-231 and total tau levels was measured using phosphoepitope-specific AlphaScreen assays. B, the effect of CDK5, CDK5/p25, GSK3β, and GFP on the phosphorylation of Ser(P)-235 and Ser(P)-396 is shown. The phospho-tau levels were normalized to total tau levels. Data shown are the average of three or four separate experiments (n = 3 per experiment). Statistical analysis was performed using a one-way ANOVA test with Dunnett's multiple comparison test on log -fold change values (*, **, and ***, p < 0.05, 0.01, and 0.001 versus GFP). Error bars represent S.E.
FIGURE 2.
FIGURE 2.
Summary of screening data at each epitope: Ser(P)-396 (A), Ser(P)-235 (B), Thr(P)-231 (C), and Ser(P)-202 (D). 41 kinases from the first round (shown in Table 1) together with NIM1, SIK2, MAPK11, TTBK1, and TTBK2 were rescreened. The effect of these kinases and GFP on the phosphorylation levels of Ser(P)-202, Ser(P)-235, Ser(P)-396, and Thr(P)-231 was measured using phosphoepitope-specific AlphaScreen assays. The phospho-tau levels were normalized to total tau levels. The average of three separate transfections is shown. Statistical analysis was performed using a one-way ANOVA test with Dunnett's multiple comparison test on log -fold change values (*, **, and ***, p < 0.05, 0.01, and 0.001 versus GFP). Error bars represent S.E. Red arrows represent kinases that significantly reduced total tau levels.
FIGURE 3.
FIGURE 3.
Hit kinases separated into kinase families. The diagram shows an adaptation of the phylogenetic tree where each branch represents a kinase in the human kinome as described in Manning et al. (Ref. ; the illustration is reproduced courtesy of Cell Signaling Technology, Inc.). The labeled kinases are those that were associated with changes in phosphorylated tau or total tau in the kinome screen. Red text, known tau kinases; black text, novel tau kinases. *, kinases that decrease total tau levels; ∼, kinases that increase total tau levels. TK, tyrosine kinase group; TKL, tyrosine kinase-like; AGC, protein kinase A, G, and C family; CAMK, calcium- and calmodulin-regulated kinases; CK1, casein kinase 1 group; STE, constitutes three main families that sequentially activate the MAPK family; CMGC, named after the initials of some of the members of this family.
FIGURE 4.
FIGURE 4.
GSK3α and -β expression levels in hTau primary cortical neurons following knockdown with shRNA. Representative Western blots (A) show levels of GSK3α and -β in duplicates following knockdown of GSK3α and/or -β with shRNA lentivirus at various m.o.i. values. Quantitative analysis of GSK3α and -β levels (B) of three independent knockdown experiments at the indicated m.o.i. values (n = 3 per experiment) is shown. EVC, empty vector control; NTC, non-targeting shRNA control; UNTR, uninfected cells. Statistical analysis was performed using a one-way ANOVA test with Dunnett's multiple comparison test on relative expression (* and **, p < 0.05 and 0.01). Error bars represent S.E.
FIGURE 5.
FIGURE 5.
Effect of GSK3α and/or -β knockdown on total and phosphorylated tau levels in hTau primary cortical neurons. AlphaScreen assays were performed to quantitate the levels of total and phosphorylated tau (Thr(P)-231, Ser(P)-202, Ser(P)-235, and Ser(P)-396/404) in hTau primary cortical neurons following knockdown of GSK3α and/or -β with shRNA lentivirus at various m.o.i. values. The average of two separate experiments is shown (n = 3 per experiment). Reduction of GSK3α and/or -β levels had the greatest effect on Thr(P)-231 and Ser(P)-235 levels. Statistical analysis was performed using a one-way ANOVA test with Dunnett's multiple comparison test on phosphorylation levels (*, **, and ***, p < 0.05, 0.01, and 0.001). Error bars represent S.E. ctrl, control.
FIGURE 6.
FIGURE 6.
Effect of selective GSK3 inhibitor on tau phosphorylation levels in hTau primary cortical neurons. A, structure of the selective GSK3 inhibitor CT20026 (Chiron). B, acute inhibition of GSK3 activity (2 h) in hTau primary cortical neurons resulted in dose-dependent decreases in the following rank order: Ser(P)-396 > Ser(P)-202 > Thr(P)-231 = Ser(P)-235 (representative data shown are from two separate experiments; n = 3 per experiment). Statistical analysis was performed using a one-way ANOVA test with Dunnett's multiple comparison test on phosphorylation levels (*, p < 0.05). Error bars represent S.E.
FIGURE 7.
FIGURE 7.
Comparison of short and long term inhibition of GSK3 activity on tau phosphorylation levels. hTau primary cortical neurons were treated with 1 μm CT20026 for the indicated times. Total and phosphorylated tau levels were analyzed by AlphaScreen assays. Long term inhibition of GSK3 activity enhanced inhibition of Thr(P)-231 and Ser(P)-235 to greater than 90%, whereas Ser(P)-396/404 and Ser(P)-202 inhibition remained constant at ∼50–60% (representative data shown are from two separate experiments; n = 3 per experiment). Statistical analysis was performed using a one-way ANOVA test with Dunnett's multiple comparison test on phosphorylation levels (*, **, and ***, p < 0.05, 0.01, and 0.001). Error bars represent S.E.
FIGURE 8.
FIGURE 8.
GeneGo pathway map translation regulation of eIF2 activity. Part of the GeneGo pathway map for translation regulation of eIF2 activity is represented in the diagram. Molecules are represented by node icons. Different shaped node icons represent different families of proteins. Edges between nodes represent an inhibitory interaction (red), an activating interaction (green), or an unknown interaction (gray). The flow of the pathway is represented by the directionality of the arrows. The shapes in the center of the arrows describe the nature of the interaction (e.g. phosphorylation, binding, etc.). This pathway was significantly enriched for the kinases identified to significantly decrease (−) total tau (p value = 1.494e−6). The table below the pathway diagram describes whether total or phospho-tau are increased (+) or decreased (−) in the kinome screen. eIF2AK1, eIF2AK3, and eIF2AK2 (PKR) are all involved in phosphorylation of and inhibition of eIF2S1. MAPK1 as part of the ERK complex is involved in regulating the dephosphorylation of eIF2S1 via protein phosphatase 1 (PP1). GSK3α and -β are involved in phosphorylation of and inhibition of eIF2B5. EGFR, EGF receptor. SOS, son of sevenless guanine nucleotide exchange factor; CS, complex subunit; GR, group relation; B, binding; T, transformation.
FIGURE 9.
FIGURE 9.
Evidence for indirect influence of kinases on tau phosphorylation. The diagrams shown represent known interactions, direct and indirect, between kinases (green circles) and tau (red circles). Molecules are represented by node icons. Different shaped node icons represent different families of proteins. Edges between nodes represent an inhibitory interaction (red), an activating interaction (green), or an unknown interaction (gray). The kinases shown (green circles) were identified as having a putative indirect effect on tau (red circles) phosphorylation by activation or inhibition of an intermediary protein. Interactions were identified using the GeneGo MetaCore pathway analysis software Shortest Paths algorithm. cat, catalytic. PKA-cat, protein kinase catalytic subunit; CNK, connector enhancer of KSR, a multidomain protein required for RAS signaling.
FIGURE 10.
FIGURE 10.
Network fishing for molecules involved in tau phosphorylation pathways. The network shown was generated using the GeneGo MetaCore pathway analysis software to trace the putative pathways from and through the kinases identified in the kinase screen and to the tau protein. Red circles behind the icons show nodes used as input to the network building algorithm. For ease of representation, transcription factors were removed from the network, the nodes were organized by protein families, and the edges were grayed out. The table below the network shows some of the hubs in the network and the number of interactions made by each molecule. EGFR, EGF receptor; cat, catalytic; HBV, hepatitis B virus; HCV, hepatitis C virus; CBP, cAMP-response element-binding protein (CREB)-binding protein. CNK, connector enhancer of KSR; KSR, kinase suppressor of RAS; SOS, son of sevenless guanine nucleotide exchange factor; PTPRR, protein-tyrosine phosphatase receptor type R; HePTP, hematopoietic protein-tyrosine phosphatase.

References

    1. Hutton M., Lendon C. L., Rizzu P., Baker M., Froelich S., Houlden H., Pickering-Brown S., Chakraverty S., Isaacs A., Grover A., Hackett J., Adamson J., Lincoln S., Dickson D., Davies P., Petersen R. C., Stevens M., de Graaff E., Wauters E., van Baren J., Hillebrand M., Joosse M., Kwon J. M., Nowotny P., Che L. K., Norton J., Morris J. C., Reed L. A., Trojanowski J., Basun H., Lannfelt L., Neystat M., Fahn S., Dark F., Tannenberg T., Dodd P. R., Hayward N., Kwok J. B., Schofield P. R., Andreadis A., Snowden J., Craufurd D., Neary D., Owen F., Oostra B. A., Hardy J., Goate A., van Swieten J., Mann D., Lynch T., Heutink P. (1998) Association of missense and 5′-splice-site mutations in tau with the inherited dementia FTDP-17. Nature 393, 702–705 - PubMed
    1. Lee V. M., Brunden K. R., Hutton M., Trojanowski J. Q. (2011) Developing therapeutic approaches to tau, selected kinases, and related neuronal protein targets. Cold Spring Harb. Perspect. Med. 1, a006437. - PMC - PubMed
    1. Gómez-Isla T., Hollister R., West H., Mui S., Growdon J. H., Petersen R. C., Parisi J. E., Hyman B. T. (1997) Neuronal loss correlates with but exceeds neurofibrillary tangles in Alzheimer's disease. Ann. Neurol. 41, 17–24 - PubMed
    1. Trinczek B., Biernat J., Baumann K., Mandelkow E. M., Mandelkow E. (1995) Domains of tau protein differential phosphorylation, and dynamic instability of microtubules. Mol. Biol. Cell 6, 1887–1902 - PMC - PubMed
    1. Sergeant N., Bretteville A., Hamdane M., Caillet-Boudin M. L., Grognet P., Bombois S., Blum D., Delacourte A., Pasquier F., Vanmechelen E., Schraen-Maschke S., Buée L. (2008) Biochemistry of Tau in Alzheimer's disease and related neurological disorders. Expert Rev. Proteomics 5, 207–224 - PubMed

MeSH terms