

Review
doi: 10.1083/jcb.201212130.
Imaging cell biology in live animals: ready for prime time
Affiliations
- PMID: 23798727
- PMCID: PMC3691462
- DOI: 10.1083/jcb.201212130
Item in Clipboard
Review
Imaging cell biology in live animals: ready for prime time
J Cell Biol.
.
Abstract
Time-lapse fluorescence microscopy is one of the main tools used to image subcellular structures in living cells. Yet for decades it has been applied primarily to in vitro model systems. Thanks to the most recent advancements in intravital microscopy, this approach has finally been extended to live rodents. This represents a major breakthrough that will provide unprecedented new opportunities to study mammalian cell biology in vivo and has already provided new insight in the fields of neurobiology, immunology, and cancer biology.
Figures
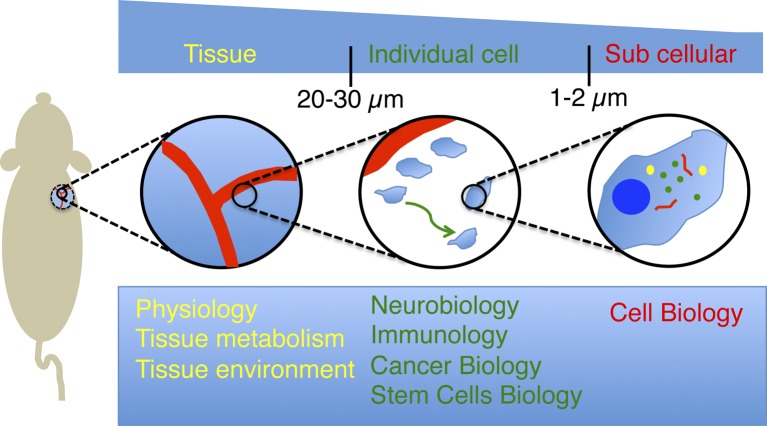
Spatial resolution and current applications of intravital microscopy. IVM provides the opportunity to image several biological processes in live animals at different levels of resolution. Low-magnification objectives (5–10×) enable visualizing tissues and their components under physiological conditions and measuring their response under pathological conditions. Particularly, the dynamics of the vasculature have been one of topic most extensively studied by IVM. Objectives with higher magnification (20–30×) have enabled imaging the behavior of individual cell over long periods of time. This has led to major breakthroughs in fields such as neurobiology, immunology, cancer biology, and stem cell research. Finally, the recent developments of strategies to minimize the motion artifacts caused by the heartbeat and respiration combined with high power lenses (60–100×) have opened the door to image subcellular structures and to study cell biology in live animals.
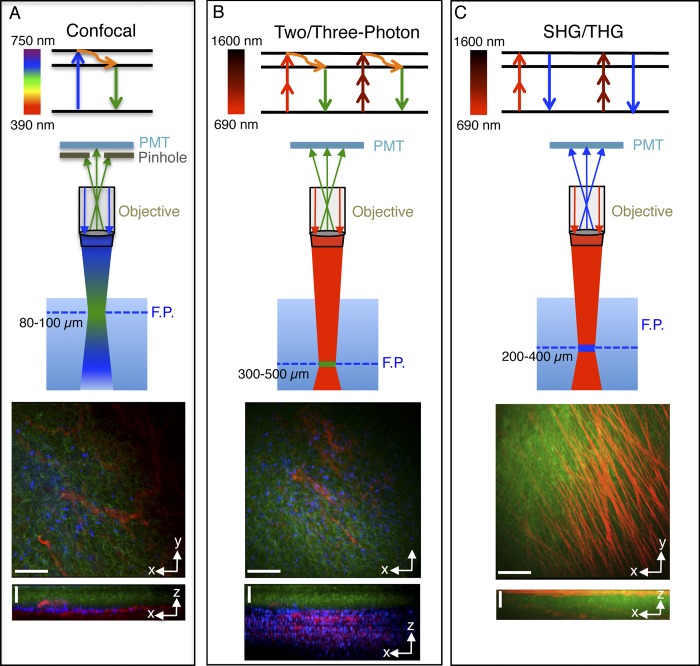
Fluorescent light microscopy imaging techniques used for intravital microscopy. (A) Confocal microscopy. (top) In confocal microscopy, a fluorophore absorbs a single photon with a wavelength in the UV-visible range of the spectrum (blue arrow). After a vibrational relaxation (orange curved arrow), a photon with a wavelength shifted toward the red is emitted (green arrow). (center) In thick tissue, excitation and emission occur in a relative large volume around the focal plane (F.P.). The off-focus emissions are eliminated through a pinhole, and the signal from the focal plane is detected via a photomultiplier (PMT). Confocal microscopy enables imaging at a maximal depth to 80–100 µm. (bottom) Confocal z stack of the tongue of a mouse expressing the membrane marker m-GFP (green) in the K14-positive basal epithelial layer, and the membrane marker mTomato in the endothelium (red). The xy view shows a maximal projection of 40 z slices acquired every 2.5 µm, whereas the xz view shows a lateral view of the stack. In blue are the nuclei labeled by a systemic injection of Hoechst. Excitation wavelengths: 450 nm, 488 nm, and 562 nm. (B) Two- and three-photon microscopy. (top) In this process a fluorophore absorbs almost simultaneously two or three photons that have half (red arrow) or a third (dark red arrow) of the energy required for its excitation with a single photon. Two- or three-photon excitations typically require near-IR or IR light (from 690 to 1,600 nm). (center) Emission and excitation occur only at the focal plane in a restricted volume (1.5 fl), and for this reason a pinhole is not required. Two- and three-photon microscopy enable imaging routinely at a maximal depth of 300–500 µm. (bottom) Two-photon z stack of an area adjacent to that imaged in A. xy view shows a maximal projection of 70 slices acquired every 5 µm. xz view shows a lateral view of the stack. Excitation wavelength: 840 nm. (C) SHG and THG. (top) In SHG and THG, photons interact with the specimen and combine to form new photons that are emitted with twice or three times their initial energy without any energy loss. (center) These processes have similar features to those described for two- and three-photon microscopy and enable imaging at a maximal depth of 200–400 µm. (bottom) z stack of a rat heart excited by two-photon microscopy (740 nm) to reveal the parenchyma (green), and SHG (930 nm) to reveal collagen fibers (red). xy shows a maximal projection of 20 slices acquired every 5 µm. xz view shows a lateral view of the stack. Bars: (xy views) 40 µm; (xz views) 50 µm.
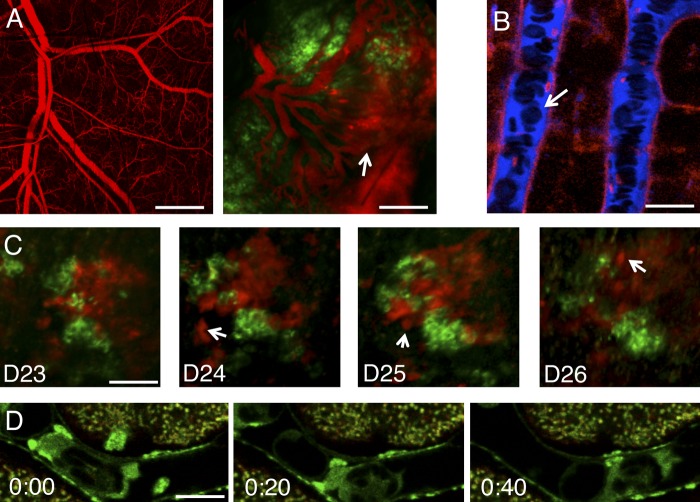
Imaging tissues and individual cells in live animals. (A) The vasculature of an immunocompromised mouse was highlighted by the systemic injection of 2 MD dextran (red) before (left) and after (right) the implant of breast cancer cells in the back (green). Note the change in shape of the blood vessels and their increased permeability (arrow). Images were acquired by two-photon microscopy (excitation wavelength: 930 nm). (B) The microvasculature in the liver of a mouse expressing the membrane marker mTomato (red) was highlighted by the injection of cascade blue dextran (blue) and imaged by confocal microscopy (excitation wavelengths: 405 nm and 561 nm). Note the red blood cells that do not uptake the dye and appear as dark objects in the blood stream (arrow). (C) Metastatic and nonmetastatic human adenocarcinoma cells were injected in the tongue of an immunocompromised mouse and imaged for four consecutive days by using two-photon microscopy (excitation wavelength: 930 nm). The metastatic cells, which express the fluorescent protein mCherry (red), migrate away from the edge of the tumor (arrows), whereas the nonmetastatic cells, which express the fluorescent protein Venus (green), do not. (D) A granulocyte moving inside a blood vessel in the mammary gland of a mouse expressing GFP-tagged myosin IIb (green) and labeled with the mitochondrial vital dye MitoTracker (red) was imaged in time lapse by using confocal microscopy (excitation wavelengths: 488 nm and 561 nm). Figure corresponds to Video 1 . Time is expressed as minutes:seconds. Bars: (A) 100 µm; (B) 10 µm; (C) 30 µm; (D) 10 µm.
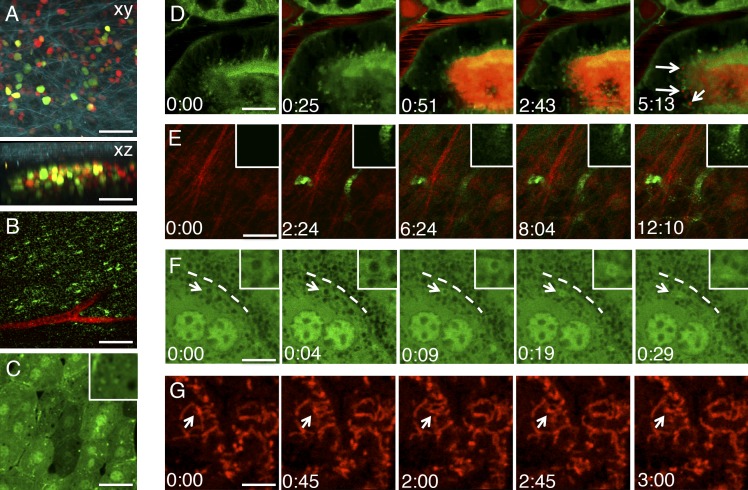
Imaging subcellular events in live animals. (A) Human squamous carcinoma cells were engineered to stably express the Fucci cell cycle reporter into the nucleus and injected in the back of an immunocompromised mouse. After 1 wk, the tumor was imaged by two-photon microscopy and SHG (excitation wavelength: 930 nm). (top) Maximal projection of a z stack (xy view). Cells in G2/M are in green, cells in G1 are in red, and collagen fibers are in cyan. (bottom) Lateral view (xz) of a z stack. (B) Clusters of GLUT4-containing vesicles (green) in the soleus muscle of a transgenic mouse expressing GFP-GLUT4 and injected with 70 kD Texas red–dextran to visualize the vasculature and imaged by two-photon microscopy (excitation wavelength: 930 nm). (C) Confocal microscopy (excitation wavelength: 488 nm) of hepatocytes in the liver of a transgenic mouse expressing the autophagy marker GFP-LC3. The inset shows small GFP-LC3 autophagic vesicles. (D–G) Dynamics of intracellular compartments imaged by time-lapse two-photon (E) or confocal microscopy (D, F, and G). (D) Endocytosis of systemically injected 10 kD Texas red–dextran into the kidney of a transgenic mouse expressing the membrane marker m-GFP. The dextran (red) is transported from the microvasculature into the proximal tubuli, and then internalized in small endocytic vesicles (arrows; Video 2 ). (E) Endocytosis of a systemically injected 10 kD of Alexa Fluor 488 dextran into the salivary glands of a live rat. The dextran (green) diffuses from the vasculature into the stroma, and it is internalized by stromal cells (insets). Collagen fibers (red) are highlighted by SHG. (F) Regulated exocytosis of large secretory granules in the salivary glands of a live transgenic mouse expressing cytoplasmic GFP. The GFP is excluded from the secretory granules and accumulates on their limiting membranes (arrows) after fusion with the plasma membrane (broken lines). The gradual collapse of an individual granule is highlighted in the insets. (G) Dynamics of mitochondria labeled with the membrane potential dye TMRM in the salivary glands of a live mouse. Time is expressed as minutes:seconds. Bars: (A) 40 µm; (B) 15 µm; (C, D, E, and G) 10 µm; (F) 5 µm.
References
-
- Babbey C.M., Ryan J.C., Gill E.M., Ghabril M.S., Burch C.R., Paulman A., Dunn K.W. 2012. Quantitative intravital microscopy of hepatic transport. IntraVital. 1:44–53 10.4161/intv.21296 - DOI
Publication types
MeSH terms
Substances
Grants and funding
LinkOut - more resources
Full Text Sources
Other Literature Sources
