. 2013 Dec;19(23-24):2565-76.
doi: 10.1089/ten.TEA.2013.0256. Epub 2013 Aug 2.

Enhanced osteogenesis in cocultures with human mesenchymal stem cells and endothelial cells on polymeric microfiber scaffolds

Affiliations

Enhanced osteogenesis in cocultures with human mesenchymal stem cells and endothelial cells on polymeric microfiber scaffolds

Julia G Gershovich et al. Tissue Eng Part A. 2013 Dec.

Abstract

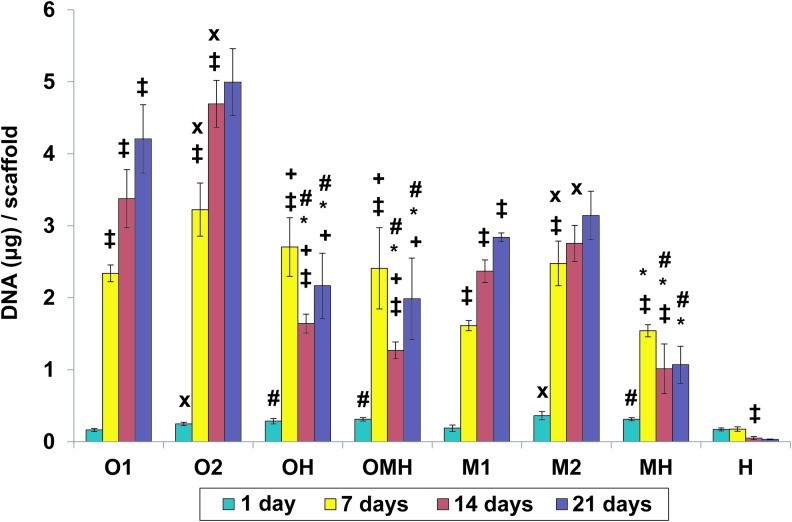
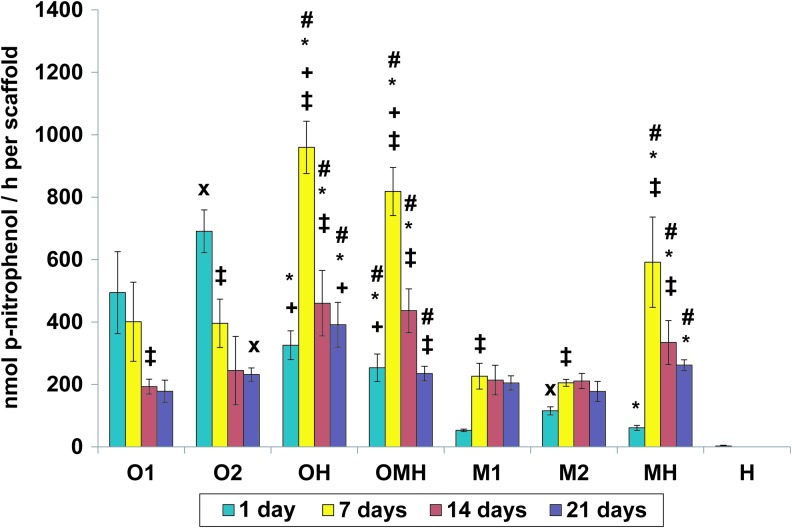
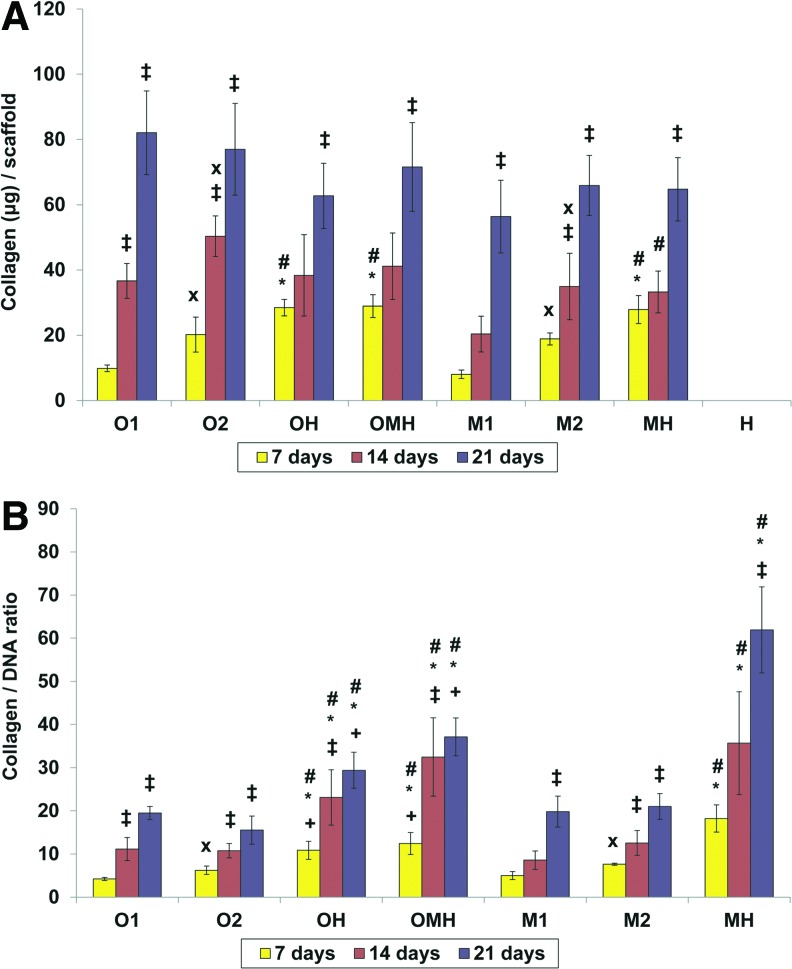
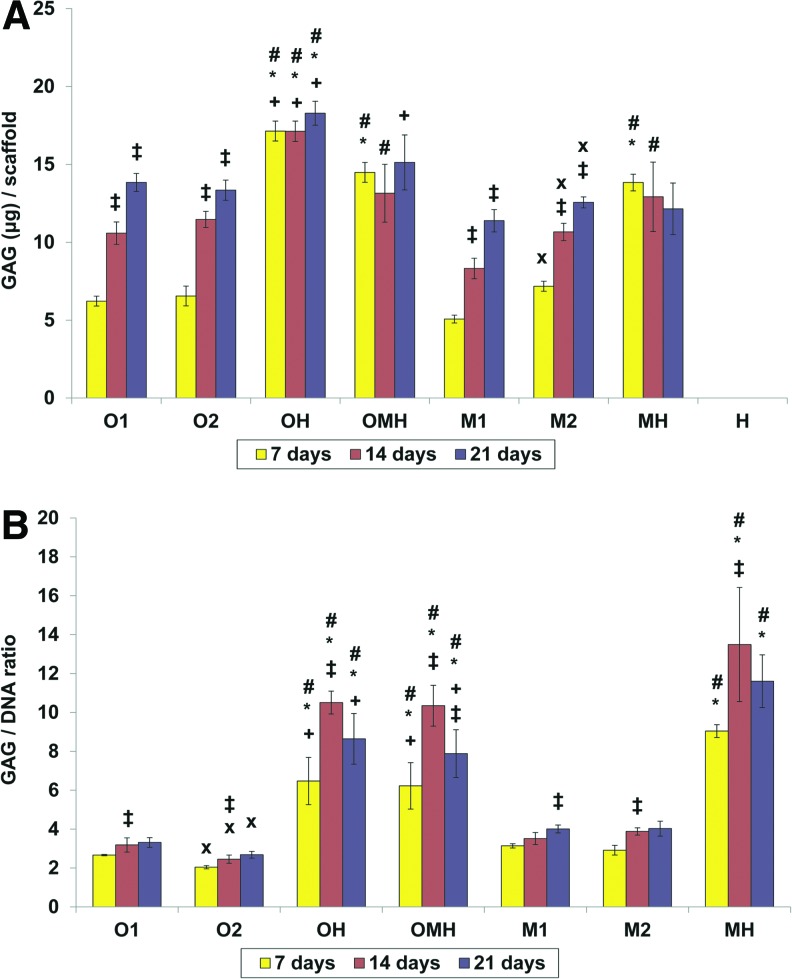
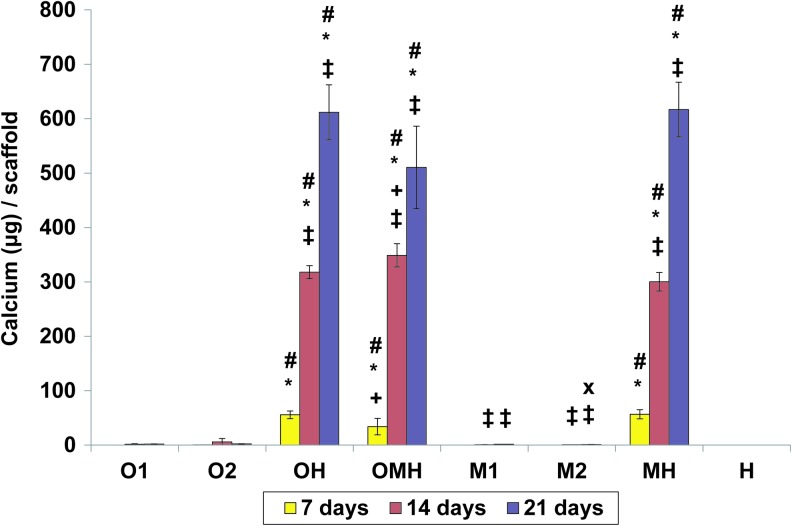
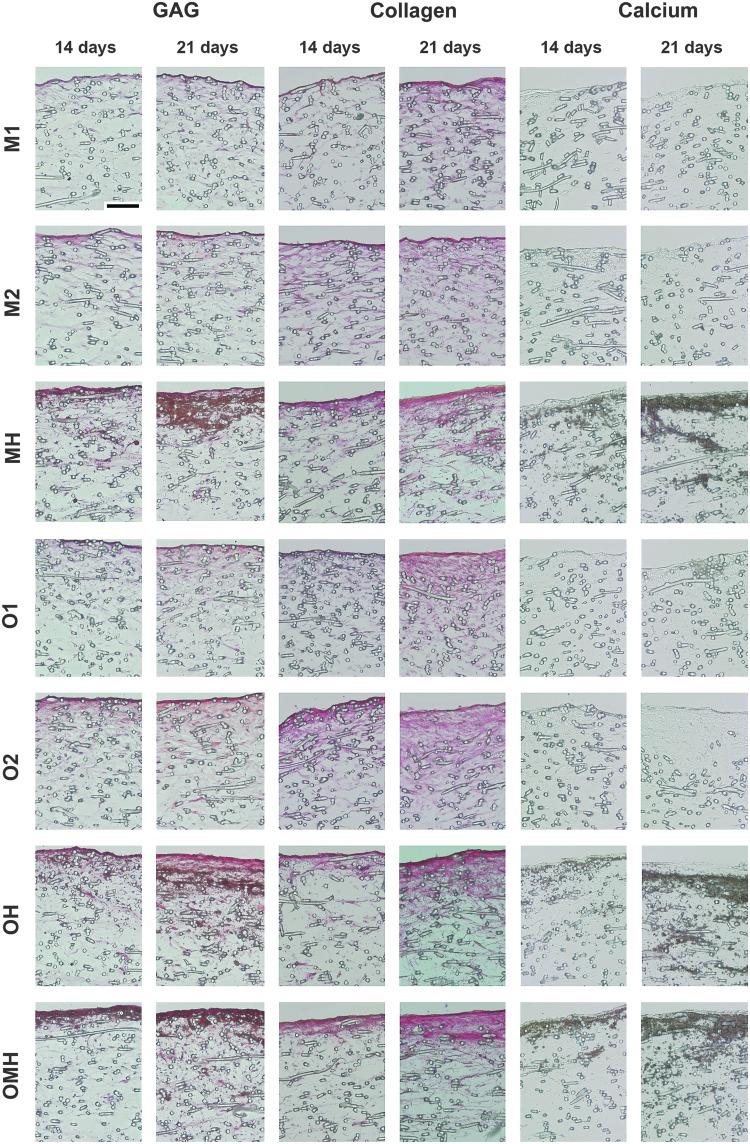
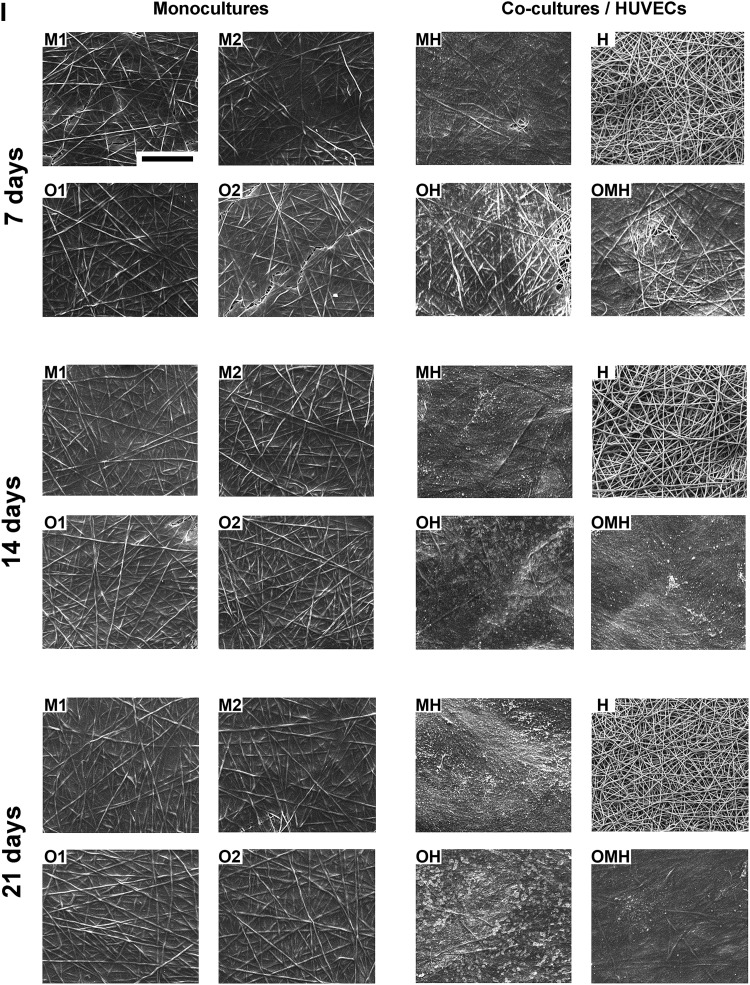
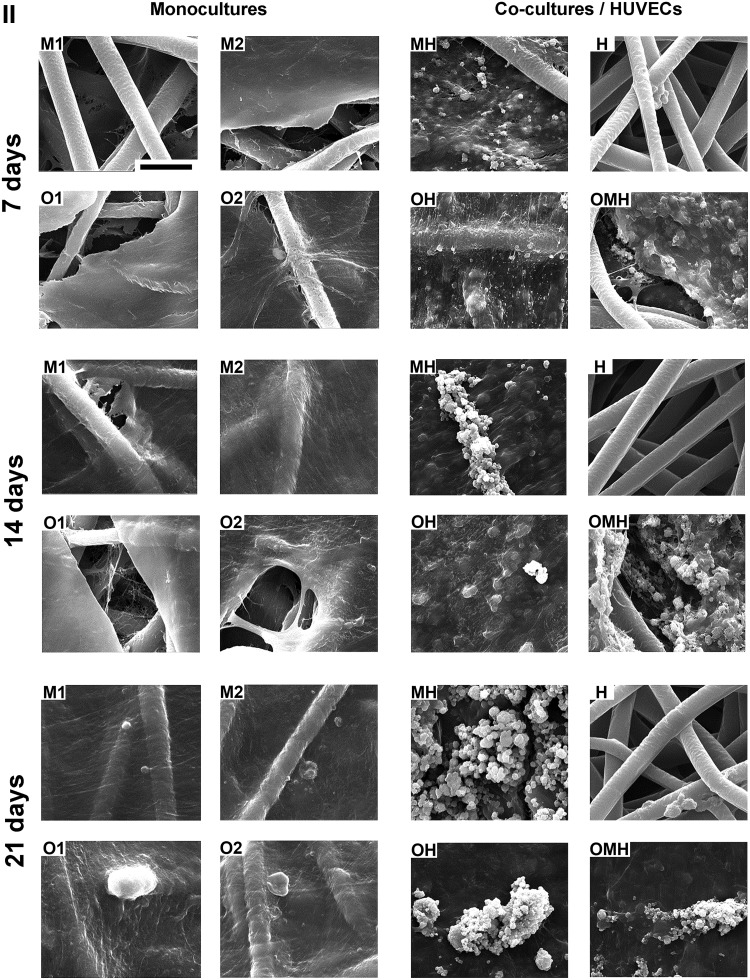
In this work, human mesenchymal stem cells (hMSCs) and their osteogenically precultured derivatives were directly cocultured with human umbilical vein endothelial cells (HUVECs) on electrospun three-dimensional poly(ɛ-caprolactone) microfiber scaffolds to evaluate the coculture's effect on the generation of osteogenic constructs. Specifically, cells were cultured on scaffolds for up to 3 weeks, and the cellularity, alkaline phosphatase (ALP) activity, and bone-like matrix formation were assessed. Constructs with cocultures and monocultures had almost identical cellularity after the first week, however, lower cellularity was observed in cocultures compared to monocultures during the subsequent 2 weeks of culture. Scaffolds with cocultures showed a significantly higher ALP activity, glycosaminoglycan and collagen production, as well as greater calcium deposition over the course of study compared to monocultures of hMSCs. Furthermore, the osteogenic outcome was equally robust in cocultures containing osteogenically precultured and non-precultured hMSCs. The results demonstrate that the combination of MSC and HUVEC populations within a porous scaffold material under osteogenic culture conditions is an effective strategy to promote osteogenesis.


Figures

FIG. 1.
FIG. 1.
The DNA content at 1, 7, 14, and 21 days of culture in (O1) osteogenically precultured human mesenchymal stem cells (hMSCs) seeded at 1.5×10⁵ cells per scaffold, (O2) osteogenically precultured hMSCs seeded at 3.0×10⁵ cells per scaffold, (OH) 1:1 ratio of osteogenically precultured hMSCs and human umbilical vein endothelial cells (HUVECs) seeded at 3.0×10⁵ cells per scaffold, (OMH) 1:1:1 ratio of osteogenically precultured hMSCs, hMSCs, and HUVECs seeded at 3.0×10⁵ cells per scaffold, (M1) hMSCs seeded at 1.5×10⁵ cells per scaffold, (M2) hMSCs seeded at 3.0×10⁵ cells per scaffold, (MH) 1:1 ratio of hMSCs and HUVECS seeded at 3.0×10⁵ cells per scaffold, and (H) HUVECs seeded at 1.5×10⁵ cells per scaffold. The results are presented as mean±standard deviation (SD) for n=4. #, *Denote significant difference of cocultures from the corresponding monocultures (with lower and higher densities, respectively),+indicates significant difference of precultured cocultures (OH, OMH) versus coculture of non-precultured cells (MH),×denotes significant difference between monocultures with lower and higher seeding density. Reflects significant difference to the previous time point for all groups (p<0.05). Color images available online at www.liebertpub.com/tea
FIG. 2.
FIG. 2.
Alkaline phosphatase activity at 1, 7, 14, and 21 days of culture in (O1) osteogenically precultured hMSCs seeded at 1.5×10⁵ cells per scaffold, (O2) osteogenically precultured hMSCs seeded at 3.0×10⁵ cells per scaffold, (OH) 1:1 ratio of osteogenically precultured hMSCs and HUVECS seeded at 3.0×10⁵ cells per scaffold, (OMH) 1:1:1 ratio of osteogenically precultured hMSCs, hMSCs, and HUVECs seeded at 3.0×10⁵ cells per scaffold, (M1) hMSCs seeded at 1.5×10⁵ cells per scaffold, (M2) hMSCs seeded at 3.0×10⁵ cells per scaffold, (MH) 1:1 ratio of hMSCs and HUVECS seeded at 3.0×10⁵ cells per scaffold, and (H) HUVECs seeded at 1.5×10⁵ cells per scaffold. The results are presented as mean±SD for n=4. #,*Denote significant difference of cocultures from the corresponding monocultures (with lower and higher densities, respectively),+indicates significant difference of precultured cocultures (OH, OMH) versus coculture of non-precultured cells (MH),×denotes significant difference between monocultures with lower and higher seeding density. Reflects significant difference to the previous time point for all groups (p<0.05). Color images available online at www.liebertpub.com/tea
FIG. 3.
FIG. 3.
Collagen content (A) or normalized collagen content (B) at 7, 14, and 21 days of culture in (O1) osteogenically precultured hMSCs seeded at 1.5×10⁵ cells per scaffold, (O2) osteogenically precultured hMSCs seeded at 3.0×10⁵ cells per scaffold, (OH) 1:1 ratio of osteogenically precultured hMSCs and HUVECS seeded at 3.0×10⁵ cells per scaffold, (OMH) 1:1:1 ratio of osteogenically precultured hMSCs, hMSCs, and HUVECs seeded at 3.0×10⁵ cells per scaffold, (M1) hMSCs seeded at 1.5×10⁵ cells per scaffold, (M2) hMSCs seeded at 3.0×10⁵ cells per scaffold, (MH) 1:1 ratio of hMSCs and HUVECS seeded at 3.0×10⁵ cells per scaffold, and (H) HUVECs seeded at 1.5×10⁵ cells per scaffold. The results are presented as mean±SD for n=4. #,*Denote significant difference of cocultures from the corresponding monocultures (with lower and higher densities, respectively),+indicates significant difference of precultured cocultures (OH, OMH) versus coculture of non-precultured cells (MH),×denotes significant difference between monocultures with lower and higher seeding density. Reflects significant difference to the previous time point for all groups (p<0.05). Color images available online at www.liebertpub.com/tea
FIG. 4.
FIG. 4.
Glycosaminoglycan (GAG) content (A) or normalized GAG content (B) at 7, 14, and 21 days of culture in (O1) osteogenically precultured hMSCs seeded at 1.5×10⁵ cells per scaffold, (O2) osteogenically precultured hMSCs seeded at 3.0×10⁵ cells per scaffold, (OH) 1:1 ratio of osteogenically precultured hMSCs and HUVECS seeded at 3.0×10⁵ cells per scaffold, (OMH) 1:1:1 ratio of osteogenically precultured hMSCs, hMSCs, and HUVECs seeded at 3.0×10⁵ cells per scaffold, (M1) hMSCs seeded at 1.5×10⁵ cells per scaffold, (M2) hMSCs seeded at 3.0×10⁵ cells per scaffold, (MH) 1:1 ratio of hMSCs and HUVECS seeded at 3.0×10⁵ cells per scaffold, and (H) HUVECs seeded at 1.5×10⁵ cells per scaffold. The results are presented as mean±SD for n=4. #, *Denote significant difference of cocultures from the corresponding monocultures (with lower and higher densities, respectively),+indicates significant difference of precultured cocultures (OH, OMH) versus coculture of non-precultured cells (MH),×denotes significant difference between monocultures with lower and higher seeding density. Reflects significant difference to the previous time point for all groups (p<0.05). Color images available online at www.liebertpub.com/tea
FIG. 5.
FIG. 5.
Calcium contents at 7, 14, and 21 days of culture in (O1) osteogenically precultured hMSCs seeded at 1.5×10⁵ cells per scaffold, (O2) osteogenically precultured hMSCs seeded at 3.0×10⁵ cells per scaffold, (OH) 1:1 ratio of osteogenically precultured hMSCs and HUVECS seeded at 3.0×10⁵ cells per scaffold, (OMH) 1:1:1 ratio of osteogenically precultured hMSCs, hMSCs, and HUVECs seeded at 3.0×10⁵ cells per scaffold, (M1) hMSCs seeded at 1.5×10⁵ cells per scaffold, (M2) hMSCs seeded at 3.0×10⁵ cells per scaffold, (MH) 1:1 ratio of hMSCs and HUVECS seeded at 3.0×10⁵ cells per scaffold, and (H) HUVECs seeded at 1.5×10⁵ cells per scaffold. The results are presented as mean±SD for n=4. #, *Denote significant difference of cocultures from the corresponding monocultures (with lower and higher densities, respectively),+indicates significant difference of precultured cocultures (OH, OMH) versus coculture of non-precultured cells (MH),×denotes significant difference between monocultures with lower and higher seeding density. Reflects significant difference to the previous time point for all groups (p<0.05). Color images available online at www.liebertpub.com/tea
FIG. 6.
FIG. 6.
Bone-like matrix production, maturation, and mineralization within the poly(ɛ-caprolactone) scaffolds with monocultures of hMSCs (M1, M2, O1, O2) and osteogenically precultured cocultures (OH, OMH) or non-precultured coculture hMSCs (MH) with HUVECs. Three panels display Safranin O staining for sulfated GAGs (red), Picrosirius Red staining for total collagen (pink), and von Kossa staining for calcium salts (brown). Scale bar represents 100 μm in all images.
Appendix FIG. A1.
Appendix FIG. A1.
Extracellular matrix organization of scaffolds with monocultures of human mesenchymal stem cells (hMSCs; M1, M2, O1, O2) and cocultures of hMSCs with human umbilical vein endothelial cells (HUVECs; MH, OH, and OMH) imaged via scanning electron microscopy (SEM). Magnification 100×, scale bar is 500 μm and applies for all images. Note the absence of the matrix and the lack of any mineralization on the scaffolds with endothelial cells (H) although cells are still present on the poly(ɛ-caprolactone) (PCL) fibers.
Appendix FIG. A2.
Appendix FIG. A2.
Extracellular matrix organization of scaffolds with monocultures of hMSCs (M1, M2, O1, O2) and cocultures of hMSCs with HUVECs (MH, OH, and OMH) imaged via SEM. Magnification 2000×, scale bar is 30 μm and applies for all images. Note the absence of the matrix and the lack of any mineralization on the scaffolds with endothelial cells (H) although cells are still present on the PCL fibers.

Similar articles

Cited by

References

    1. Bauer T.W. Muschler G.F. Bone graft materials. An overview of the basic science. Clin Orthop Relat Res. 2000;371:10. - PubMed
    1. Mikos A.G. Herring S.W. Ochareon P. Elisseeff J. Lu H.H. Kandel R., et al. Engineering complex tissues. Tissue Eng. 2006;12:3307. - PMC - PubMed
    1. Moon J.J. West J.L. Vascularization of engineered tissues: approaches to promote angiogenesis in biomaterials. Curr Top Med Chem. 2008;8:300. - PMC - PubMed
    1. Rouwkema J. Rivron N.C. van Blitterswijk C.A. Vascularization in tissue engineering. Trends Biotechnol. 2008;26:434. - PubMed
    1. Kanczler J.M. Oreffo R.O. Osteogenesis and angiogenesis: the potential for engineering bone. Eur Cell Mater. 2008;15:100. - PubMed

Publication types

MeSH terms