Review
. 2013 Jul;16(7):824-31.
doi: 10.1038/nn.3410. Epub 2013 Jun 25.

Probing perceptual decisions in rodents

Affiliations
Review

Probing perceptual decisions in rodents

Matteo Carandini et al. Nat Neurosci. 2013 Jul.

Abstract

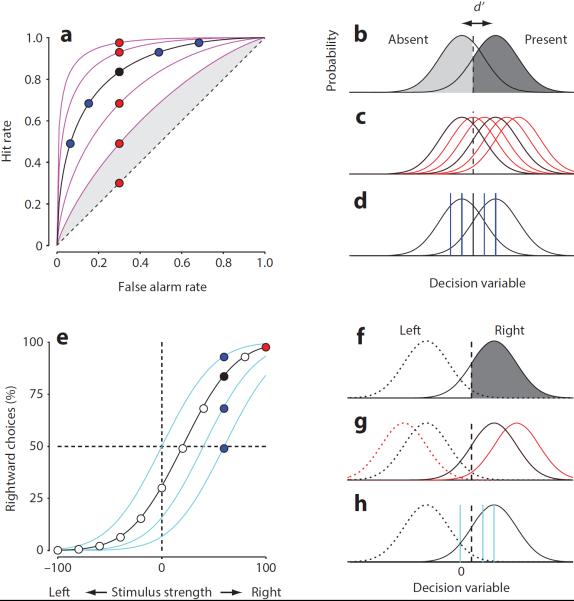
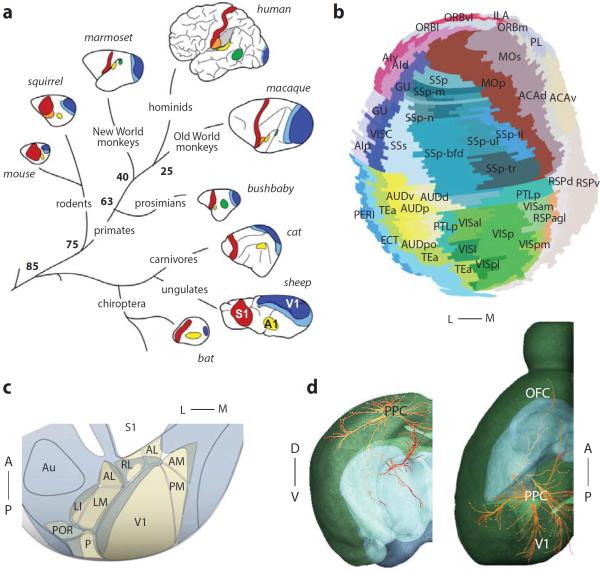
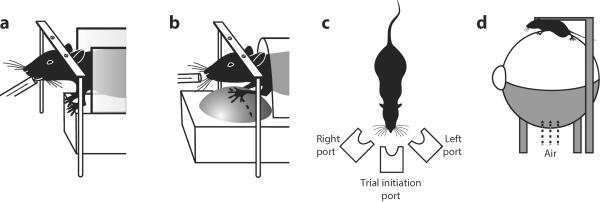
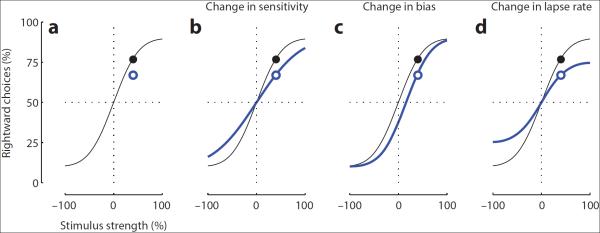
The study of perceptual decision-making offers insight into how the brain uses complex, sometimes ambiguous information to guide actions. Understanding the underlying processes and their neural bases requires that one pair recordings and manipulations of neural activity with rigorous psychophysics. Though this research has been traditionally performed in primates, it seems increasingly promising to pursue it at least partly in mice and rats. However, rigorous psychophysical methods are not yet as developed for these rodents as they are for primates. Here we give a brief overview of the sensory capabilities of rodents and of their cortical areas devoted to sensation and decision. We then review methods of psychophysics, focusing on the technical issues that arise in their implementation in rodents. These methods represent a rich set of challenges and opportunities.


Figures

Box Figure
Box Figure. Analyzing psychophysical data with Signal Detection Theory
ad: Analysis of a “go/no-go” experiment. eh: Analysis of a two-alternative forced choice experiment in which the subject chooses between two stimuli, one presented on the left and one presented on the right.
Fig. 1
Fig. 1
Areas and connections in the mouse cortex. a: A schematic of sensory cortical areas in eight mammalian species. Shown are the primary and secondary visual areas (V1 and V2), the primary auditory area (A1) and the primary somatosensory area (S1). Numbers at branch points indicate age of last common ancestors, in million of years . Adapted from Ref. 11. b: Flattened map of the mouse cortex. Adapted from Ref. 98. c: The mouse visual cortex contains at least 10 visual areas. Area LM is the region marked V2 in panel a. Modified from Ref. 12. d: The projections of mouse PPC. The brain is shown in transparency (green: cortex; blue: thalamus). Line color indicates projection intensity (red: strongest; yellow: weaker). Dots indicate termination sites. Only ipsilateral projections are shown; callosal fibers terminate in contralateral PPC (not shown). Images from the Allen Brain Atlas, visualized using Brain Explorer 2.
Fig 2
Fig 2. Techniques for rodent psychophysics
a. A custom apparatus keeps animals still during stimulus presentation. Animals lick a spout to report detection of a stimulus. b. Animals report decisions by moving a “track ball” to the left or right allowing a continuous monitoring of their developing decisions. c. A 3-port apparatus wherein animals freely move first to a center port, where stimuli are presented, and then to a left or right “reward port” where decisions about the stimuli are reported. d. A virtual reality set-up where movement of the animals' legs moves a floating Styrofoam ball that drives updating of a visual display.
Fig 3
Fig 3. Interpreting psychometric curves
a. Psychometric functions for an experiment involving 2 stimuli and 2 responses, relating the rate of one of the responses (ordinate) to the relative strength of the corresponding stimulus (abscissa). Black dot is one of the underlying measurements. Blue dot is a measurement made in a different experimental condition, where performance is reduced. b–d: Three interpretations of the new measurement (blue dot): it may reflect a change in sensitivity (b), a change in bias (c) or a change in lapse rate (d). These possibilities would be disambiguated if one measured a full psychometric function (blue curves). In all plots, the black curve is the same and so are the two data points.

References

    1. Parker AJ, Newsome WT. Sense and the single neuron: probing the physiology of perception. Annu Rev Neurosci. 1998;21:227–277. - PubMed
    1. Gold JI, Shadlen MN. The neural basis of decision making. Annu Rev Neurosci. 2007;30:535–574. - PubMed
    1. Luo L, Callaway EM, Svoboda K. Genetic dissection of neural circuits. Neuron. 2008;57:634–660. - PMC - PubMed
    1. Scanziani M, Hausser M. Electrophysiology in the age of light. Nature. 2009;461:930–939. - PubMed
    1. Peron S, Svoboda K. From cudgel to scalpel: toward precise neural control with optogenetics. Nature methods. 2011;8:30–34. - PubMed

Publication types

LinkOut - more resources