. 2013 Jun 25;14(6):R63.
doi: 10.1186/gb-2013-14-6-r63.

Phytophthora capsici-tomato interaction features dramatic shifts in gene expression associated with a hemi-biotrophic lifestyle

Phytophthora capsici-tomato interaction features dramatic shifts in gene expression associated with a hemi-biotrophic lifestyle

Julietta Jupe et al. Genome Biol. .

Abstract

Background: Plant-microbe interactions feature complex signal interplay between pathogens and their hosts. Phytophthora species comprise a destructive group of fungus-like plant pathogens, collectively affecting a wide range of plants important to agriculture and natural ecosystems. Despite the availability of genome sequences of both hosts and microbes, little is known about the signal interplay between them during infection. In particular, accurate descriptions of coordinate relationships between host and microbe transcriptional programs are lacking.

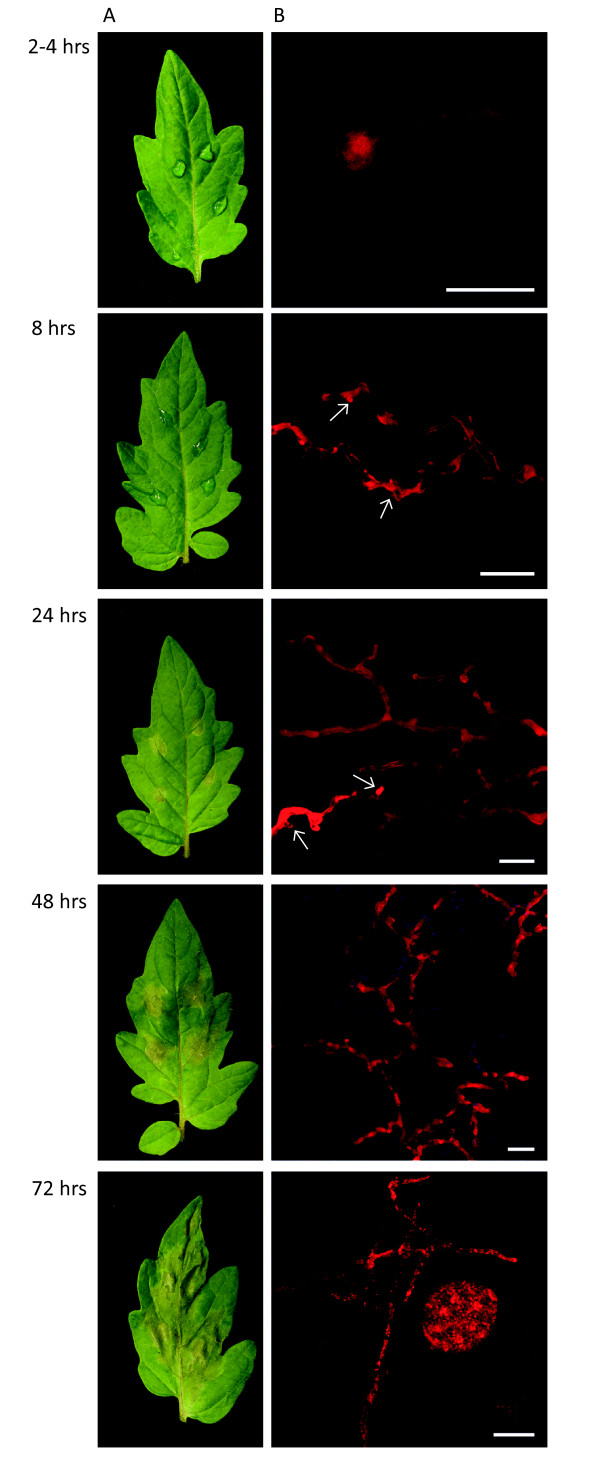
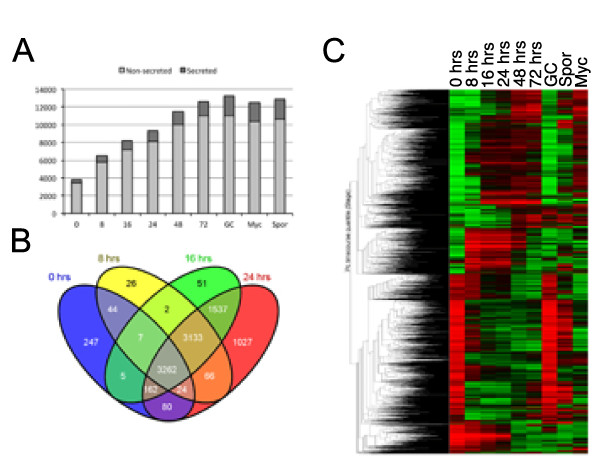
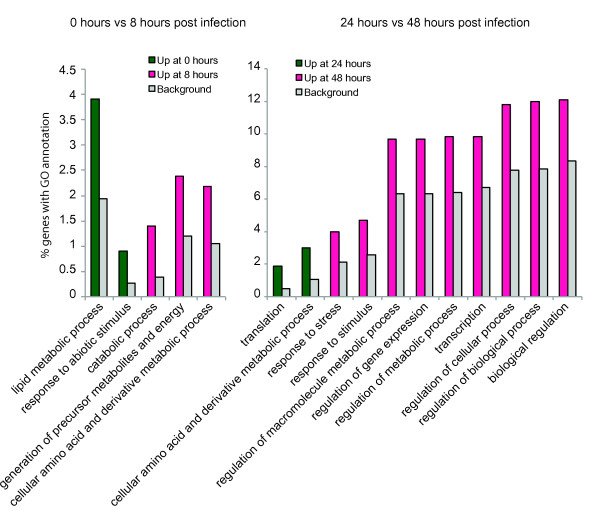
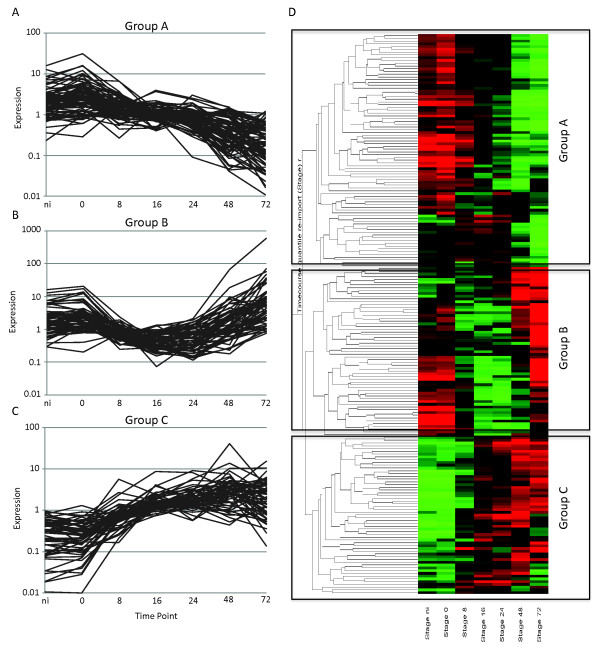
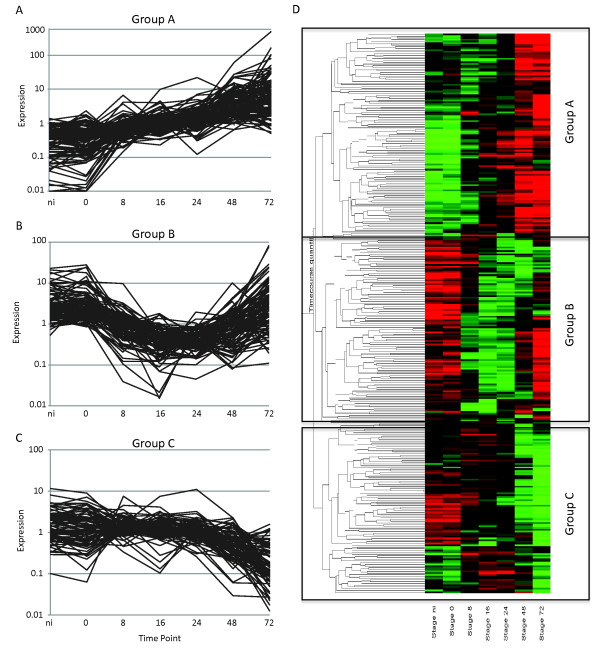
Results: Here, we explore the molecular interaction between the hemi-biotrophic broad host range pathogen Phytophthora capsici and tomato. Infection assays and use of a composite microarray allowed us to unveil distinct changes in both P. capsici and tomato transcriptomes, associated with biotrophy and the subsequent switch to necrotrophy. These included two distinct transcriptional changes associated with early infection and the biotrophy to necrotrophy transition that may contribute to infection and completion of the P. capsici lifecycle

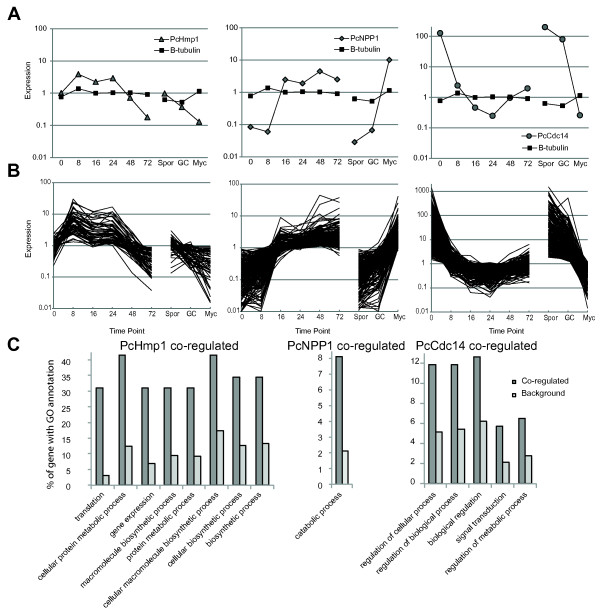
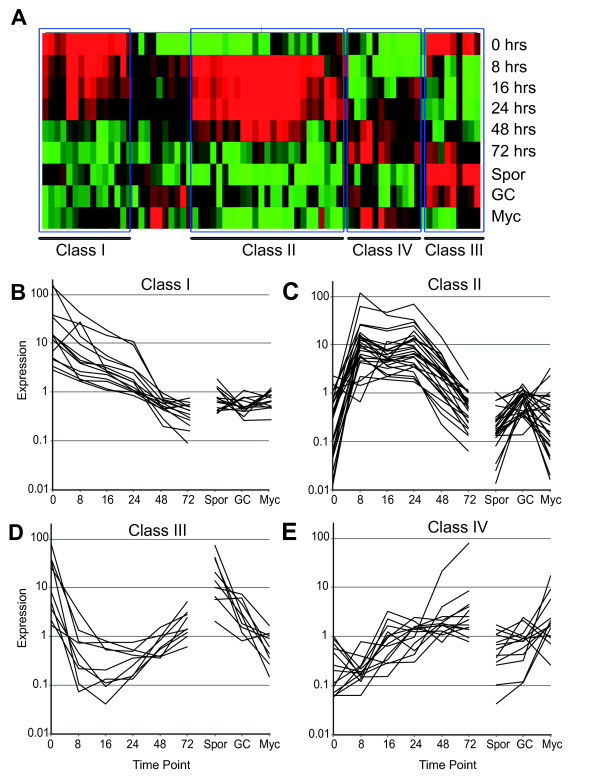
Conclusions: Our results suggest dynamic but highly regulated transcriptional programming in both host and pathogen that underpin P. capsici disease and hemi-biotrophy. Dynamic expression changes of both effector-coding genes and host factors involved in immunity, suggests modulation of host immune signaling by both host and pathogen. With new unprecedented detail on transcriptional reprogramming, we can now explore the coordinate relationships that drive host-microbe interactions and the basic processes that underpin pathogen lifestyles. Deliberate alteration of lifestyle-associated transcriptional changes may allow prevention or perhaps disruption of hemi-biotrophic disease cycles and limit damage caused by epidemics.


Figures

Figure 1
Figure 1
Phytophthora capsici infection of tomato features a hemi-biotrophic lifecycle. (A) Tomato leaves infected with zoospore suspensions of P. capsici at 2-4, 8, 24, 48, and 72 hours post-infection (hpi). (B) Confocal microscopy images of tomato leaves infected with a transgenic P. capsici strain expressing the fluorescent protein TdTomato (red). Infection featured rapid germination of cysts and infection at 8 hpi, formation of biotrophy associated haustoria (arrowheads) visible up to 48 hpi after infection, and rapid growth and sporulation at 48 and 72 hpi respectively. Scale bar = 20 μm.
Figure 2
Figure 2
Expression of Phytophthora capsici gene complement during infection and disease progression. (A) Overview of genes that were expressed as detected on the P. capsici-tomato two-genome microarray. The proportion of genes encoding putative secreted proteins (effectors) are indicated by dark grey. (B) Assessment of overlap of genes expressed in infectious stages and (C) overall assessment of differentially expressed P. capsici genes, determined by ANOVA as described in the text. Red and green represent upregulated and downregulated genes respectively. The y-axis shows average linkage of Pearson correlations of gene-expression profiles. The Venn diagram was generated using Venny [49].
Figure 3
Figure 3
Marker gene-assisted identification of stage-specific processes in P. capsici. (A) Expression of PcHmp1 (left panel), PcNpp1 (middle panel), and PcCdc14 (right panel) as determined by whole-genome microarray analyses and compared with the constitutive control gene β-tubulin. (B) Marker genes were used in cluster analyses to identify genes that were coregulated. The y-axis represents fold change in expression values, determined by calculating fold changes over mean expression values across all treatments. (C) Overview of significantly enriched ontologies present in marker coregulated genes. Dark bar shows the percentage of genes in the coregulated fraction compared with the background fraction (light grey). All ontologies shown were significantly enriched (P<0.05, false discovery rate <0.05).
Figure 4
Figure 4
Identification of classes of differentially expressed RXLR genes in Phytophthora capsici. (A) Cluster analyses of putative RXLR genes that were found to be differentially expressed across infectious and developmental stages identified four different groups of genes. (B-E) Overview of expression patterns corresponding to the groups shown in (A). Values on the y-axis represents fold change over mean expression as determined across all treatments.
Figure 5
Figure 5
Phytophthora capsici infection of tomato results in two distinct transcriptional responses. (A) Overview of the number of significantly upregulated (dark grey) or downregulated (light grey) between adjacent timepoints. Differences in the number of differentially expressed genes can be seen between specific early (0 versus 8 hpi) and late (24 versus 48 hpi) time-point comparisons. The non-infected (Ni) tissue was a water-inoculated control sample. Comparisons between gene lists generated in pairwise comparisons revealed limited overlap in both (B) upregulated and (C) downregulated gene sets. Diagrams were generated using Venny [49].
Figure 6
Figure 6
Gene ontology (GO) enrichment analyses of tomato genes identified in the early (0 versus 8) and late (24 versus 48) transcriptional response. Percentage of genes with significantly enriched GO terms that were specifically expressed in either of the time points (magenta/green) in our pairwise comparisons, compared with the background (grey). The y-axis shows the percentage of genes falling within each given GO annotation class.
Figure 7
Figure 7
Differentially expressed immune signaling candidate genes identified in microarray analyses. Overview of differentially expressed immune signaling candidate genes identified in pairwise comparisons between time points (Student's t-test) and ANOVA (P = 0.005) analyses. (A-C) Expression profiles are presented for class A, B, and C genes, identified by (D) cluster analyses in Genespring. Red and green represent upregulated and downregulated genes respectively. The y-axis shows average linkage of Pearson correlations of gene-expression profiles. The non-infected (Ni) tissue was a water-inoculated control sample.
Figure 8
Figure 8
Phytophthora capsici infection leads to dynamic changes in host transcription-factor genes. Overview of differentially expressed candidate transcription-factor genes, identified in pairwise comparisons between time points (Student's t-test) and ANOVA (P = 0.005) analyses. (A-C) Expression profiles are presented for class A, B, and C genes, identified by (D) cluster analyses in Genespring, showing distinct expression changes during infection. Red and green represent upregulated and downregulated genes respectively. The y-axis shows average linkage of Pearson correlations of gene-expression profiles. The non-infected (Ni) tissue was a water-inoculated control sample.

References

    1. Jones JDG, Dangl JL. The plant immune system. Nature. 2006;14:323–329. doi: 10.1038/nature05286. - DOI - PubMed
    1. Birch PRJ, Rehmany AP, Pritchard L, Kamoun S, Beynon JL. Trafficking arms: oomycete effectors enter host plant cells. Trends Microbiol. 2006;14:8–11. doi: 10.1016/j.tim.2005.11.007. - DOI - PubMed
    1. Chisholm ST, Coaker G, Day B, Staskawicz BJ. Host-microbe interactions: shaping the evolution of the plant immune response. Cell. 2006;14:803–814. doi: 10.1016/j.cell.2006.02.008. - DOI - PubMed
    1. Kamoun S. A catalogue of the effector secretome of plant pathogenic oomycetes. Annu Rev Phytopathol. 2006;14:41–60. doi: 10.1146/annurev.phyto.44.070505.143436. - DOI - PubMed
    1. Fisher MC, Henk DA, Briggs CJ, Brownstein JS, Madoff LC, McCraw SL, Gurr SJ. Emerging fungal threats to animal, plant and ecosystem health. Nature. 2012;14:186–194. doi: 10.1038/nature10947. - DOI - PMC - PubMed

Publication types

MeSH terms

LinkOut - more resources