

Geographic variation in ambulatory electronic health record adoption: implications for underserved communities
- PMID: 23800087
- PMCID: PMC3876400
- DOI: 10.1111/1475-6773.12078
Geographic variation in ambulatory electronic health record adoption: implications for underserved communities
Abstract
Objective: To describe small area variation in ambulatory electronic health record (EHR) adoption and assess evidence of a "digital divide" in whether adoption is lagging in traditionally underserved communities.
Data sources: Survey data on U.S. ambulatory health care sites (261,973 sites representing 716,160 providers) collected by SK&A Information Services in 2011.
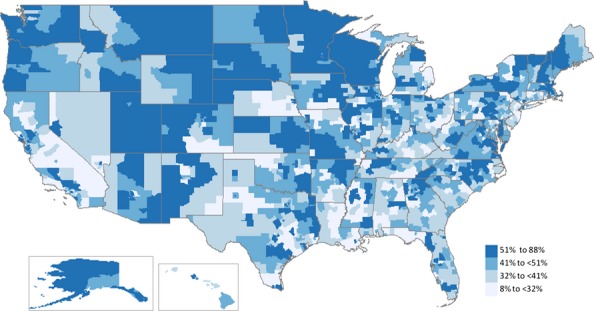
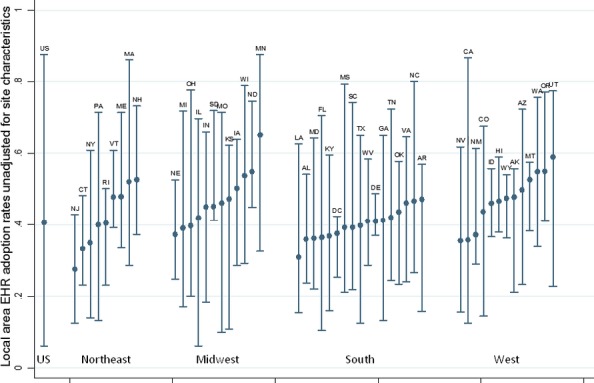
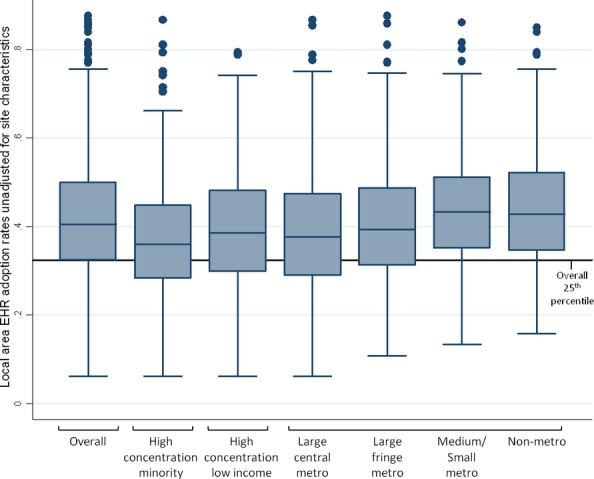
Study design: We examined cross-sectional variation in two measures of local area EHR adoption: share of providers at sites using an EHR with e-prescribing functionality; and predicted probability of EHR adoption for the average site. Local areas were defined as Public Use Microdata Areas (n = 2,068). Using multivariate regression, we examined the association between adoption and three area characteristics: high concentration of minority population; high concentration of low-income population; and metropolitan status.
Principal findings: EHR adoption varied significantly across local areas, ranging from 8 to 88 percent with a median of 41 percent. Adoption was lower in large metropolitan areas; areas with high concentration of minority population in the Northeast and West; and areas with high concentration of low-income population in the Midwest.
Conclusions: Our 2011 estimates suggest there was substantial room for increased EHR adoption across the United States, including some underserved areas with relatively low EHR adoption rates. Further research should monitor policy initiatives in these areas and examine sources of heterogeneity in low- and high-adoption communities.
Keywords: Electronic health records; ambulatory care; geographic variation; underserved populations.
© Health Research and Educational Trust.
Figures
References
-
- Abdolrasulnia M, Menachemi N, Shewchuk RM, Ginter PM, Duncan WJ, Brooks RG. “Market Effects on Electronic Health Record Adoption by Physicians”. Health Care Management Review. 2008;33(3):243–52. - PubMed
-
- Agency for Healthcare Research and Quality. 2010. “2010 National Healthcare Disparities Report” [accessed on June 19, 2012]. Available at http://www.ahrq.gov/qual/nhdr10/nhdr10.pdf. - PubMed
-
- Agency for Healthcare Research and Quality. 2011. “Primary Care Workforce Facts and Stats No. 1: The Number of Practicing Primary Care Physicians in the United States” [accessed on June 19, 2012]. Available at http://www.ahrq.gov/research/pcwork1.htm. - PubMed
-
- Baicker K, Chandra A, Skinner JS, Wennberg JE. “Who You Are and Where You Live: How Race and Geography Affect the Treatment of Medicare Beneficiaries”. Health Affairs. 2004;(Suppl Variation):VAR33–44. - PubMed
-
- Baier R, Voss R, Morphis B, Viner-Brown S, Gardner R. “Rhode Island Physicians’ Health Information Technology (HIT) Use, 2009–2011”. Medicine & Health/Rhode Island. 2011;94(7):215–7. - PubMed
MeSH terms
LinkOut - more resources
Full Text Sources
Other Literature Sources
Molecular Biology Databases
