. 2014 Mar;20(3):177-87.
doi: 10.1089/ten.TEC.2013.0041. Epub 2013 Oct 19.

Three-dimensional characterization of tissue-engineered constructs by contrast-enhanced nanofocus computed tomography

Affiliations

Three-dimensional characterization of tissue-engineered constructs by contrast-enhanced nanofocus computed tomography

Ioannis Papantoniou et al. Tissue Eng Part C Methods. 2014 Mar.

Abstract

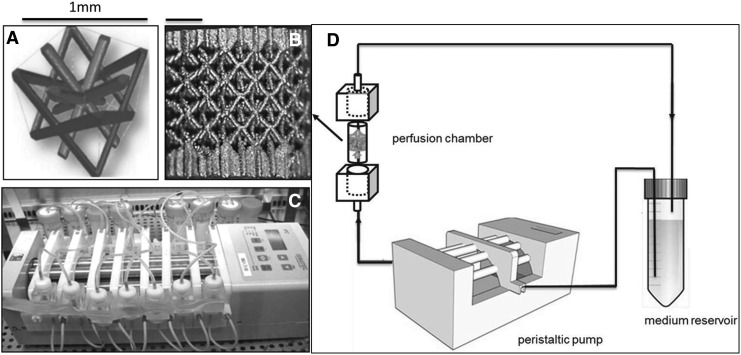
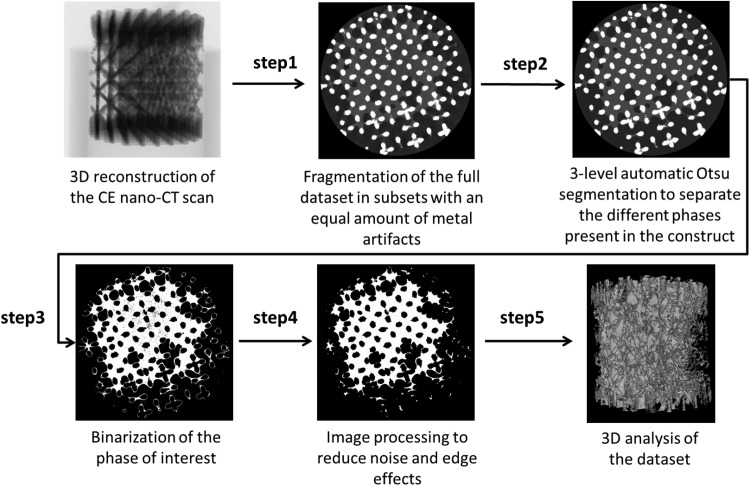
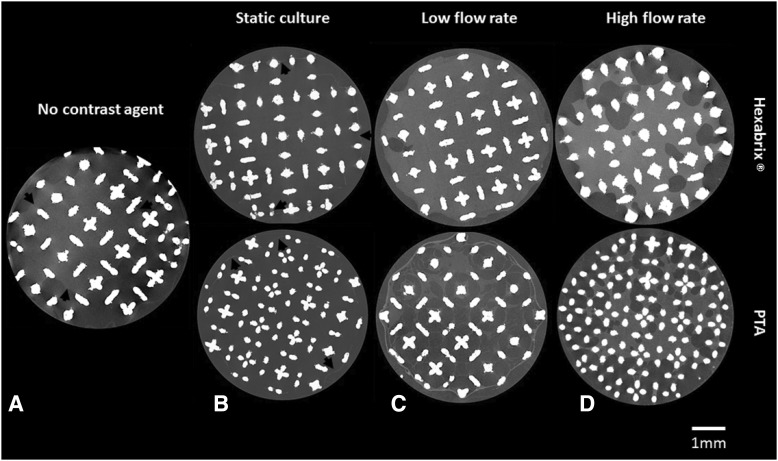
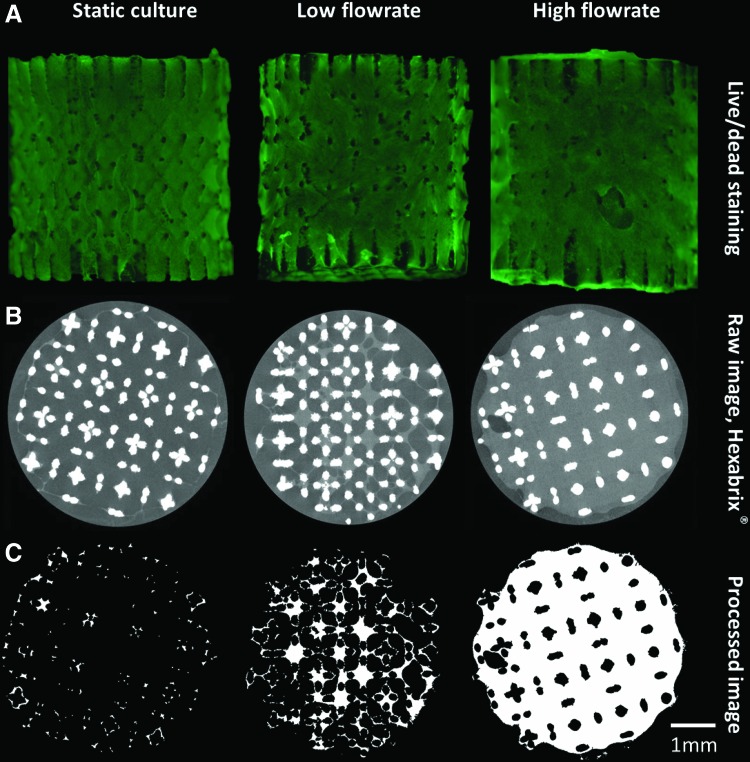
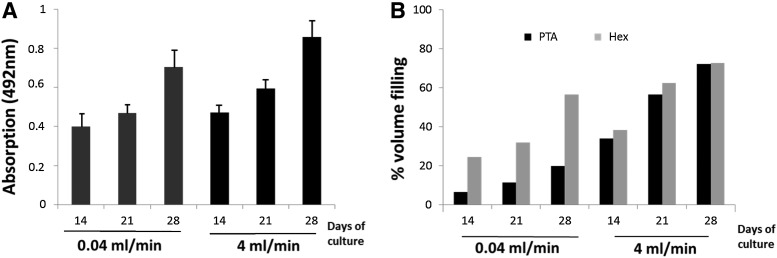
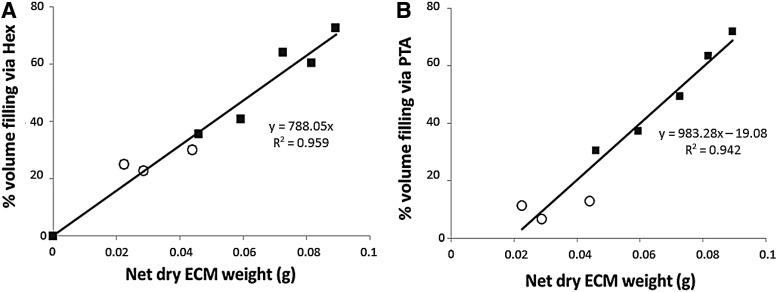
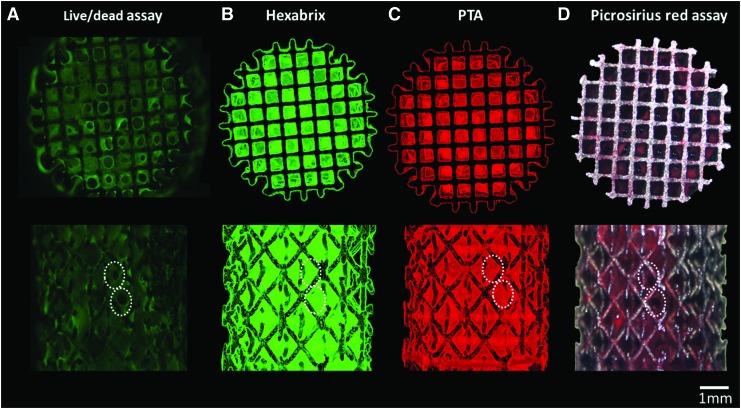
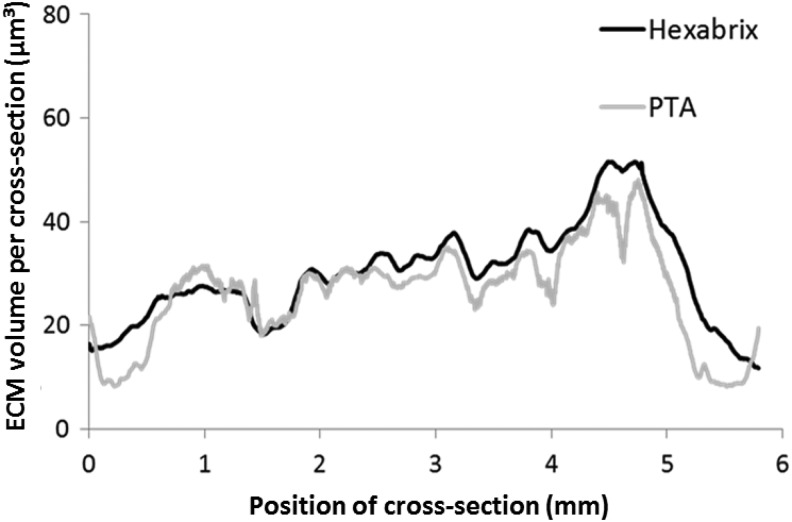
To successfully implement tissue-engineered (TE) constructs as part of a clinical therapy, it is necessary to develop quality control tools that will ensure accurate and consistent TE construct release specifications. Hence, advanced methods to monitor TE construct properties need to be further developed. In this study, we showed proof of concept for contrast-enhanced nanofocus computed tomography (CE-nano-CT) as a whole-construct imaging technique with a noninvasive potential that enables three-dimensional (3D) visualization and quantification of in vitro engineered extracellular matrix (ECM) in TE constructs. In particular, we performed a 3D qualitative and quantitative structural and spatial assessment of the in vitro engineered ECM, formed during static and perfusion bioreactor cell culture in 3D TE scaffolds, using two contrast agents, namely, Hexabrix® and phosphotungstic acid (PTA). To evaluate the potential of CE-nano-CT, a comparison was made to standardly used techniques such as Live/Dead viability/cytotoxicity, Picrosirius Red staining, and to net dry weight measurements of the TE constructs. When using Hexabrix as the contrast agent, the ECM volume fitted linearly with the net dry ECM weight independent from the flow rate used, thus suggesting that it stains most of the ECM. When using PTA as the contrast agent, comparing to net weight measurements showed that PTA only stains a part of the ECM. This was attributed to the binding specificity of this contrast agent. In addition, the PTA-stained CE-nano-CT data showed pronounced distinction between flow conditions when compared to Hexabrix, indicating culture-specific structural ECM differences. This novel type of information can contribute to optimize bioreactor culture conditions and potentially critical quality characteristics of TE constructs such as ECM quantity and homogeneity, facilitating the gradual transformation of TE constructs in well-characterized TE products.


Figures

<b>FIG. 1.</b>
FIG. 1.
(A) The parametric unit cell of the computer-aided design of the porous Ti scaffolds, which consists entirely of identical beams with constant circular cross sections (0.1 mm) and a beam length of 0.9 mm, (B) a typical image of a selective laser melting produced Ti scaffold and (C) an image of the in-house developed perfusion bioreactor equipped with parallel perfusion circuits, (D) schematic of the bioreactor setup used for three-dimensional (3D) dynamic culture, consisting of a medium reservoir containing 10 mL of medium, a peristaltic pump forcing the culture medium through the porous scaffold that was positioned in the perfusion chamber.
<b>FIG. 2.</b>
FIG. 2.
Steps followed for image analysis from the 3D reconstruction of the contrast-enhanced nanofocus computed tomography (CE-nano-CT) scan to image processing and noise reduction to final 3D quantification and distribution analysis.
<b>FIG. 3.</b>
FIG. 3.
Representative two-dimensional (2D) CE-nano-CT cross sections of a construct (A) scanned without a contrast agent, after a bioreactor perfusion high flow rate (B) scanned after static culture with both Hexabrix® and phosphotungstic acid (PTA), (C) after bioreactor perfusion (low flow rate) culture with both Hexabrix and PTA and (D) after bioreactor perfusion (high flow rate) culture with both Hexabrix and PTA. Black arrows indicate boundaries of the extracellular matrix (ECM) in the constructs.
<b>FIG. 4.</b>
FIG. 4.
(A) Live/Dead viability/cytotoxicity staining of constructs cultured in different conditions, (B) typical 2D gray-scale CE-nano-CT cross sections using Hexabrix and (C) the corresponding binarized and processed cross sections serving as input for the analysis of the ECM volume. Color images available online at www.liebertpub.com/tec
<b>FIG. 5.</b>
FIG. 5.
(A) ECM content quantification via Picrosirius Red for both flow rates over culture. (B) Relative ECM volume filling as function of the total TE construct internal void volume calculated based on CE-nano-CT using, respectively, Hexabrix and PTA.
<b>FIG. 6.</b>
FIG. 6.
Relative ECM volume filling as function of the total TE construct internal void volume calculated based on CE-nano-CT using, respectively, Hexabrix (A) and PTA (B) in function of net dry weight. TE constructs were cultured under (◯) low flow rate conditions (0.04 mL/min); (■) high flow rate conditions (4 mL/min).
<b>FIG. 7.</b>
FIG. 7.
Top and side view of the (A) Live/Dead staining of a perfusion bioreactor cultured construct at a flow rate of 4 mL/min, (B) 3D rendering of the CE-nano-CT images with Hexabrix staining, (C) 3D rendering of the CE-nano-CT images with PTA staining, and (D) Brightfield image of a scaffold stained with Picrosirius Red. White dashed lines indicate identical geometric features of the ECM in microscopic images and reconstructed images. Color images available online at www.liebertpub.com/tec
<b>FIG. 8.</b>
FIG. 8.
Representative longitudinal ECM distribution throughout the full TE construct, that is, volume of ECM per cross section, where the height of the section is 3.75 μm equal to the voxel size used for the analysis, in function of the scaffold height. Distributions obtained via Hexabrix and PTA staining for a scaffold that was cultured for 21 days under a flow rate of 0.04 mL/min.

References

    1. Eniwumide J.O., Yuan H., Cartmell S.H., Meijer G.J., and de Bruijn J.D.Ectopic bone formation in bone marrow stem cell seeded calcium phosphate scaffolds as compared to autograft and (cell seeded) allograft. Eur Cell Mater 14,30.; discussion 9.2007 - PubMed
    1. Hedberg E.L., Kroese-Deutman H.C., Shih C.K., Lemoine J.J., Liebschner M.A.K., Miller M.J., et al. . Methods: a comparative analysis of radiography, microcomputed tomography, and histology for bone tissue engineering. Tissue Eng 11,1356, 2005 - PubMed
    1. Stephens J.S., Cooper J.A., Phelan F.R., and Dunkers J.P.Perfusion flow bioreactor for 3D in situ imaging: investigating cell/biomaterials interactions. Biotechnol Bioeng 97,952, 2007 - PubMed
    1. Smith L.E., Smallwood R., and Macneil S.A comparison of imaging methodologies for 3D tissue engineering. Microsc Res Tech 73,1123, 2010 - PubMed
    1. Georgakoudi I., Rice W.L., Hronik-Tupaj M., and Kaplan D.L.Optical spectroscopy and imaging for the noninvasive evaluation of engineered tissues. Tissue Eng Part B Rev 14,321, 2008 - PMC - PubMed

Publication types