. 2013 Jun 21:14:203.
doi: 10.1186/1471-2105-14-203.

Prediction of gene-phenotype associations in humans, mice, and plants using phenologs

Affiliations

Prediction of gene-phenotype associations in humans, mice, and plants using phenologs

John O Woods et al. BMC Bioinformatics. .

Abstract

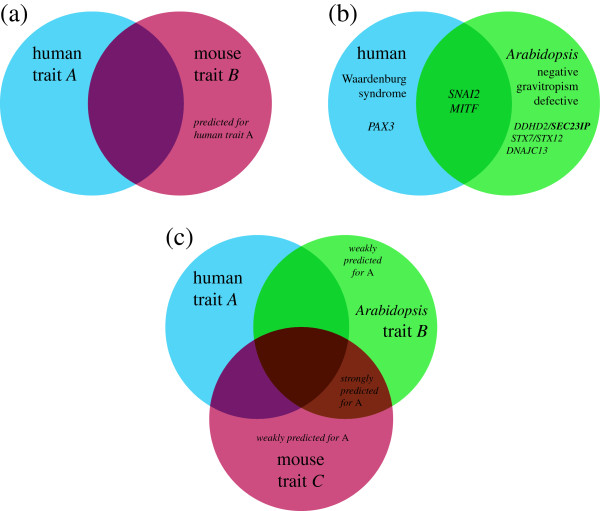
Background: Phenotypes and diseases may be related to seemingly dissimilar phenotypes in other species by means of the orthology of underlying genes. Such "orthologous phenotypes," or "phenologs," are examples of deep homology, and may be used to predict additional candidate disease genes.

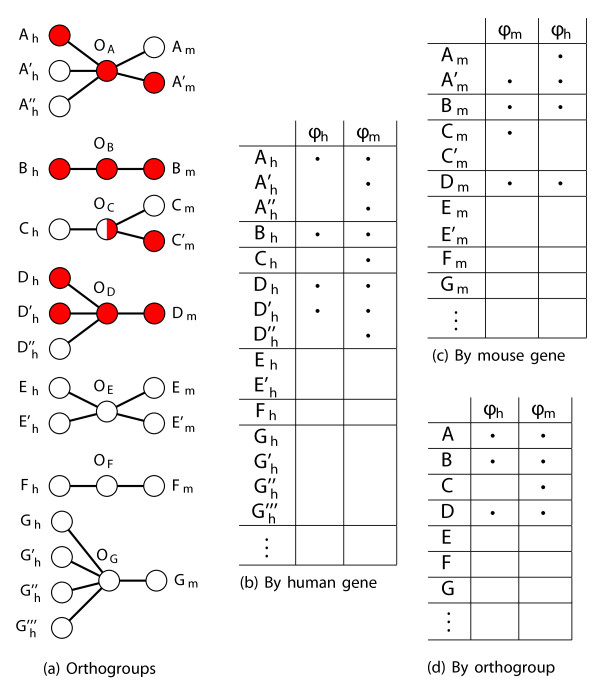
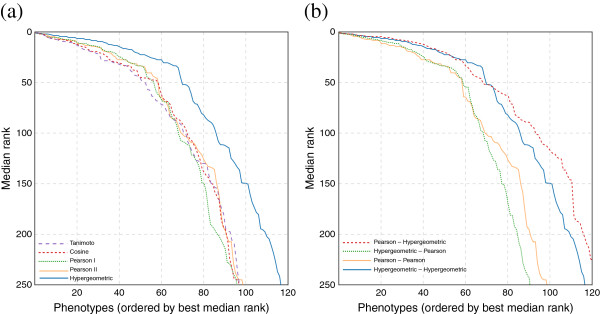
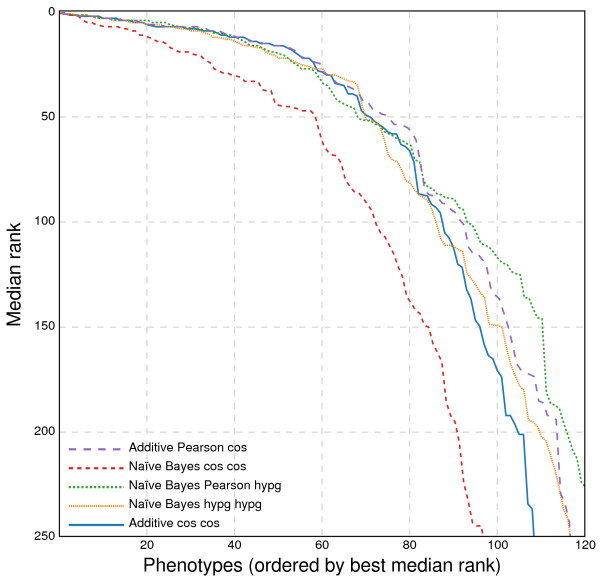
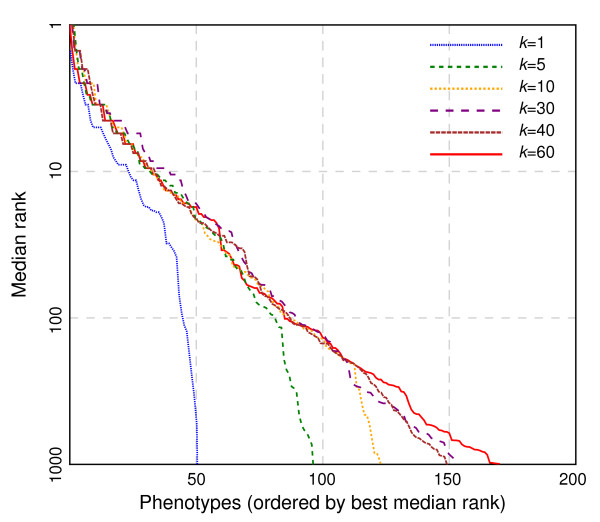
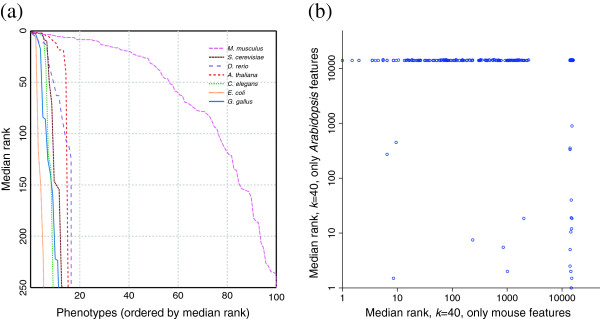
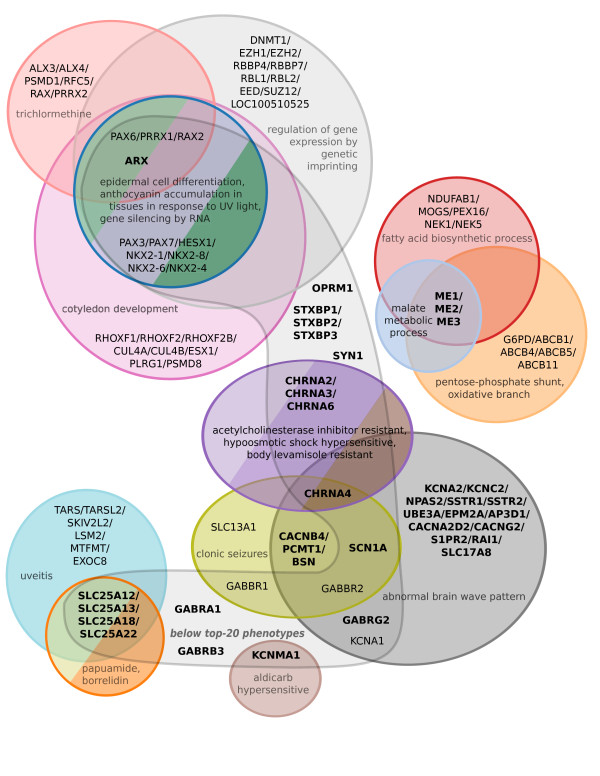
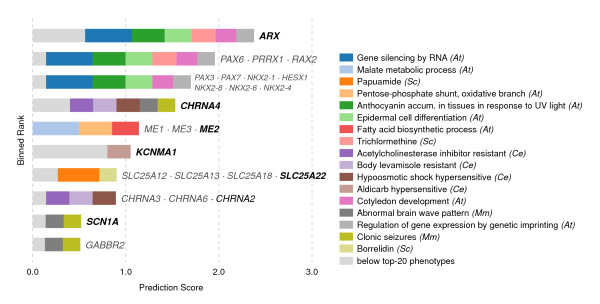
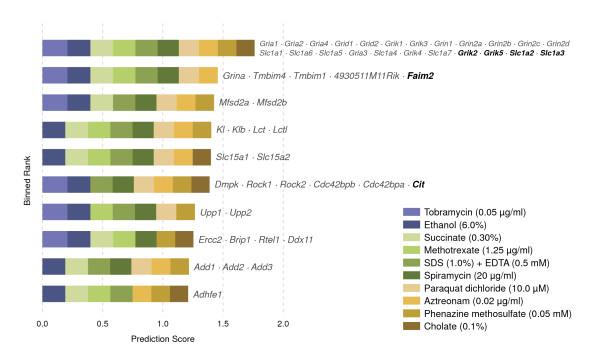
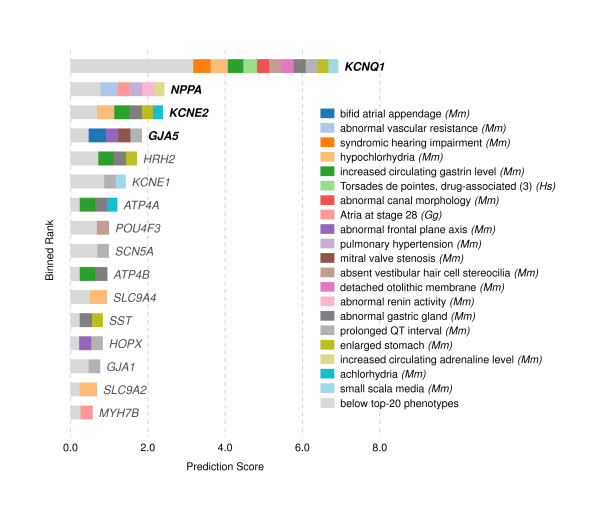
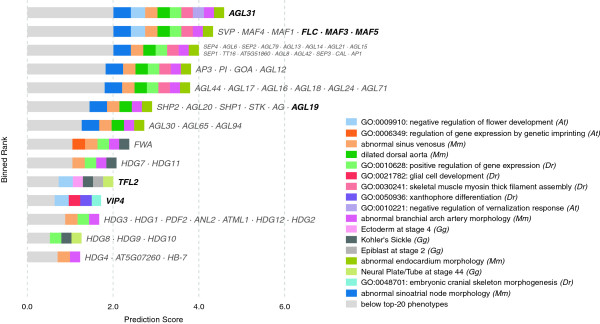
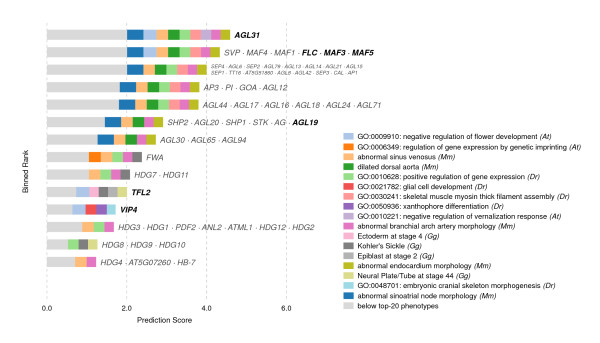
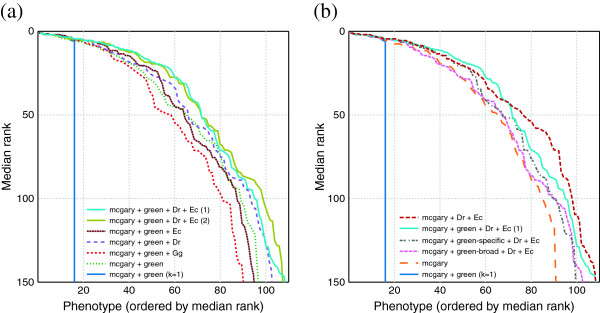
Results: In this work, we develop an unsupervised algorithm for ranking phenolog-based candidate disease genes through the integration of predictions from the k nearest neighbor phenologs, comparing classifiers and weighting functions by cross-validation. We also improve upon the original method by extending the theory to paralogous phenotypes. Our algorithm makes use of additional phenotype data--from chicken, zebrafish, and E. coli, as well as new datasets for C. elegans--establishing that several types of annotations may be treated as phenotypes. We demonstrate the use of our algorithm to predict novel candidate genes for human atrial fibrillation (such as HRH2, ATP4A, ATP4B, and HOPX) and epilepsy (e.g., PAX6 and NKX2-1). We suggest gene candidates for pharmacologically-induced seizures in mouse, solely based on orthologous phenotypes from E. coli. We also explore the prediction of plant gene-phenotype associations, as for the Arabidopsis response to vernalization phenotype.

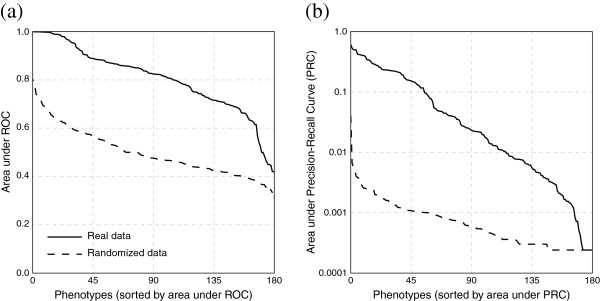
Conclusions: We are able to rank gene predictions for a significant portion of the diseases in the Online Mendelian Inheritance in Man database. Additionally, our method suggests candidate genes for mammalian seizures based only on bacterial phenotypes and gene orthology. We demonstrate that phenotype information may come from diverse sources, including drug sensitivities, gene ontology biological processes, and in situ hybridization annotations. Finally, we offer testable candidates for a variety of human diseases, plant traits, and other classes of phenotypes across a wide array of species.


Figures

Figure 1
Figure 1
Prediction of disease–genes from orthologous phenotypes. (a) Two phenotypes are said to be orthologous (“phenologs”) if the sets of underlying genes for those phenotypes have a statistically significant intersection, as determined using gene orthology. Statistical significance is calculated as the probability of seeing an intersection of v or greater given m genes with phenotype A and n with phenotype B, out of N total genes with orthologs in both species. Genes associated with A but not B are said to be predicted to be involved with B, and vice-versa. McGary et al. observed that approximately v/m of the predictions tended to be true positives for B, and v/n to be true positives for A. (b) illustrates a validated example from McGary et al. predicting genes involved in a human neural crest defect, Waardenburg syndrome, using the Arabidopsis negative gravitropism defect phenotype. In this example, the overlap between gene sets affiliated with Waardenburg and gravitropism is highly statistically significant (p≤10−6). In the right-hand circle and intersection, the human orthologs of the gravitropism genes are shown, for simplicity (VAM3 corresponding to STX7, STX12; SGR2 to DDHD2, SEC23IP; and GRV2 to DNAJC13). (c) In this paper, we extend the phenolog formalism to consider additional gene–phenotype associations from multiple model organisms to develop a quantitative ranking scheme for phenolog-based predictions. Those genes predicted by a single phenolog, as in (a), are weakly predicted for A; whereas those predicted by two phenologs are strongly predicted for A. In general, the addition of a third phenolog contributing to a predicted association will cause that gene to be ranked higher than if only two phenologs predict it. However, not all phenologs are equal; phenologs derived from less similar gene sets exert less influence over predictions than phenotypes with highly overlapping sets of affiliated genes.
Figure 2
Figure 2
The matrix formalism for calculating phenolog overlaps is especially important when predicting between species where large gene family expansions have occurred since species divergence, such as between Arabidopsis and humans. The example uses human and mouse to illustrate the orthogroup-based matrix formalism. (a) Phenotype associations (colors) are plotted as graphs for genes from human (left nodes, subscripted h) and mouse (right nodes, subscripted m), showing genes’ orthology relationships (edges radiating from orthogroups — middle nodes, labeled O). The orthologies (from INPARANOID), are used to “translate” phenotype associations between species (in the case of the gene-based matrix framework in panels (b, c)) or into an intermediate collection of orthogroup–phenotype associations (for the orthogroup-based matrix framework in (d)). Orthogroup vertices (e.g., OA) connect human and mouse orthologs (such as Ah, Ah′, and Ah″, which are paralogs of one another relative to the human–mouse divergence, with Am and Am′. Red vertices within a species are genes associated with the phenotype of interest (ϕh for human and ϕm for the mouse phenotype); orthogroup colors reflect the species data. These associations can alternately be captured by representing the graphs as matrices (b–d), with bullets indicating an assocation between a given genetic element and a phenotype. Specifically, (b) and (c) represent the gene-based formalism, and (d) illustrates the orthogroup-based formalism. Human and mouse phenotype columns are indicated by ϕh and ϕm, respectively.
Figure 3
Figure 3
Effect of distance measure choice for ordering and weighting phenotypes. Here we plot for how many diseases the median rank of the gene withheld during leave-one-out cross-validation stays at a certain level, using all available species, and integrating the results using the naïve Bayes scheme. In (a), we vary the distance and weighting function (using the same measure for both). In (b), we show the effect of varying the distance function independently from the weighting function. Here the first function in the legend is the distance function used for computing the k nearest neighbors, and the second is the weighting function wij from Equations 1 and 4. As can be seen from the figure, a good distance function has more effect on performance than a good weighting function, but that the results can be improved slightly by using a combination: hypergeometric for distance, and Pearson for integration.
Figure 4
Figure 4
Predictive performance of the orthogroup-based matrix approach. Here we show a comparison of naïve Bayes and additive classifier predictions, which seem to have similar performance, using leave-one-out cross-validation. As in Figure 3B, the first function in the legend is the distance function used for computing the k nearest neighbors, and the second is the weighting function wij from Equations 1 and 4.
Figure 5
Figure 5
Effect of k on predictiveness. Using the same cross-validation setup as in Figure 4, we compare different k-values in the neighborhood search for phenologs. Any k greater than 1 gives a great improvement in the high-precision regime. However, as k increases further, the improvements in the recovery affect successively less important ranks, with diminishing returns as k approaches 30.
Figure 6
Figure 6
Contributions by individual species to the prioritization of candidate genes. (a) Each phenotype offers some sort of information for prediction of human disease genes. Mouse data seem to offer the most information about human diseases, as one would expect from the quality of the data and the proximity of the species in the phylogenetic tree. Arabidopsis, which is the furthest species from human in our database, unexpectedly provides as much information as mouse on top predictions, and is second at higher ranks. (b) This scatter plot demonstrates that the information offered by each species (in this case mouse and Arabidopsis) is highly independent, and suggests that integrating data from multiple species may be useful.
Figure 7
Figure 7
Phenologs predict candidate genes substantially better than random. Shown are (a) ROC and (b) precision–recall plots for k=100 naïve Bayes using the hypergeometric weighting function, predicting human (OMIM) gene–disease associations from human, mouse, worm, fruit fly, yeast, and plant gene–phenotype association data. We restrict the evaluation to only those phenotypes with four or more known genes. The solid line shows the actual data, and the dashed line shows the result on similarly sized random gene sets. Thus, integrating phenologs across multiple species successfully prioritizes candidate genes to an extent far greater than random chance.
Figure 8
Figure 8
A Venn diagram showing predictions for epilepsy based on the 40 most genetically similar phenotypes. The analysis is primarily derived from Arabidopsis, yeast, worm, and mouse, based on the Pearson sample correlation, and using cosine similarity as the weighting function. The twenty closest phenotypes are each displayed separately, and the remaining twenty are aggregated into the category “below top-20 phenotypes.” Paralogs are grouped together when they coincide at a prediction score. Genes in bold represent the orthogroups used in the search — that is, those groups of orthologous genes where one or more paralog was already associated with epilepsy in our database. Colors correspond to those in Figure 9.
Figure 9
Figure 9
Top candidate genes predicted for epilepsy. Each row of this chart represents a set of genes predicted with the same score. If a gene symbol is printed in bold, it or a member of its orthogroup is already known to be involved. Rows with plain-text labels are novel predictions. The depicted search makes predictions based on the k=40 nearest neighbor phenotypes (from human, mouse, chicken, zebrafish, worm, yeast, and plant), and color codes the twenty nearest neighbor phenotypes’ contributions to each prediction (the remaining twenty-one are grouped in blue, as “below top-20 phenotypes”). The top scoring gene, ARX, is predicted primarily by Proud syndrome, hydranencephaly, and Partington’s syndrome, all of which are human diseases characterized partially by seizures; but information is also drawn from a variety of plant phenotypes. These predictions were generated using an additive classifier for ease of visualization. The distance function is Pearson sample correlation, using cosine similarity as the weighting function w.
Figure 10
Figure 10
Predicting mouse seizure genes from E. coli phenotypes. These mouse phenotype predictions are constructed from the k=10 nearest neighbor E. coli phenotypes, using no other species. Predicting eukaryotic phenotype-linked genes from a prokaryote is necessarily coarse-grained, due firstly to evolutionary expansions of ancestral orthologs into larger orthogroups, and secondly to the tendency for some orthologs to vanish from certain species or become unrecognizable. Nevertheless, the probability of seeing an intersection of six or more orthogroups by chance, such as that between sensitivity to tobramycin at 0.05 μg/ml and the seizure phenotype, is 1.7×10⁻⁴ (without correction for multiple testing).
Figure 11
Figure 11
The top candidate genes predicted for atrial fibrillation. These predictions are constructed in the same manner as those in Figure 9. Limiting the search to k=40 neighbors in this case means that all predictive phenotypes come from mouse and chicken, though other species were included in the analysis. Interestingly, few of the informative mouse and chicken phenotypes are related to the heart in any obvious manner.
Figure 12
Figure 12
Predicting performance of phenologs for plant phenotypes. This figure mirrors Figure 6A, but demonstrates the prediction of Arabidopsis phenotypes from individual species (rather than human diseases from individual species). The red solid line shows the combined performance of predictions using all species except Arabidopsis. Yeast appears to be the most useful individual species for predicting plant phenotypes.
Figure 13
Figure 13
The top candidate genes predicted for Arabidopsis response to vernalization. Here, we demonstrate predictions for a plant phenotype, response to vernalization, while also demonstrating how including paralogous phenotypes may slightly enhance resolution. These predictions are drawn from phenotype data from each species in the database, with a neighborhood cutoff of k=40. Due to the large gene expansions in plants, as well as the relatively large distance of Arabidopsis from other species in our database, paralogs are often ranked together. In the first two bins, a large gene expansion is split into separate ranks by information from an Arabidopsis phenotype (which is paralogous rather than orthologous). Those ranks labeled with green text include at least one previously known vernalization response gene (that is, a gene that was already linked with vernalization response in our database).
Figure 14
Figure 14
Measuring the effect of additional datasets on predictive performance. Here, we used our best classifier (naïve Bayes with Pearson sample correlation for a distance function, weighted by hypergeometric CDF), and subtract out datasets in order to determine their relative contributions. Unless otherwise indicated, classifiers were run with k=40. (a) demonstrates that for the original species used by McGary et al. (also including the new phenotypes from Green et al.), the k nearest neighbors method performs substantially better from the original Phenologs method (approximated by k=1). The datasets are labeled mcgary (mouse, worm, nematode, yeast, and plant), green (nematode), Dr for zebrafish, Ec for E. coli, and Gg for chicken. The best-performing analysis was repeated (labeled “(1)” and “(2)”, with different random test genes withheld) to demonstrate that performance is robust under cross-validation. (b) presents a test of whether specific phenotypes are more useful than broad phenotypes, by breaking down the green dataset into its components, green–specific and green–broad. We found that including both green datasets yielded the best results at relevant ranks, but that they both hurt results at less relevant ranks (beyond 45). Also shown is a comparison between the original datasets (mcgary alone) and the best-performing collection from (a), with all datasets except chicken (represented by the solid cyan line).

References

    1. Karr JR, Sanghvi JC, Macklin DN, Gutschow MV. et al.A whole-cell computational model predicts phenotype from genotype. Cell. 2012;150(2):389–401. doi: 10.1016/j.cell.2012.05.044. - DOI - PMC - PubMed
    1. Varma A, Palsson BO. Metabolic flux balancing: basic concepts, scientific and practical use. Nat Biotechnol. 1994;12:994–998. doi: 10.1038/nbt1094-994. - DOI
    1. Covert MW, Schilling CH, Palsson B. Regulation of gene expression in flux balance models of metabolism. J Theor Biol. 2001;213:73–88. doi: 10.1006/jtbi.2001.2405. [ http://www.ncbi.nlm.nih.gov/pubmed/11708855] - DOI - PubMed
    1. Covert M, Knight E, Reed J, Herrgard M, Palsson B. Integrating high-throughput and computational data elucidates bacterial networks. Nature. 2004;429(May):92–96. [ http://www.nature.com/nature/journal/v429/n6987/abs/nature02456.html] - PubMed
    1. Covert MW, Xiao N, Chen TJ, Karr JR. Integrating metabolic, transcriptional regulatory and signal transduction models in Escherichia coli. Bioinformatics (Oxford, England) 2008;24(18):2044–2050. doi: 10.1093/bioinformatics/btn352. [ http://www.ncbi.nlm.nih.gov/pubmed/18621757] - DOI - PMC - PubMed

Publication types

LinkOut - more resources