. 2013 Oct;64(1):404-12.
doi: 10.1016/j.cyto.2013.05.010. Epub 2013 Jun 22.

The IL17A and IL17F loci have divergent histone modifications and are differentially regulated by prostaglandin E2 in Th17 cells

Affiliations

The IL17A and IL17F loci have divergent histone modifications and are differentially regulated by prostaglandin E2 in Th17 cells

Juraj Adamik et al. Cytokine. 2013 Oct.

Abstract

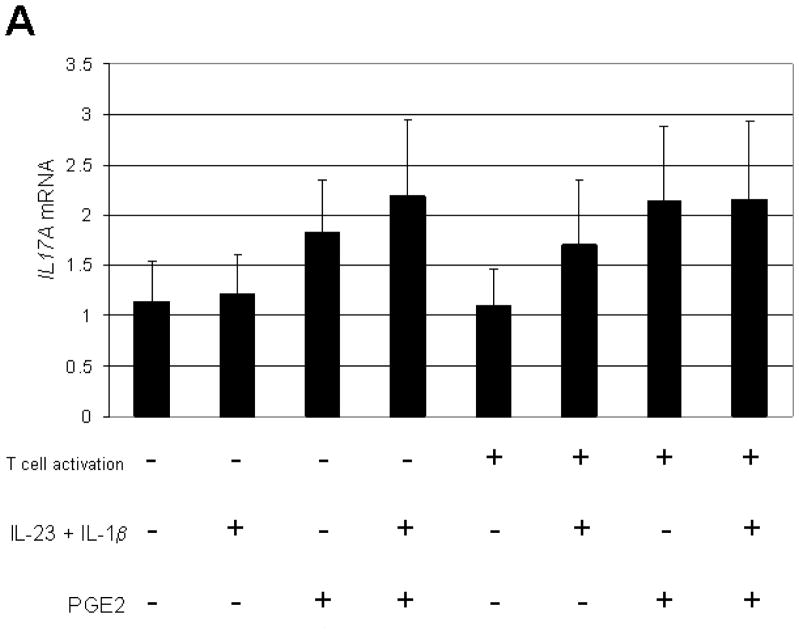
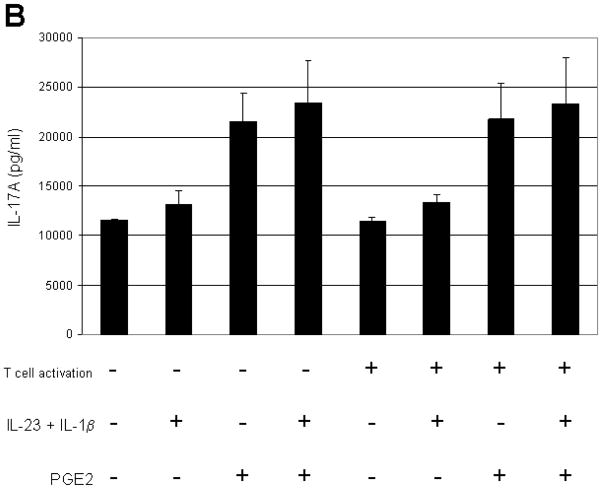
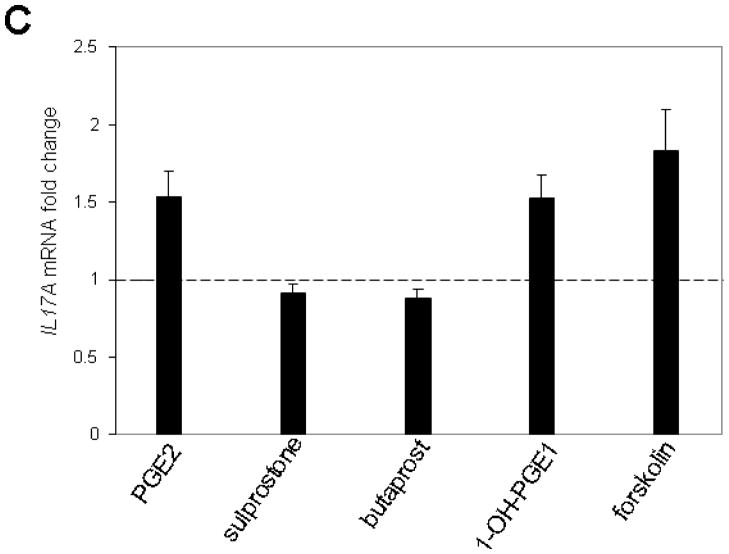
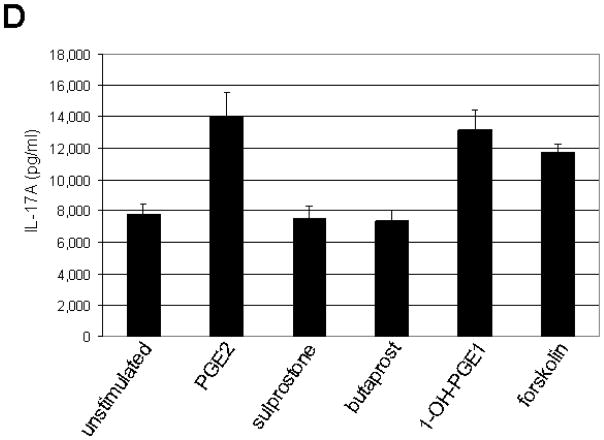
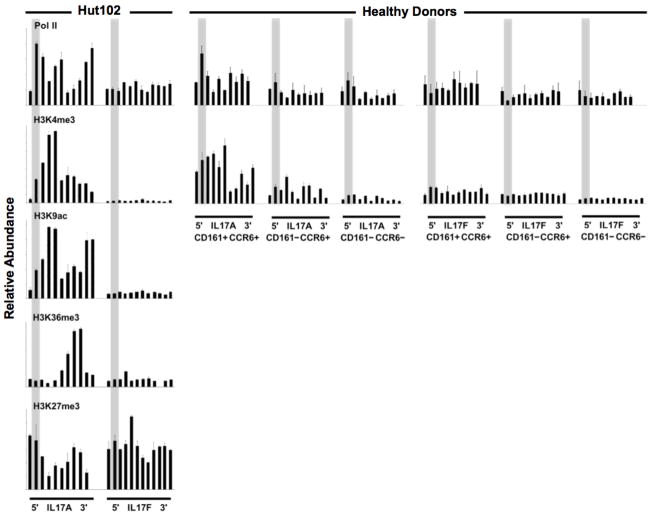
Prostaglandin E2 (PGE2), IL-23 and IL-1β are implicated in inflammatory bowel disease susceptibility, likely in part by modulating IL-17 producing CD4(+) T helper (Th17) cells. To better understand how these three mediators affect Th17 cell memory responses, we characterized the gene expression profiles of activated human peripheral CD4(+) effector memory T cells and sorted Th17 memory cells from healthy donors concurrent with IL17A mRNA induction mediated by PGE2 and/or IL-23 plus IL-1β. We discovered that PGE2 and IL-23 plus IL-1β differentially regulate Th17 cytokine expression and synergize to induce IL-17A, but not IL-17F. IL-23 plus IL-1β preferentially induce IL-17F expression. The addition of PGE2 to IL-23 plus IL-1β only enhances IL-17A expression as mediated by the PGE2 EP4 receptor, and promotes a switch from an IL-17F to an IL-17A predominant immune response. The human Th17 HuT-102 cell line was also found to constitutively express IL-17A, but not IL-17F. We went on to show that the IL17A and IL17F loci have divergent epigenetic architectures in unstimulated HuT-102 and primary Th17 cells and are poised for preferential expression of IL17A. We conclude that the chromatin for IL17A and IL17F are distinctly regulated, which may play an important role in mucosal health and disease.

Keywords: 1-OH-PGE1; 1-hydroxy prostaglandin E1; C(T); ChIP; Chromatin; E prostanoid; EP; GWAS; IBD; IL-17A; IL-17F; PGE2; Prostaglandin E2; T helper; Th; Th17; chromatin immunoprecipitation; genome wide association studies; inflammatory bowel disease; prostaglandin E2; threshold cycle.


Figures

Figure 1
Figure 1. PGE2 promotes an IL-17A predominant immune response
Human peripheral CD4+ effector memory T cells from healthy donors were cultured for 24 hours in serum free medium with T cell activation beads alone or in combination with PGE2 and/or IL-23 plus IL-1β. IL-17A, IL-17F, IL-17AF were measured in the culture supernatants via ELISA. The box plots depict the median, lower quartile, and upper quartile of 9 donors, as indicated by the horizontal line in the box, and the lower and upper edges of the box. The lower and upper whiskers represent the minimum and maximum of the data within 1.5 ×IQR. Outliers are displayed by dots. Statistically significant differences between treatment groups are denoted by *, P<0.05.
Figure 2
Figure 2. The PGE2 EP4 receptor mediates the differential regulation of IL17A and IL17F mRNA expression by PGE2
Human peripheral CD4+ effector memory T cells from healthy donors were cultured for 6 hours in serum free medium with T cell activation beads alone or in combination with PGE2, sulprostone (EP1/EP3 receptor agonist), butaprost (EP2 receptor agonist), or 1-OH-PGE1 (EP4 receptor agonist). IL17A and IL17F mRNA expression were measured compared to the B2M internal control gene by real-time qPCR using the comparative CT method. The plot depicts individual donor fold change in IL17A and IL17F mRNA expression compared to T cell activation alone of five donors.
Figure 3
Figure 3. PGE2-EP4 receptor-cAMP signaling pathway amplifies IL-17A expression in HuT-102 cells
(A and B) HuT-102 cells were cultured in serum free medium alone (unstimulated) or in combination with T cell activation beads, PGE2, and/or IL-23 plus IL-1β. (A) IL17A mRNA expression was measured at 6 hours and compared to the HPRT internal control gene by real-time qPCR using the comparative CT method. The graph depicts the mean levels of IL17A mRNA, as defined by 2−ΔCT, +/− SEM of three independent experiments. (B) IL-17A was measured in cell culture supernatants at 24 hours via ELISA. The graph depicts the mean protein levels +/− SEM of three independent experiments. (C and D) HuT-102 cells were cultured in serum free medium alone (unstimulated) or in combination with either PGE2, sulprostone (EP1/EP3 receptor agonist), butaprost (EP2 receptor agonist), 1-OH-PGE1 (EP4 receptor agonist), or forskolin (cAMP activator). (A) IL17A mRNA expression was measured at 6 hours and compared to the HPRT. The graph depicts the mean fold change in mRNA expression compared to unstimulated cells +/− SEM of three independent experiments. (D) IL-17A was measured in cell culture supernatants at 24 hours. The graph depicts the mean protein levels +/− SEM of three independent experiments.
Figure 4
Figure 4. PGE2 and IL-23 plus IL-1β differentially regulate IL17A and IL17F mRNA expression in primary human Th17 cells
Human CD4+CD45RO+ T cells were purified from enriched peripheral Th effector memory cells and sorted based on the cell surface expression of CD161 and CCR6. The cells were cultured in serum free medium with T cell activation beads alone or in combination with PGE2 and/or IL-23 plus IL-1β. IL17A (A) and IL17F (B) mRNA expression were measured at 6 hours and compared to the B2M internal control gene by real-time qPCR using the comparative CT method. The graphs depict the mean mRNA levels, as defined by 2−ΔCT, in the four cell populations of two representative healthy blood donors.
Figure 5
Figure 5. ChIP analysis of IL17A and IL17F in HuT-102 and primary human Th17 cells
(A) Positional enrichment profiles along the length of the IL17A and IL17F genes for Pol II, H3K4me3, H3K9ac, H3K36me3, and H3K27me3 are presented for cell samples, as indicated. Histograms correspond to the relative antibody enrichment for specific qPCR amplicon. Several amplicons spanning the length of each gene were designed, in order to generate the positional enrichment profile for Pol II and modified nucleosomes. For comparison purposes, gray bars locate promoter positions within each gene. (B) Schematic representation of the ChIP-qPCR amplicons (black squares) spanning the human IL17A and IL17F loci relative to locations of the previously reported conserved non-coding sequence (CNS) sites (gray columns). Arrows above IL17A and IL17F denote the direction of transcription.

References

    1. Cho JH. The genetics and immunopathogenesis of inflammatory bowel disease. Nat Rev Immunol. 2008;8:458–66. - PubMed
    1. Yen D, Cheung J, Scheerens H, Poulet F, McClanahan T, McKenzie B, Kleinschek MA, Owyang A, Mattson J, Blumenschein W, Murphy E, Sathe M, Cua DJ, Kastelein RA, Rennick D. IL-23 is essential for T cell-mediated colitis and promotes inflammation via IL-17 and IL-6. J Clin Invest. 2006;116:1310–6. - PMC - PubMed
    1. Annunziato F, Cosmi L, Santarlasci V, Maggi L, Liotta F, Mazzinghi B, Parente E, Fili L, Ferri S, Frosali F, Giudici F, Romagnani P, Parronchi P, Tonelli F, Maggi E, Romagnani S. Phenotypic and functional features of human Th17 cells. J Exp Med. 2007;204:1849–61. - PMC - PubMed
    1. Iwakura Y, Ishigame H, Saijo S, Nakae S. Functional specialization of interleukin-17 family members. Immunity. 2011;34:149–62. - PubMed
    1. O’Connor W, Jr, Kamanaka M, Booth CJ, Town T, Nakae S, Iwakura Y, Kolls JK, Flavell RA. A protective function for interleukin 17A in T cell-mediated intestinal inflammation. Nat Immunol. 2009;10:603–9. - PMC - PubMed

Publication types

LinkOut - more resources