. 2013 Jun;25(6):2115-31.
doi: 10.1105/tpc.113.113068. Epub 2013 Jun 25.

Salt-responsive ERF1 regulates reactive oxygen species-dependent signaling during the initial response to salt stress in rice

Affiliations

Salt-responsive ERF1 regulates reactive oxygen species-dependent signaling during the initial response to salt stress in rice

Romy Schmidt et al. Plant Cell. 2013 Jun.

Abstract

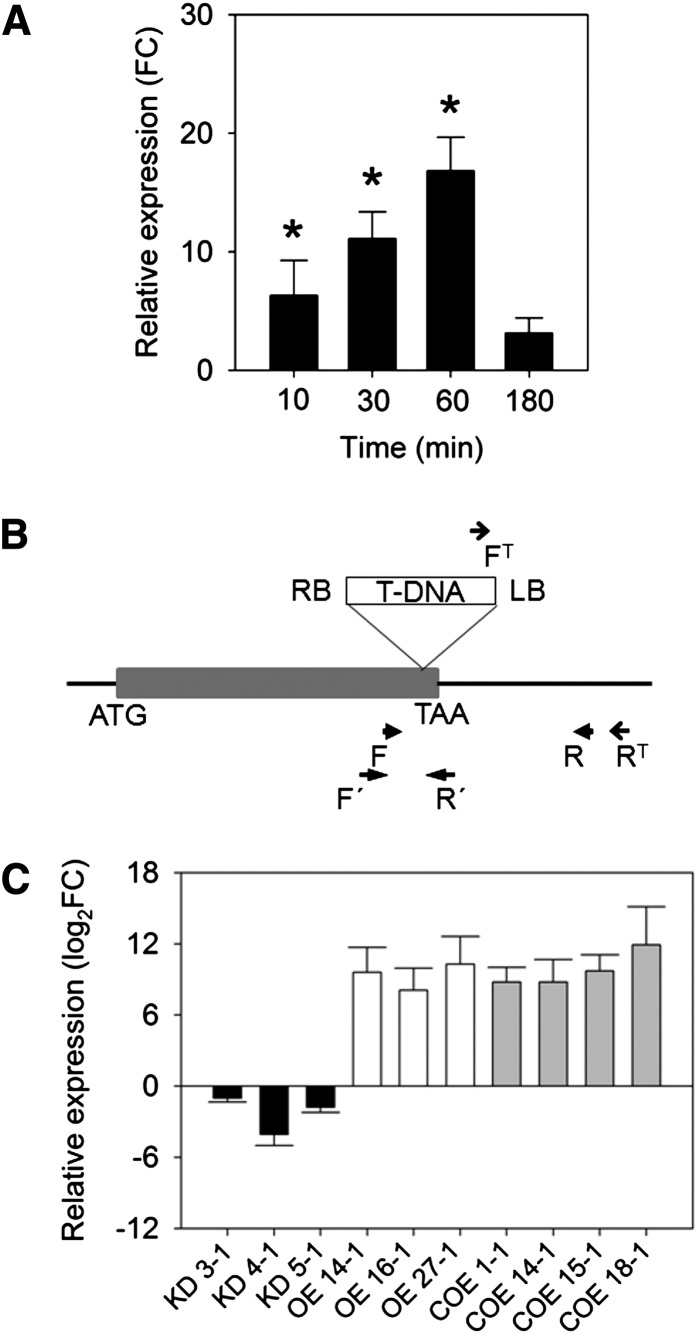
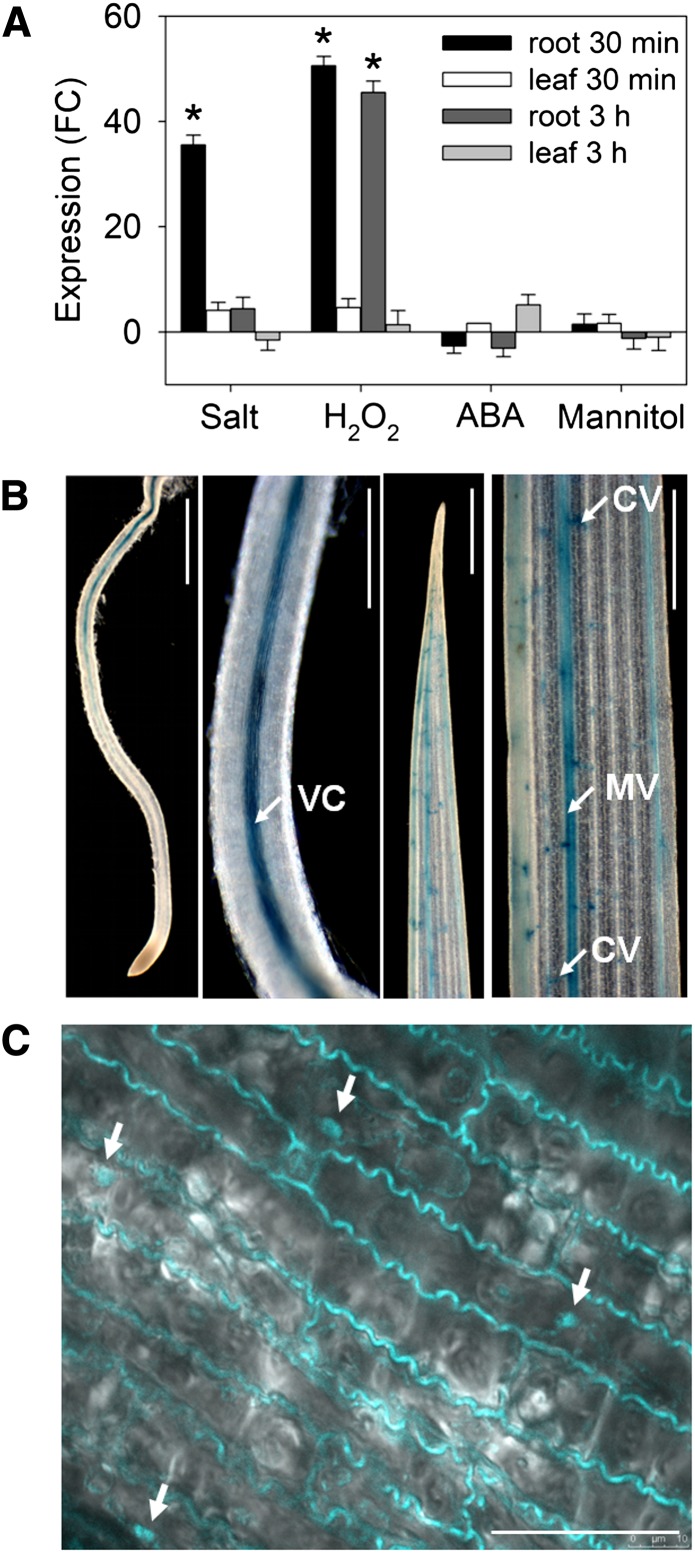
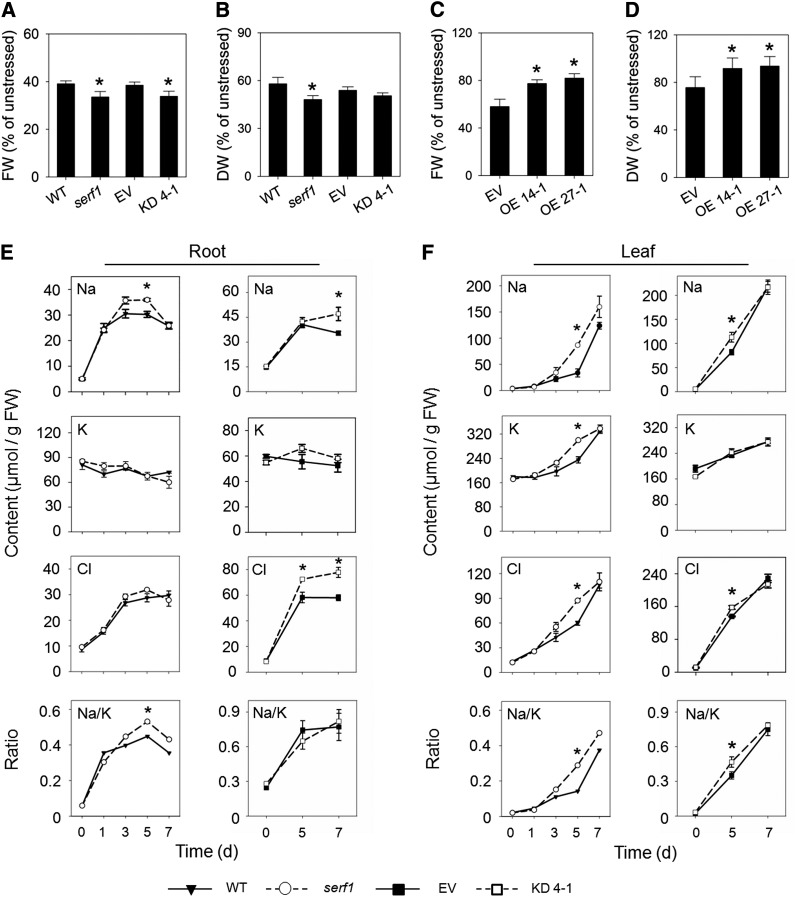
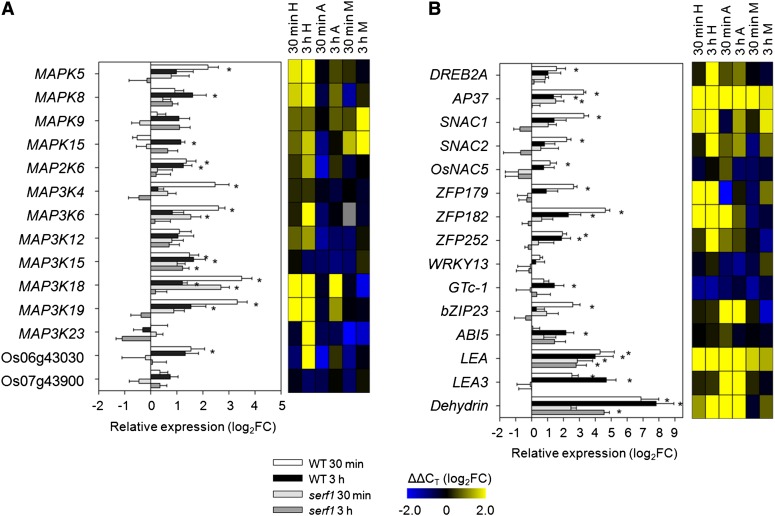
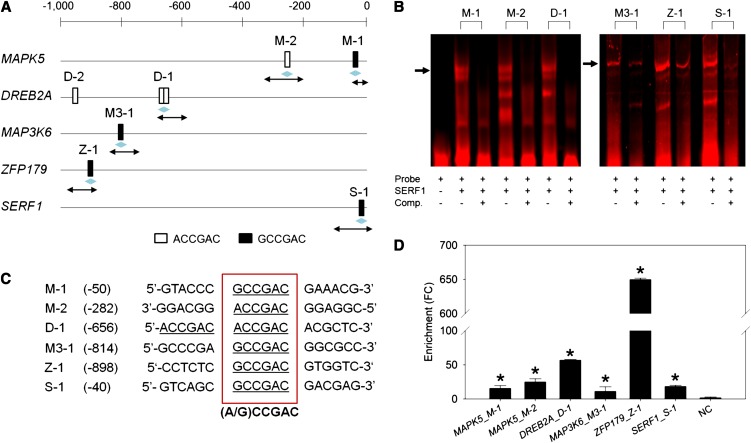
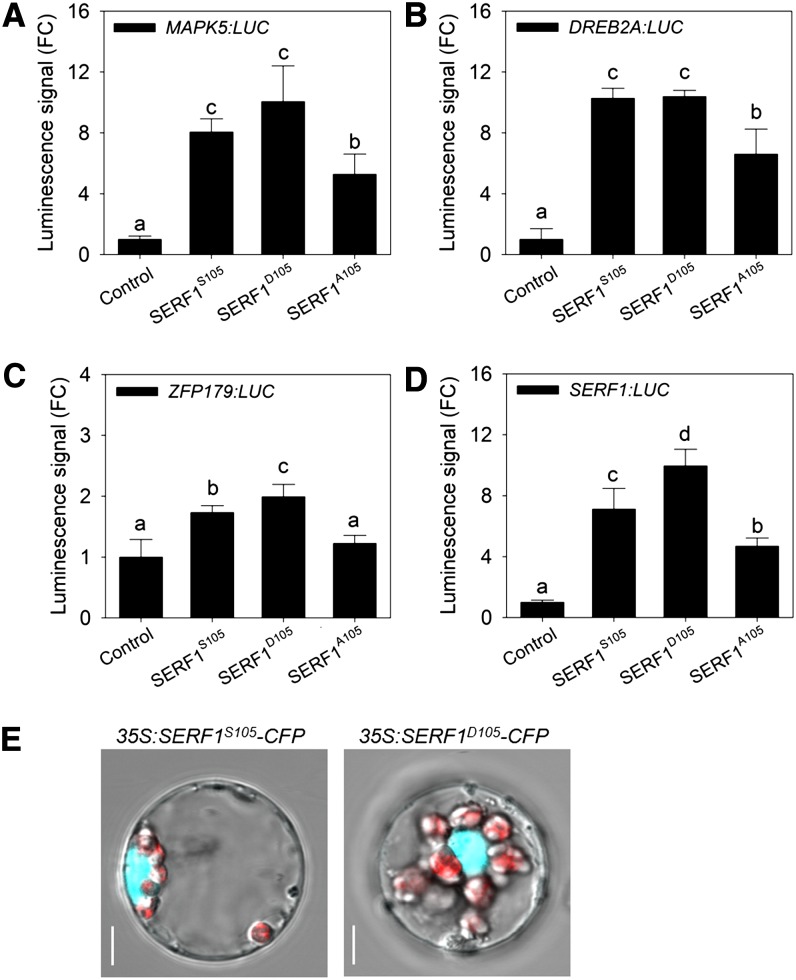
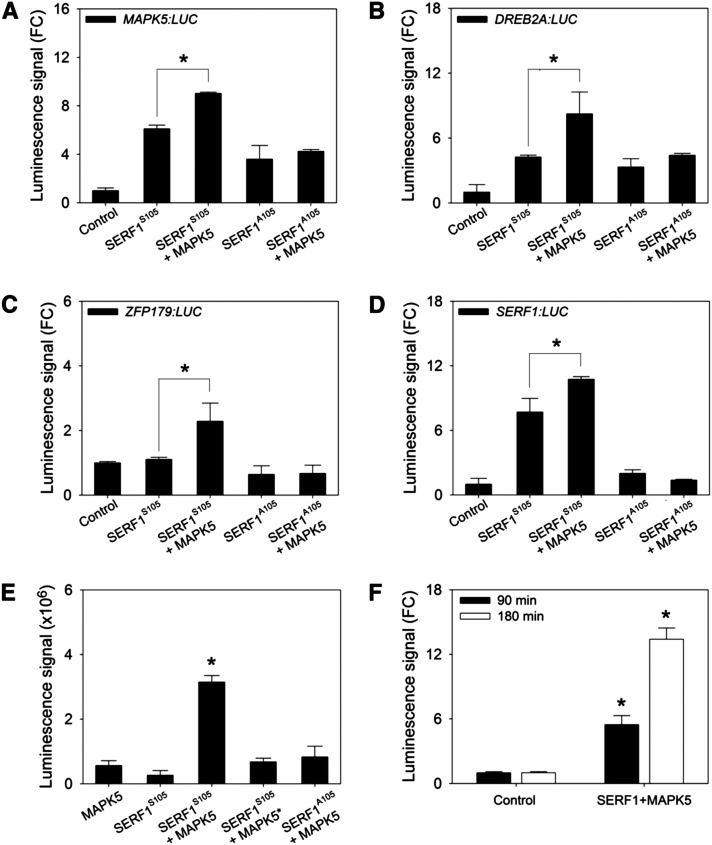
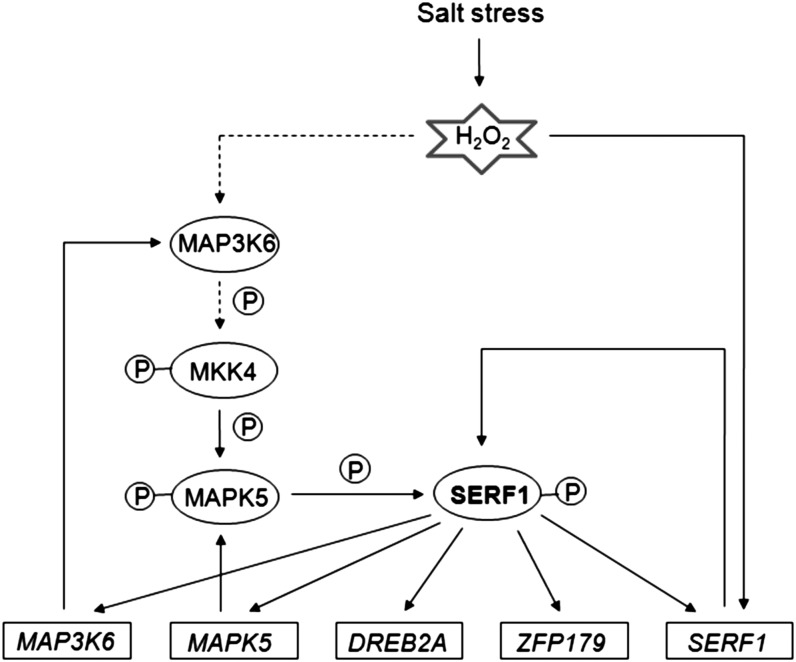
Early detection of salt stress is vital for plant survival and growth. Still, the molecular processes controlling early salt stress perception and signaling are not fully understood. Here, we identified salt-responsive ERF1 (SERF1), a rice (Oryza sativa) transcription factor (TF) gene that shows a root-specific induction upon salt and hydrogen peroxide (H2O2) treatment. Loss of SERF1 impairs the salt-inducible expression of genes encoding members of a mitogen-activated protein kinase (MAPK) cascade and salt tolerance-mediating TFs. Furthermore, we show that SERF1-dependent genes are H2O2 responsive and demonstrate that SERF1 binds to the promoters of MAPK kinase kinase6 (MAP3K6), MAPK5, dehydration-responsive element bindinG2A (DREB2A), and zinc finger protein179 (ZFP179) in vitro and in vivo. SERF1 also directly induces its own gene expression. In addition, SERF1 is a phosphorylation target of MAPK5, resulting in enhanced transcriptional activity of SERF1 toward its direct target genes. In agreement, plants deficient for SERF1 are more sensitive to salt stress compared with the wild type, while constitutive overexpression of SERF1 improves salinity tolerance. We propose that SERF1 amplifies the reactive oxygen species-activated MAPK cascade signal during the initial phase of salt stress and translates the salt-induced signal into an appropriate expressional response resulting in salt tolerance.


Figures

Figure 1.
Figure 1.
Identification of SERF1 and Isolation of Transgenic Lines. (A) Relative root mRNA levels of SERF1 following stress treatment. Four-week-old wild-type plants were treated with 100 mM NaCl for 10, 30, 60, or 180 min. Data represent means ± se from three independent biological replicates, and an asterisk indicates a significant difference between treated and control samples harvested at the same time points (P ≤ 0.05). FC, fold increase over controls. (B) Insertion site of T-DNA (serf1; AHHA04) in the coding region (gray box) of SERF1. Arrowheads (F and R) and arrows (FT and RT) represent positions of gene-specific primers and primers used for detection of the mutant allele. Closed arrowheads (F' and R') represent positions of qRT-PCR primers used for SERF1 expression analysis. (C) Validation of established SERF1 knockdown (KD; black bars; T2 generation), Ubi:SERF1 overexpression (OE; white bars; T0 generation), and 35S:SERF1-CFP constitutive overexpression (COE; gray bars; T0 generation) lines by qRT-PCR analysis on roots. Data represent means ± se from three independent biological replicates.
Figure 2.
Figure 2.
SERF1 Is Specifically Induced by Salt Stress and H2O2 Treatment and Is Expressed in the Vascular Tissues of Roots and Leaves. (A) Expression of SERF1 (fold change) in wild-type roots and leaves after exposure to salt stress (100 mM NaCl), ABA (5 µM), mannitol (100 mM), or H2O2 (5 mM) for 30 min or 3 h relative to mock-treated control plants. Data are means ± se of three independent biological replicates, and an asterisk indicates a significant difference (P ≤ 0.05) from mock-treated roots. FC, fold change. (B) Staining of mock-treated SERF1:GUS plants revealed GUS activity (blue) in the vascular cylinder (VC) of roots, main veins (MV), and commissural veins (CV) of leaves. Bars from left to right: 2 mm, 500 µm, 2 mm, and 500 µm. (C) Nuclear (white arrows) and cytoplasmic localization of SERF1-CFP in rice leaf epidermal cells. Bar = 25 µm.
Figure 3.
Figure 3.
Effect of SERF1 on Biomass Reduction and Ion Accumulation under Long-Term Salt Stress. (A) to (D) Growth inhibition of shoots of 3-week-old plants after 7 d of salinity stress (100 mM NaCl). Relative shoot FW (A) and DW (B) of salt-stressed wild type (WT), serf1, EV, and SERF1 knockdown (KD 4-1) plants compared with mock-treated plants. Relative shoot FW (C) and DW (D) of salt-stressed EV and SERF1 overexpression (OE 14-1 and OE 27-1) plants compared with mock-treated plants. Data in (A) to (D) represent means ± sd from five independent biological replicates (six plants each), and an asterisk indicates a significant difference in relative growth inhibition between serf1, SERF1 knockdown (KD 4-1), SERF1 overexpression lines (OE 14-1 and OE 27-1), and their respective controls (P ≤ 0.05). (E) and (F) Ion content in root (E) and leaf tissue (F) of 4-week-old wild type, serf1, EV, and KD 4-1 plants exposed to salt stress (50 mM NaCl) for 7 d. Day 0 represents the control. Shown are the values for Na+, K+, and Cl together with the evolution of the Na+/K+ ratio over time. Data represent means ± se from three independent biological replicates, and an asterisk indicates a significant difference (P ≤ 0.05) to stressed wild-type and EV plants, respectively.
Figure 4.
Figure 4.
SERF1 Affects the Expression of H2O2-Responsive MAPK and TF Genes. Transcript levels of MAPK cascade genes (A) and TF genes (B) were measured in roots of wild-type and serf1 plants subjected to salt stress (100 mM NaCl) for 30 min or 3 h; expression values are normalized to ACTIN. Data represent mean ΔΔCT ± se from three independent biological replicates, and an asterisk indicates a significant difference between stressed and mock-treated plants (P ≤ 0.05) of the same genotype. The heat map presents the response of each gene to 5 mM H2O2 (H), 5 µM ABA (A), or 100 mM mannitol (M) after 30 min or 3 h of treatment. Values are given as log2FC relative to mock-treated wild-type roots; n = 3. Os06g43030 and Os07g43900 code for protein kinases. FC, fold change; WT, the wild type.
Figure 5.
Figure 5.
SERF1 Binds to a DREB-Specific Cis-Element Present in the Promoters of MAP3K6, MAPK5, DREB2A, ZFP179, and SERF1. (A) Position of the DREB binding site 'ACCGAC' (white box) and 'GCCGAC' (black box) in the promoters of putative direct targets of SERF1. Positions of probes used for EMSA (light blue arrows) and ChIP-qPCR–based binding assay (black arrows) are shown below each gene. (B) EMSA performed with probes specific to MAPK5 (M-1 and M-2), DREB2A (D-1), MAP3K6 (M3-1), ZFP179 (Z-1), and SERF1 (S-1). Binding of SERF1 causes a band shift (black arrow). Upon addition of unlabeled probe (competitor, 100×), the intensity of the shifted band fades. The first lane on the left contains only the labeled probe M-1. (C) Consensus sequence of the SERF1 binding site (red box). (D) ChIP-qPCR–based in vivo binding assay with promoter fragments spanning the SERF1 binding site; n = 3. Data represent mean values ± se. As a negative control (NC), a ZFP179-specific promoter fragment ∼2.1 kb upstream of the transcriptional start site was tested. An asterisk indicates a significant difference (P ≤ 0.05) to the IgG negative control according to Student's t test. FC, fold change.
Figure 6.
Figure 6.
Mutating Ser-105 in SERF1 Alters Its Transcriptional Activity. (A) to (D) Firefly LUC activity (fold change) of MAPK5:LUC (A), DREB2A:LUC (B), ZFP179:LUC (C), and SERF1:LUC (D) in the presence of wild-type SERF1 (SERF1S105), SERF1 mimicking constitutive phosphorylation (SERF1D105), and SERF1 unable to be phosphorylated (SERF1A105) relative to the control (corresponds to basal expression). Values represent means ± sd (n = 3). Different letters (a to d) above bars represent significantly different groups (P ≤ 0.05) calculated by analysis of variance tests. FC, fold change. (E) Nuclear localization of SERF1S105-CFP (left panel) and SERF1D105-CFP (right panel) in rice shoot protoplasts. Chloroplasts show red autofluorescence. Bars = 5 µm.
Figure 7.
Figure 7.
Interaction of SERF1 and MAPK5 Enhances the Transcriptional Activity of SERF1. (A) to (D) LUC activity (fold change [FC]) of MAPK5:LUC (A), DREB2A:LUC (B), ZFP179:LUC (C), and SERF1:LUC (D) in the presence of unmodified SERF1 (SERF1S105) or modified SERF1, which cannot be phosphorylated at position 105 (SERF1A105) with or without MAPK5 relative to the control (corresponds to basal expression). Values represent means ± sd (n = 3). An asterisk indicates a significant difference (P ≤ 0.05) between the signals caused by SERF1S105 alone or SERF1S105 in the presence of MAPK5, as calculated by Student's t test. (E) In vitro kinase assay. The luminescence increased when wild-type SERF1 was incubated with MAPK5. Preheated MAPK5 (10 min 95°C; MAPK5*) or incubation of SERF1A105 with MAPK did not enhance LUC activity. ADP consumption is expressed as luminescence signal. Values shown are the means ± se of four independent reactions. An asterisk indicates a significant difference (P ≤ 0.05) to control reaction with MAPK5 only according to Student's t test. (F) Split-luciferase assay with the wild-type SERF1 CDS fused to the C-terminal part and the MAPK5 CDS fused to the N-terminal part of LUC. Measurements were taken 90 and 180 min after transformation into rice shoot protoplasts. The strength of the luminescence signal is expressed relative to the coexpression of both empty vectors, each containing one-half of the LUC gene; n = 3. Data represent means ± se. An asterisk indicates a significant difference (P ≤ 0.05) to the control.
Figure 8.
Figure 8.
Proposed Role of SERF1 during the Initial Response to Salt Stress. Salt stress induces the expression of SERF1, potentially through H2O2 production. At the transcriptional level, SERF1 directly activates the expression of its target genes MAP3K6, MAPK5, DREB2A, and ZFP179, and itself. Transcriptional activity of SERF1 is regulated by MAPK5 through phosphorylation of a conserved Ser residue at position 105. The MAPK5-controlled activation of SERF1 allows for the induction of SERF1 target genes within minutes after salt stress. Furthermore, SERF1 functions in a positive feedback loop at the transcriptional level for the salt-responsive MAPK cascade and itself. Solid arrows represent experimentally shown interactions and dotted arrows indicate putative interactions.

Similar articles

Cited by

References

    1. Ahlfors R., Macioszek V., Rudd J., Brosché M., Schlichting R., Scheel D., Kangasjärvi J. (2004). Stress hormone-independent activation and nuclear translocation of mitogen-activated protein kinases in Arabidopsis thaliana during ozone exposure. Plant J. 40: 512–522 - PubMed
    1. Arvidsson S., Kwasniewski M., Riaño-Pachón D.M., Mueller-Roeber B. (2008). QuantPrime—A flexible tool for reliable high-throughput primer design for quantitative PCR. BMC Bioinformatics 9: 465. - PMC - PubMed
    1. Bartels D., Sunkar R. (2005). Drought and salt tolerance in plants. Crit. Rev. Plant Sci. 24: 23–58
    1. Bienert G.P., Schjoerring J.K., Jahn T.P. (2006). Membrane transport of hydrogen peroxide. Biochim. Biophys. Acta 1758: 994–1003 - PubMed
    1. Boudsocq M., Laurière C. (2005). Osmotic signaling in plants: Multiple pathways mediated by emerging kinase families. Plant Physiol. 138: 1185–1194 - PMC - PubMed

Publication types

MeSH terms

Associated data

LinkOut - more resources