. 2013 Aug;162(4):2028-41.
doi: 10.1104/pp.113.222372. Epub 2013 Jun 25.

Identification of genes involved in the response of Arabidopsis to simultaneous biotic and abiotic stresses

Affiliations

Identification of genes involved in the response of Arabidopsis to simultaneous biotic and abiotic stresses

Nicky J Atkinson et al. Plant Physiol. 2013 Aug.

Abstract

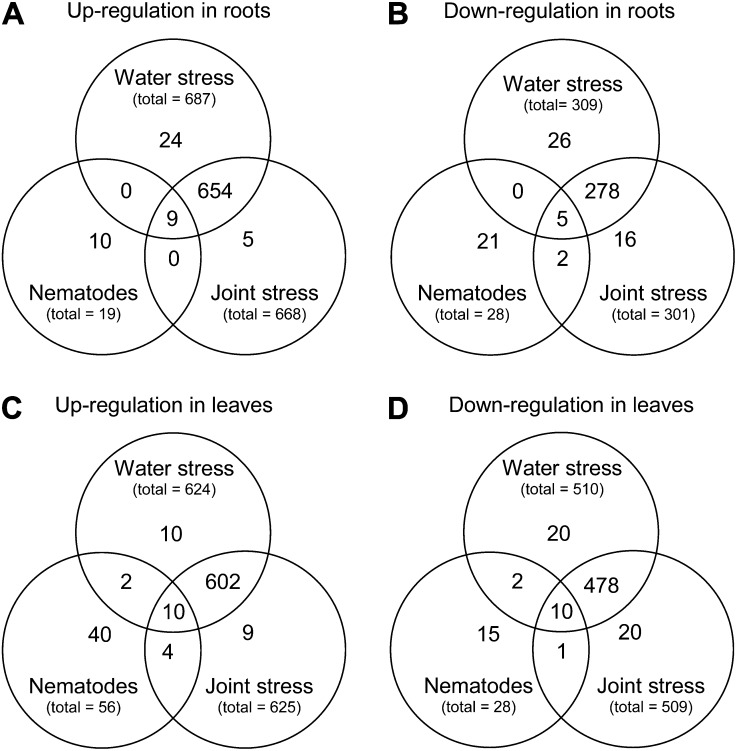
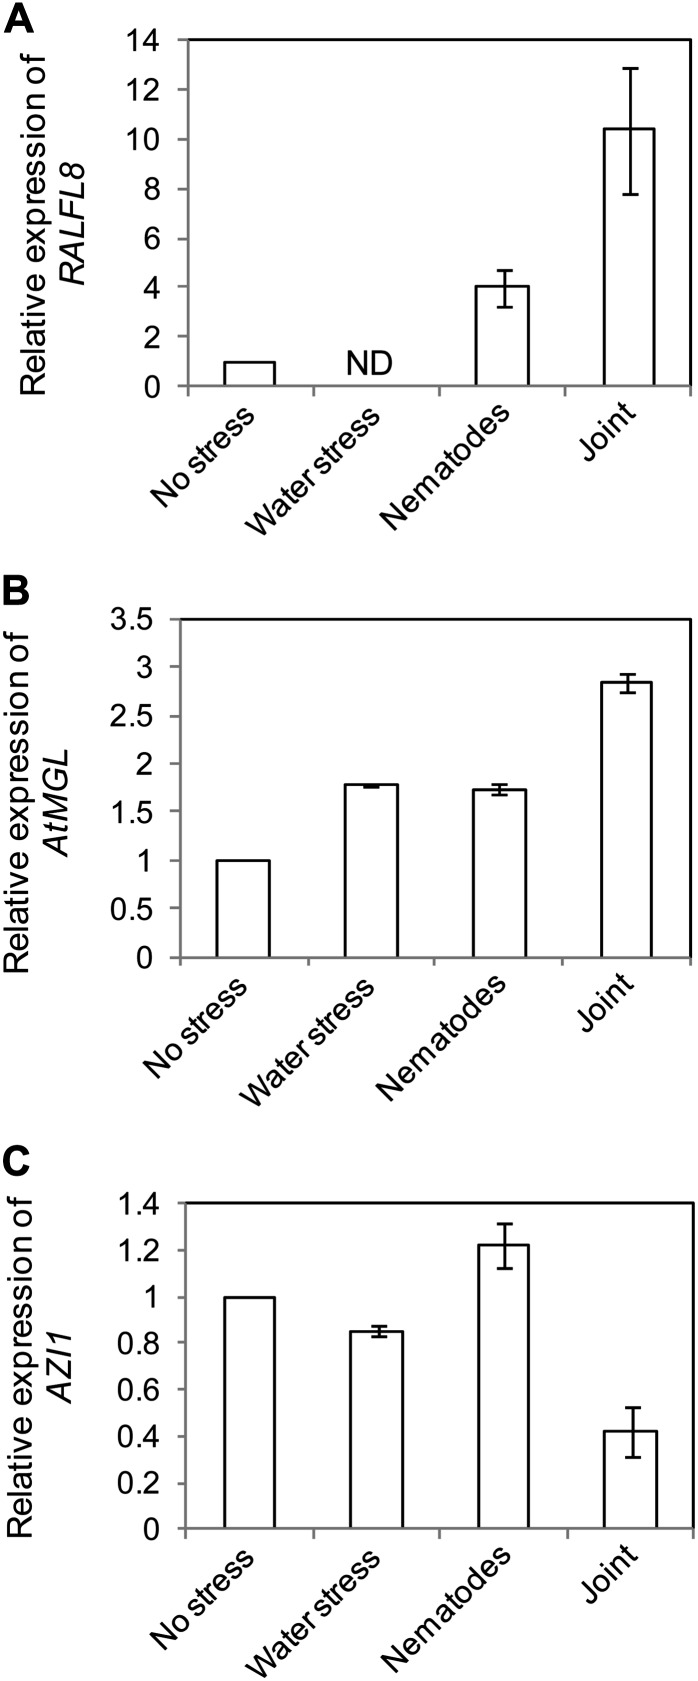
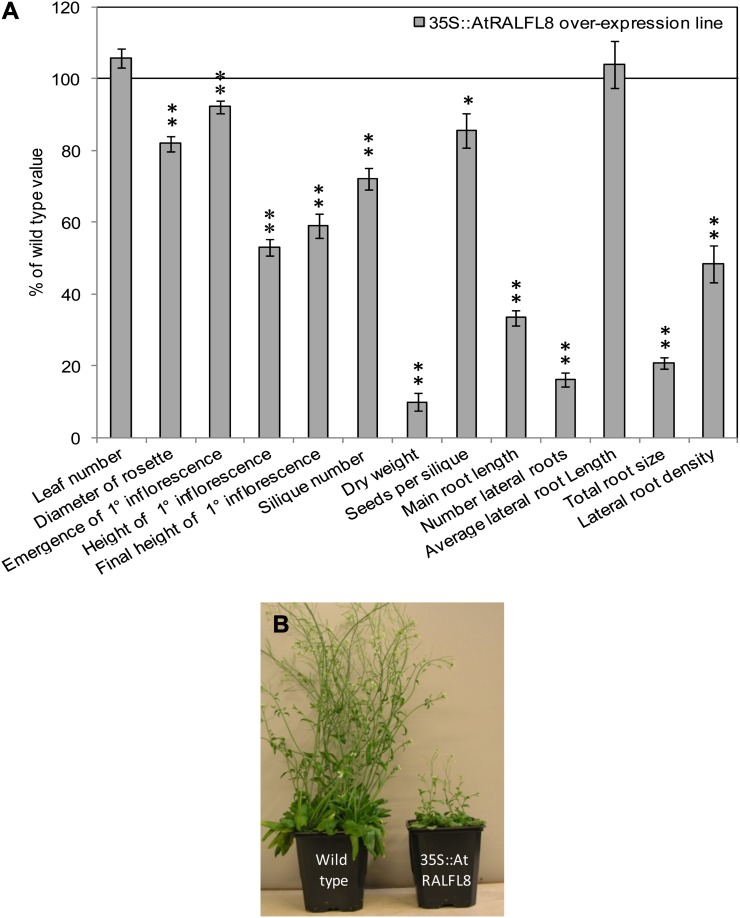
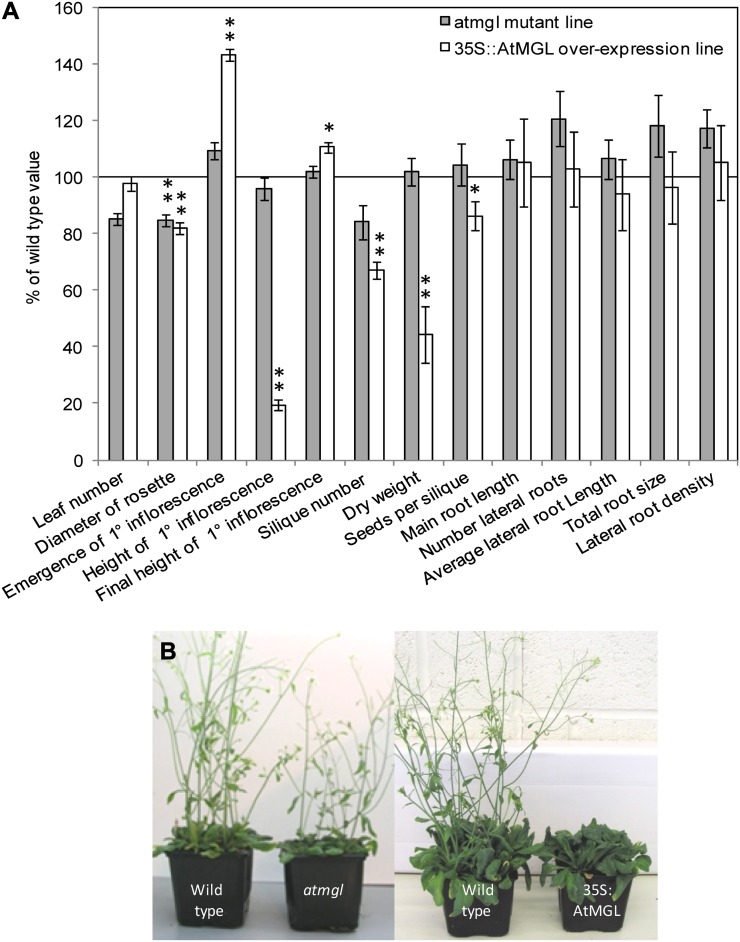
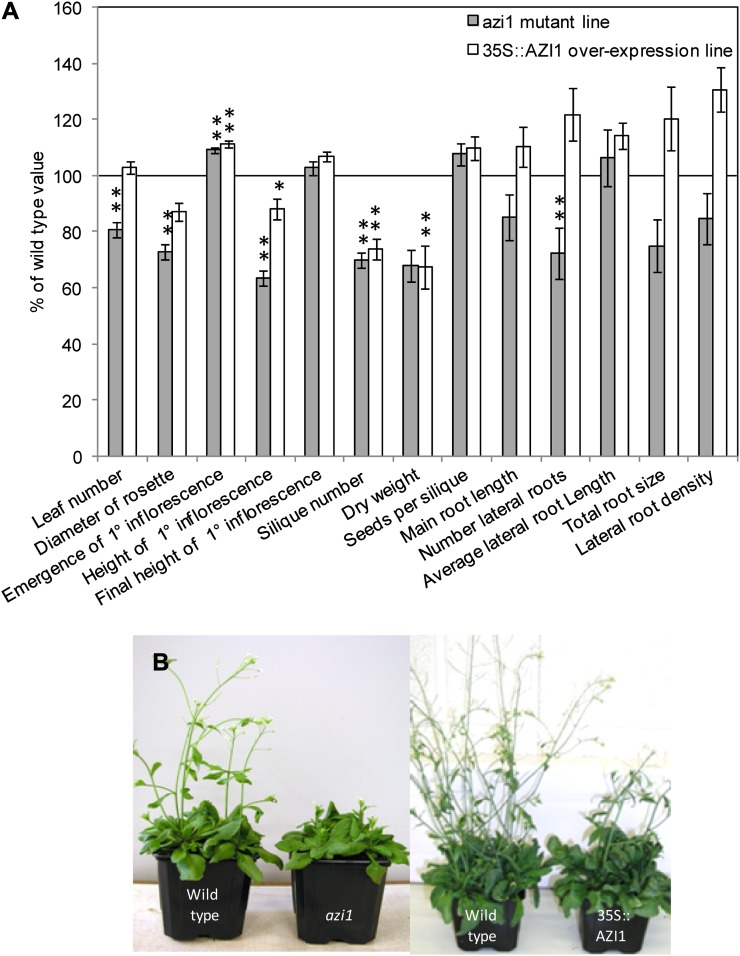
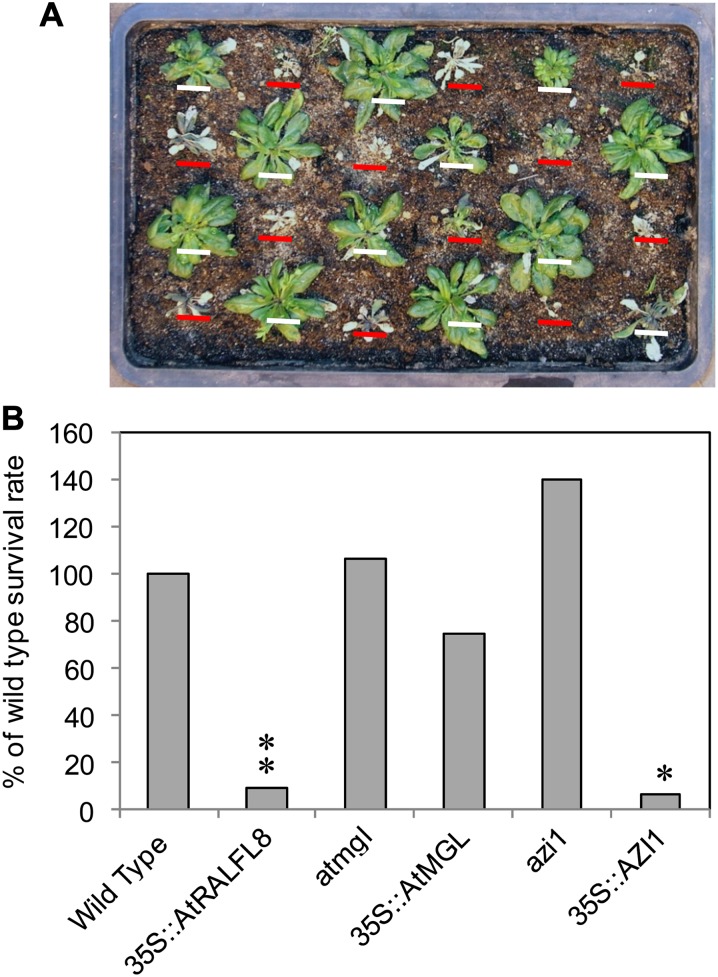
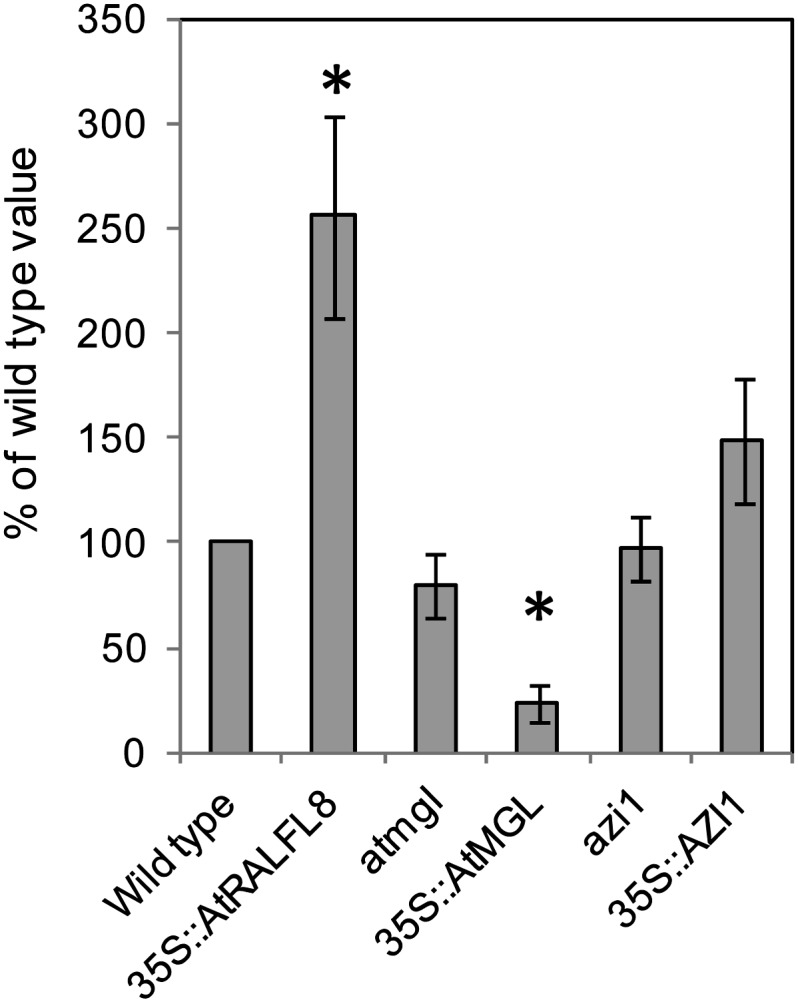
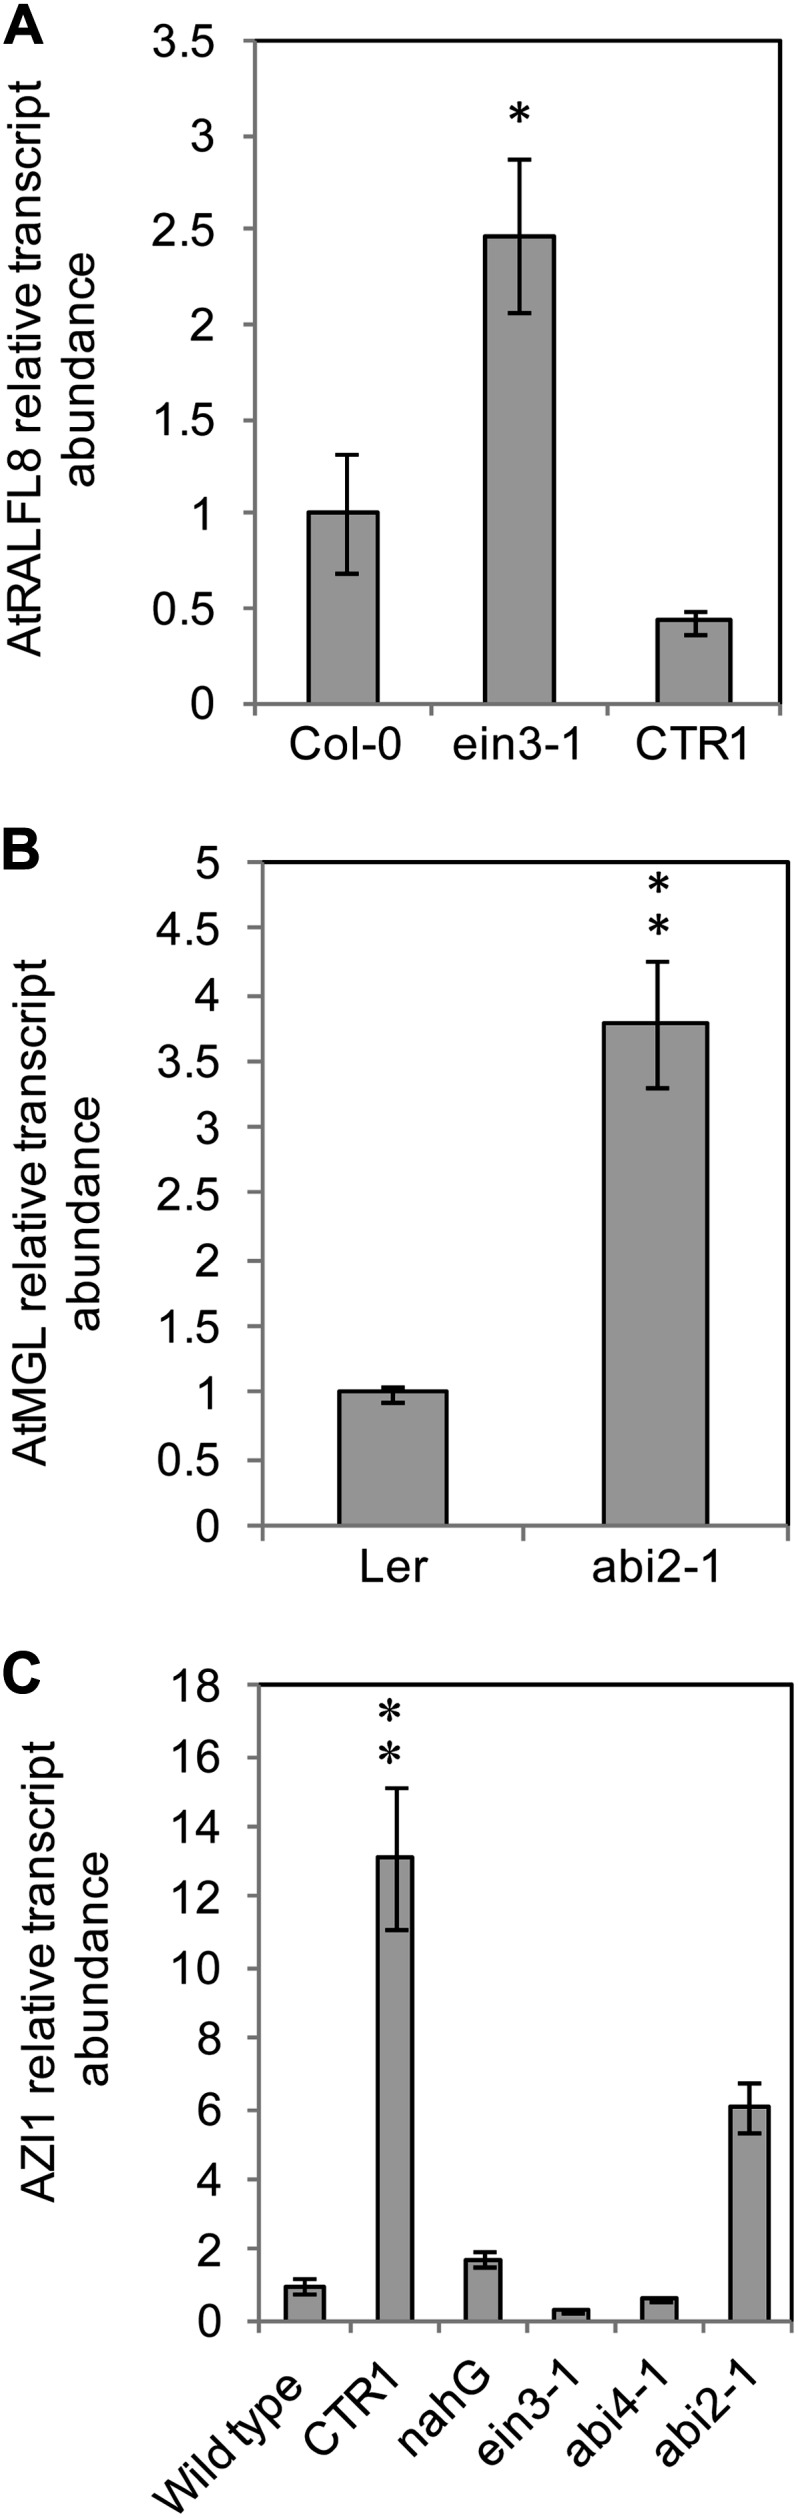
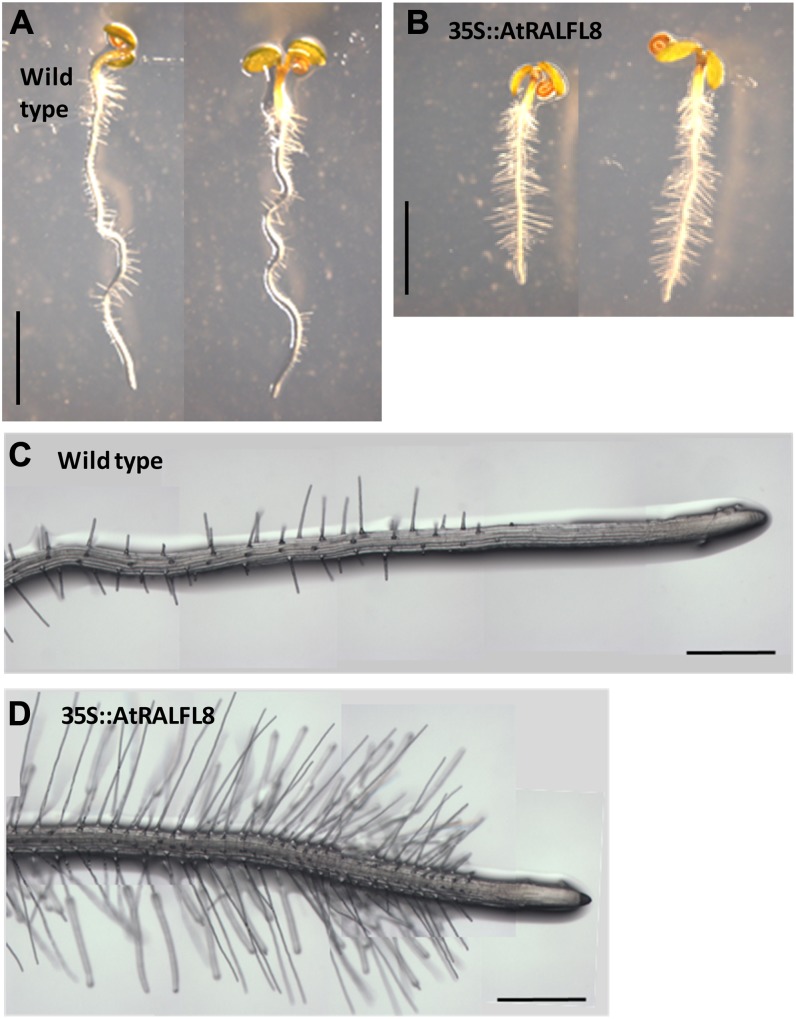
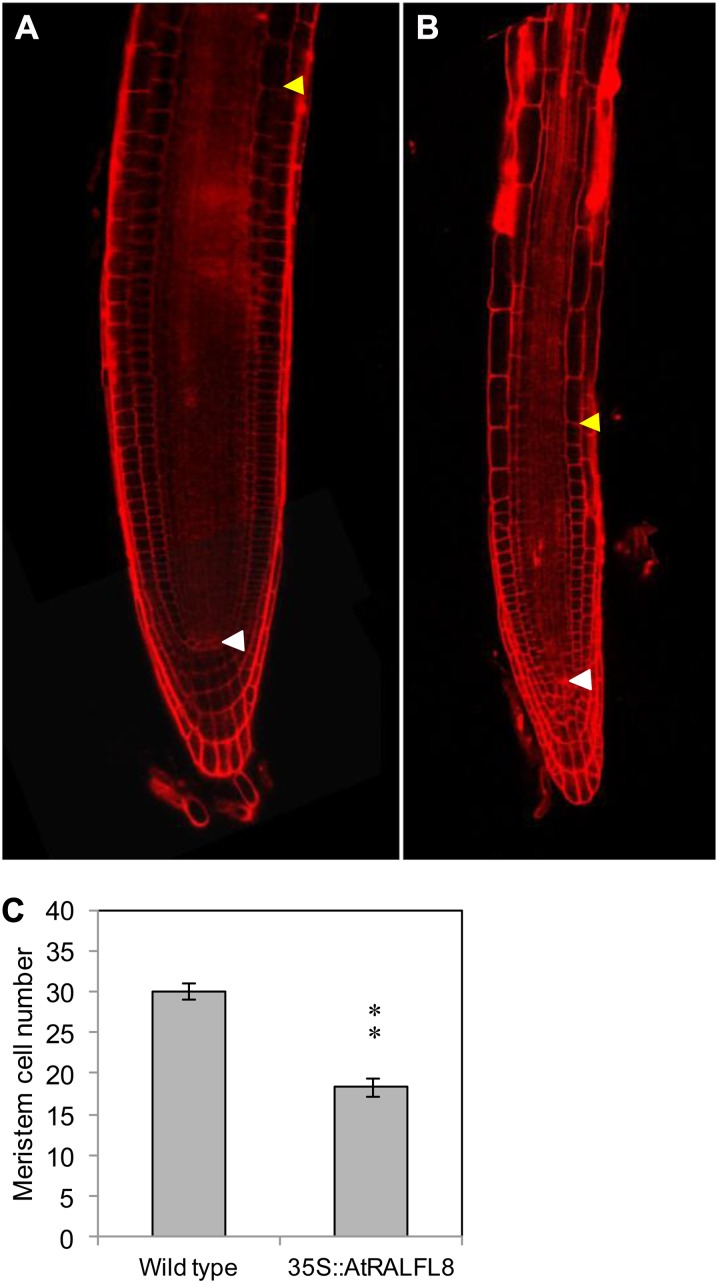
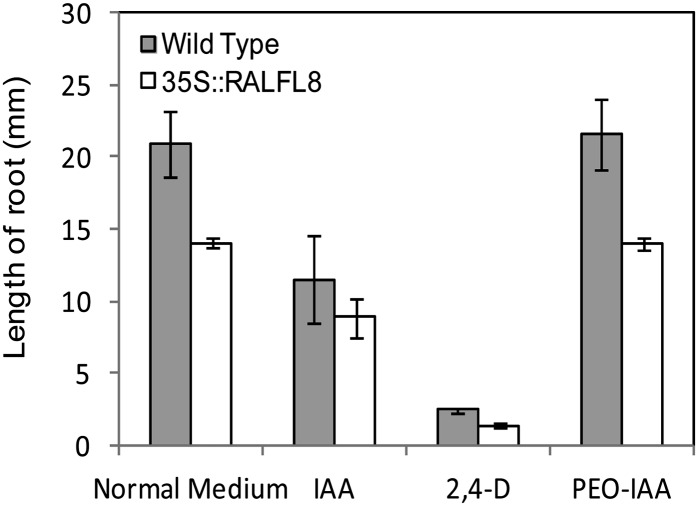
In field conditions, plants may experience numerous environmental stresses at any one time. Research suggests that the plant response to multiple stresses is different from that for individual stresses, producing nonadditive effects. In particular, the molecular signaling pathways controlling biotic and abiotic stress responses may interact and antagonize one another. The transcriptome response of Arabidopsis (Arabidopsis thaliana) to concurrent water deficit (abiotic stress) and infection with the plant-parasitic nematode Heterodera schachtii (biotic stress) was analyzed by microarray. A unique program of gene expression was activated in response to a combination of water deficit and nematode stress, with 50 specifically multiple-stress-regulated genes. Candidate genes with potential roles in controlling the response to multiple stresses were selected and functionally characterized. RAPID ALKALINIZATION FACTOR-LIKE8 (AtRALFL8) was induced in roots by joint stresses but conferred susceptibility to drought stress and nematode infection when overexpressed. Constitutively expressing plants had stunted root systems and extended root hairs. Plants may produce signal peptides such as AtRALFL8 to induce cell wall remodeling in response to multiple stresses. The methionine homeostasis gene METHIONINE GAMMA LYASE (AtMGL) was up-regulated by dual stress in leaves, conferring resistance to nematodes when overexpressed. It may regulate methionine metabolism under conditions of multiple stresses. AZELAIC ACID INDUCED1 (AZI1), involved in defense priming in systemic plant immunity, was down-regulated in leaves by joint stress and conferred drought susceptibility when overexpressed, potentially as part of abscisic acid-induced repression of pathogen response genes. The results highlight the complex nature of multiple stress responses and confirm the importance of studying plant stress factors in combination.


Figures

Figure 1.
Figure 1.
Venn diagrams showing overlap between genes differentially regulated by water stress, nematode stress, or the two in combination. Genes up- and down-regulated in roots (A and B, respectively) and leaves (C and D, respectively) are shown separately. Genes are shown whose expression levels differed significantly from control arrays where P < 0.05. Overlapping sections represent genes that were up- or down-regulated by more than one stress treatment. Data shown represent three biological replicates.
Figure 2.
Figure 2.
Relative expression of candidate genes in leaves of plants under differing stress treatments. The expression levels of AtRALFL8 (A), AtMGL (B), and AZI1 (C) are shown relative to the unstressed samples, as analyzed by qRT-PCR. RNA was pooled from 40 plants. Error bars represent se of the means of three technical replicates. ND, Not detected.
Figure 3.
Figure 3.
Phenotype of AtRALFL8 overexpression line under control conditions. 35S::AtRALFL8 plants were grown in soil to measure the phenotype of aerial parts of the plants and on tissue culture plates to analyze the root systems. A, Phenotypic measurements are shown as a percentage of the value obtained for wild-type plants grown in parallel. The line at 100% represents the wild-type value. Asterisks show a significant difference from the wild type (n = 16; **P < 0.01, *P < 0.05). B, Photograph shows wild-type and transgenic plants 35 d after sowing. [See online article for color version of this figure.]
Figure 4.
Figure 4.
Phenotype of AtMGL mutant and overexpression lines under control conditions. Mutant atmgl and 35S::AtMGL plants were grown in soil to measure the phenotype of aerial parts of the plants and on tissue culture plates to analyze the root systems. A, Phenotypic measurements are shown as a percentage of the value obtained for wild-type plants grown in parallel. The line at 100% represents the wild-type value. Asterisks show a significant difference from the wild type (n = 16; **P < 0.01, *P < 0.05). B, Photographs show wild-type and mutant/overexpressing plants 35 d after sowing. [See online article for color version of this figure.]
Figure 5.
Figure 5.
Phenotype of AZI1 mutant and overexpression lines under control conditions. Mutant azi1 and 35S::AZI1 plants were grown in soil to measure the phenotype of aerial parts of the plants and on tissue culture plates to analyze the root systems. A, Phenotypic measurements are shown as a percentage of the value obtained for wild-type plants grown in parallel. The line at 100% represents the wild-type value. Asterisks show a significant difference from the wild type (n = 16; **P < 0.01, *P < 0.05). B, Photographs show wild-type and mutant/overexpressing plants 35 d after sowing. [See online article for color version of this figure.]
Figure 6.
Figure 6.
Survival rate of mutant and overexpression lines after drought stress. Irrigation was withheld from 12 21-d-old seedlings of each genotype until soil moisture content dropped to less than 3% (approximately 2 weeks). Plants were rewatered and scored for survival after a further week. A, Wild-type (white bars) and 35S::AtRALFL8 plants (red bars) 1 week after rewatering. B, Survival rate of each genotype compared with wild-type plants (shown as 100%). Asterisks show a significant difference from the wild type (**P < 0.01, *P < 0.05) according to χ2 tests.
Figure 7.
Figure 7.
Nematode susceptibility assays. Mutant and overexpression lines for each candidate gene were exposed to 100 J2 H. schachtii nematodes per plant. Nematodes were allowed to develop for 10 d, then roots were stained and the number of established third- and fourth-stage juvenile nematodes (J3 and J4) counted per plant. The mean number of nematodes per plant for each genotype is expressed as a percentage of the wild-type value (100%). Asterisks show a significant difference from the wild type (n = 10–12; *P < 0.05).
Figure 8.
Figure 8.
Expression levels of candidate genes in hormone signaling mutants. The relative transcript abundance of candidate genes was analyzed in Arabidopsis hormone signaling mutants using qRT-PCR. AtRALFL8 (A), AtMGL (B), and AZI1 (C). Values are the average of three biological replicates of four plants each. Asterisks show significant differences in candidate gene expression level compared with the wild-type value (**P < 0.01, *P < 0.05).
Figure 9.
Figure 9.
Root hair phenotype of 35S::AtRALFL8 plants. Wild-type (A and C) and 35S::AtRALFL8 (B and D) seedlings were grown on one-half-strength MS media and photographed after 4 d of growth. Long, dense root hairs are clearly visible in the overexpression line. Bars = 2.5 mm (A and B) and 500 μm (C and D). [See online article for color version of this figure.]
Figure 10.
Figure 10.
Reduced meristem size in 35S::AtRALFL8 roots. Cortical meristematic cells between the quiescent center (white arrows) and the transition zone (yellow arrow) were counted in wild-type (A) and 35S::AtRALFL8 (B) plants 10 d post germination. Red indicates cell walls as stained by propidium iodide. C, The meristem was significantly shorter in the 35S::AtRALFL8 plants (n = 5; **P < 0.01).
Figure 11.
Figure 11.
Effect of auxin on root length in 35S::AtRALFL8 overexpression line. Wild-type and 35S::AtRALFL8 seedlings were grown on different media and the root length measured after 7 d (n = 8). IAA is a natural auxin, 2,4-d is a synthetic auxin, and PEO-IAA is an antiauxin agent.

References

    1. Abuqamar S, Luo HL, Laluk K, Mickelbart MV, Mengiste T. (2009) Crosstalk between biotic and abiotic stress responses in tomato is mediated by the AIM1 transcription factor. Plant J 58: 347–360 - PubMed
    1. Adie BAT, Pérez-Pérez J, Pérez-Pérez MM, Godoy M, Sánchez-Serrano JJ, Schmelz EA, Solano R. (2007) ABA is an essential signal for plant resistance to pathogens affecting JA biosynthesis and the activation of defenses in Arabidopsis. Plant Cell 19: 1665–1681 - PMC - PubMed
    1. An SH, Sohn KH, Choi HW, Hwang IS, Lee SC, Hwang BK. (2008) Pepper pectin methylesterase inhibitor protein CaPMEI1 is required for antifungal activity, basal disease resistance and abiotic stress tolerance. Planta 228: 61–78 - PMC - PubMed
    1. Anderson JP, Badruzsaufari E, Schenk PM, Manners JM, Desmond OJ, Ehlert C, Maclean DJ, Ebert PR, Kazan K. (2004) Antagonistic interaction between abscisic acid and jasmonate-ethylene signaling pathways modulates defense gene expression and disease resistance in Arabidopsis. Plant Cell 16: 3460–3479 - PMC - PubMed
    1. Asselbergh B, Achuo AE, Höfte M, Van Gijsegem F. (2008a) Abscisic acid deficiency leads to rapid activation of tomato defence responses upon infection with Erwinia chrysanthemi. Mol Plant Pathol 9: 11–24 - PMC - PubMed

Publication types

MeSH terms