. 2013 Sep;33(9):1422-8.
doi: 10.1038/jcbfm.2013.86. Epub 2013 Jun 26.

Perfluorocarbons enhance a T2*-based MRI technique for identifying the penumbra in a rat model of acute ischemic stroke

Affiliations

Perfluorocarbons enhance a T2*-based MRI technique for identifying the penumbra in a rat model of acute ischemic stroke

Graeme A Deuchar et al. J Cereb Blood Flow Metab. 2013 Sep.

Abstract

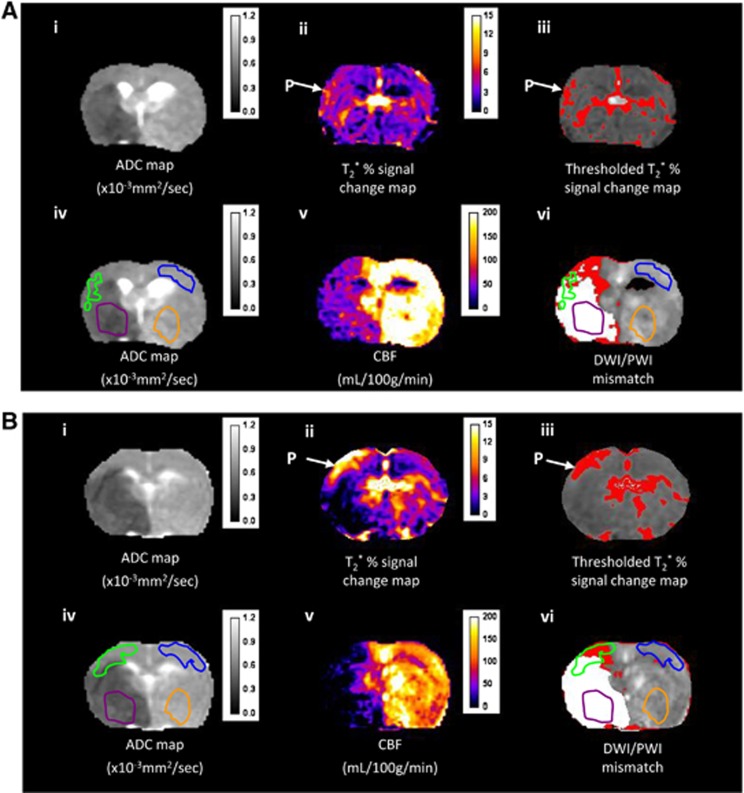
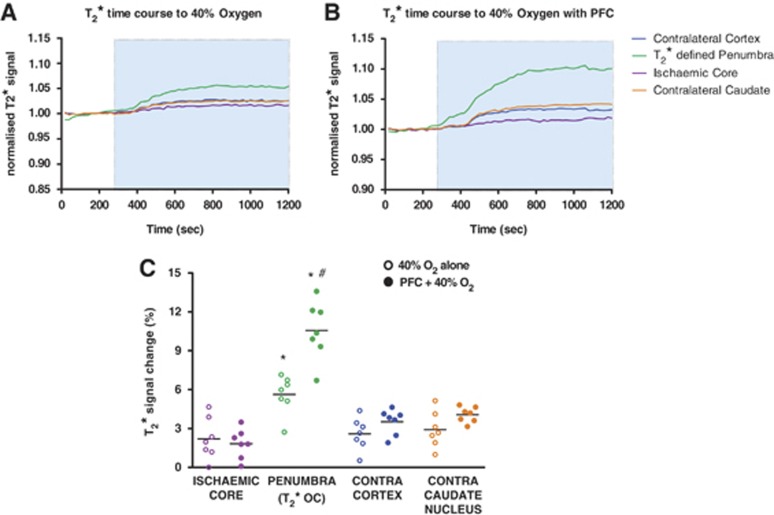
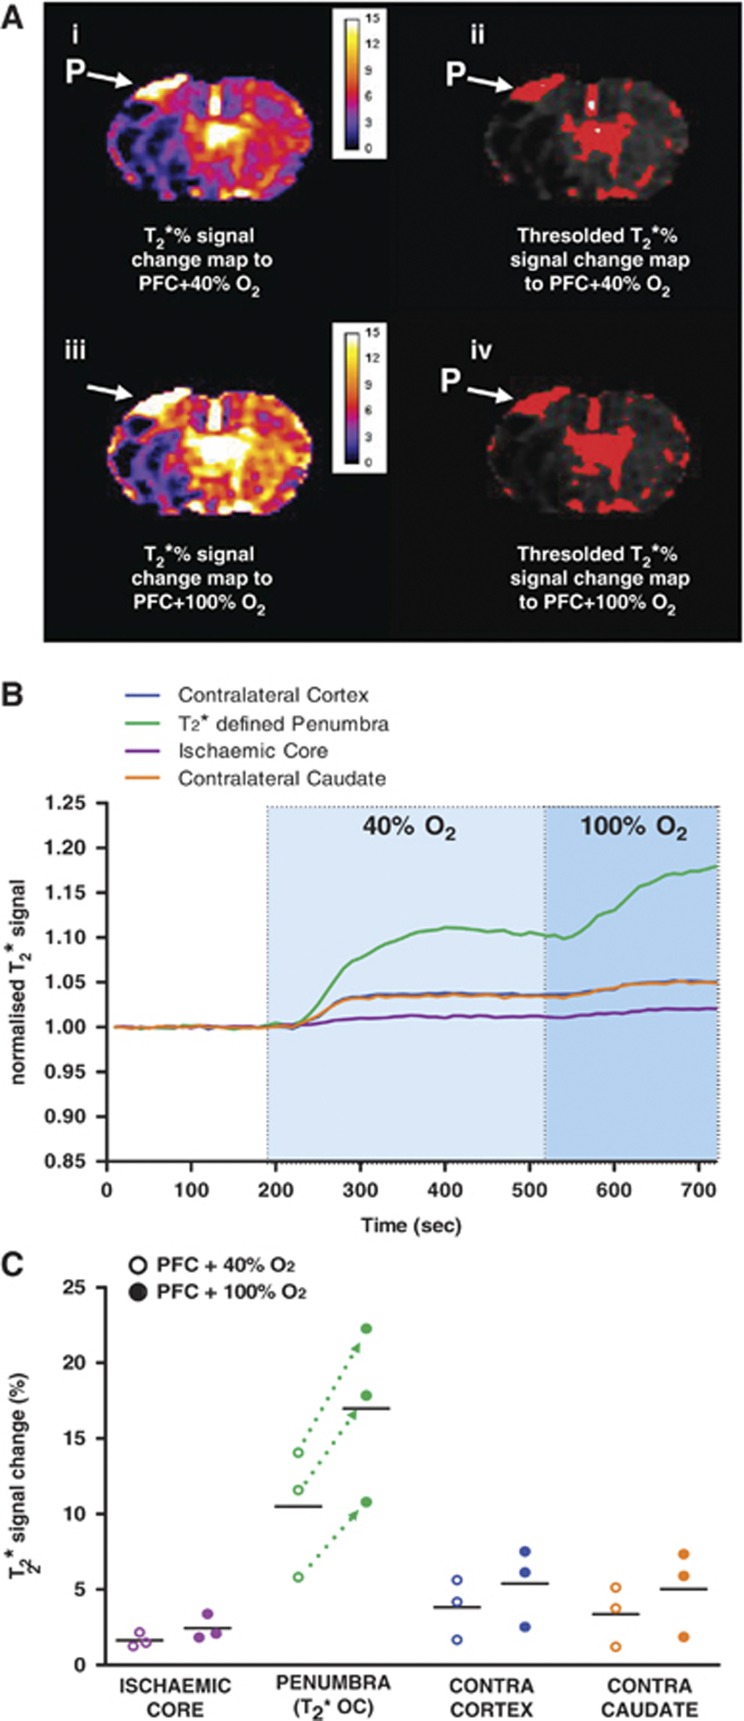
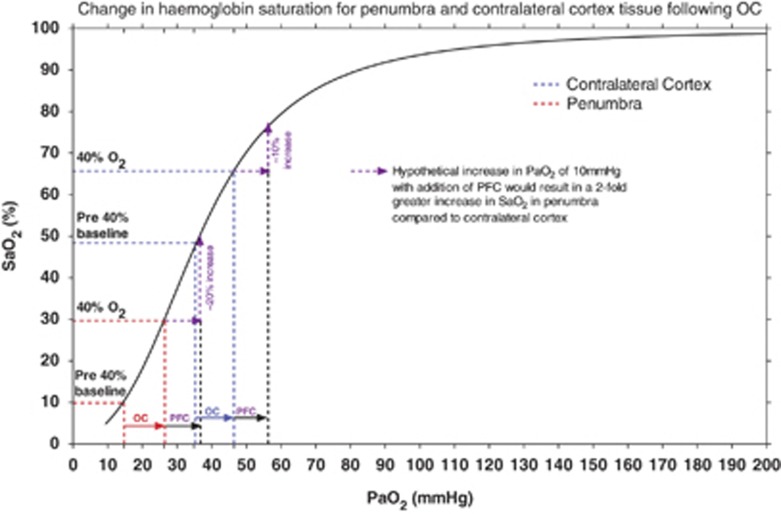
Accurate imaging of ischemic penumbra is crucial for improving the management of acute stroke patients. T2* magnetic resonance imaging (MRI) combined with a T2*oxygen challenge (T2*OC) is being developed to detect penumbra based on changes in blood deoxyhemoglobin. Using 100% O2, T2*OC-defined penumbra exhibits ongoing glucose metabolism and tissue recovery on reperfusion. However, potential limitations in translating this technique include a sinus artefact in human scans with delivery of 100% OC and relatively small signal changes. Here we investigate whether an oxygen-carrying perfluorocarbon (PFC) emulsion can enhance the sensitivity of the technique, enabling penumbra detection with lower levels of inspired oxygen. Stroke was induced in male Sprague-Dawley rats (n=17) with ischemic injury and perfusion deficit determined by diffusion and perfusion MRI, respectively. T2* signal change was measured in regions of interest (ROIs) located within ischemic core, T2*OC-defined penumbra and equivalent contralateral areas during 40% O2±prior PFC injection. Region of interest analyses between groups showed that PFC significantly enhanced the T2* response to 40% O2 in T2*-defined penumbra (mean increase of 10.6±2.3% compared to 5.6±1.5% with 40% O2, P<0.001). This enhancement was specific to the penumbra ROI. Perfluorocarbon emulsions therefore enhances the translational potential of the T2*OC technique for identifying penumbra in acute stroke patients.


Figures

Figure 1
Figure 1
Detection of the penumbra (P) using T2* oxygen challenge OC with a 0.4 fraction of inspired oxygen (FiO2) (A) or 0.4 FiO2 following 1.5 ml perfluorocarbon (PFC) intravenous (B). (i) Apparent diffusion coefficient (ADC) map prior to OC; (ii) T2* % signal change map; (iii) the corresponding thresholded image; (iv) ADC map with selected regions of interests (ROIs) superimposed (green, T2* P; blue, contralateral cortex; purple, ischemic core; and orange, equivalent contralateral ROI); (v) quantitative cerebral blood flow (CBF) map for the same slice measured at baseline prior to PFC injection and OC; and (vi) the thresholded diffusion-weighted image (DWI) lesion (white shading) and perfusion image-DWI mismatch (red shading) with the four ROIs superimposed.
Figure 2
Figure 2
Graphs showing mean time course data (n=7 per group) of T2* signal change to 0.4 fraction of inspired oxygen (FiO2) (A) or perfluorocarbon (PFC) +0.4 FiO2 (B) in the four regions of interests (ROIs); blue shading indicates the period of oxygen challenge (OC) with 0.4 FiO2. (C) Peak T2* signal changes to 0.4 FiO2 with and without prior administration of PFC in the four ROIs. Horizontal bars indicate means. *indicates significantly greater signal change in T2*-defined penumbra (P) compared to all other ROIs. #indicates significantly enhanced T2* response in the P to 40% oxygen following PFC when compared to 40% oxygen alone.
Figure 3
Figure 3
(A) (i) Detection of the penumbra (P) from the T2* % signal change map using 0.4 fraction of inspired oxygen (FiO2) following 1.5 mL perfluorocarbon (PFC) intravenous; (ii) the corresponding thresholded image; (iii) detection of the P in the same animal from the T2* % signal change map following an increase in FiO2 to 1.0; (iv) the corresponding thresholded image. (B) Graph showing mean (n=3) time course of T2* signal change in regions of interests (ROIs) to 0.4 FiO2 (light blue shaded area) and 1.0 FiO2 (darker blue shaded area) following administration of PFC. (C) Peak T2* signal change in ROIs to 0.4 and 1.0 FiO2 following administration of PFC. Dotted lines indicate further increase in T2* within the P ROI on increasing FiO2 from 0.4 to 1.0 following PFC. Horizontal bars indicate means.
Figure 4
Figure 4
Standard hemoglobin dissociation curve (black line) for Sprague-Dawley rats (modified from Cartheuser ) where arterial hemoglobin saturation (SaO2%) is plotted against partial pressure of oxygen in arterial blood (PaO2). Brain tissue pO2 data have been superimposed from one of our earlier studies (brain tissue pO2 was measured simultaneously in the presumed penumbra (P) and corresponding contralateral cortex using implanted Oxyflo/Oxylite probes) to emphasize the expected SaO2 changes associated with 40% O2 oxygen challenge (OC) and perfluorocarbon (PFC)+40% O2 in the contralateral cortex and P.

References

    1. The National Institute of Neurological Disorders and Stroke rt-PA Stroke Study Group Tissue plasminogen activator for acute ischemic stroke. N Engl J Med. 1995;333:1581–1587. - PubMed
    1. Furlan M, Marchal G, Viader F, Derlon JM, Baron JC. Spontaneous neurological recovery after stroke and the fate of the ischemic penumbra. Ann Neurol. 1996;40:216–226. - PubMed
    1. Perez A, Restrepo L, Kleinman JT, Barker P, Beauchamp N, Wityk RJ. Patients with diffusion-perfusion mismatch on magnetic resonance imaging 48 hours or more after stroke symptom onset: clinical and imaging features. J Neuroimaging. 2006;16:329–333. - PubMed
    1. Ahmed N, Wahlgren N, Grond M, Hennerici M, Lees KR, Mikulik R, et al. Implementation and outcome of thrombolysis with alteplase 3-4.5 h after an acute stroke: an updated analysis from SITS-ISTR. Lancet Neurol. 2010;9:866–874. - PubMed
    1. Saver JL, Smith EE, Fonarow GC, Reeves MJ, Zhao X, Olson DM, et al. The “Golden Hour” and acute brain ischemia: presenting features and lytic therapy in >30,000 patients arriving within 60 minutes of stroke onset. Stroke. 2010;41:1431–1439. - PMC - PubMed

Publication types

LinkOut - more resources