Review
. 2012 Mar-Apr;1(2):231-52.
doi: 10.1002/wdev.18. Epub 2011 Dec 27.

Morphogenesis in sea urchin embryos: linking cellular events to gene regulatory network states

Affiliations
Review

Morphogenesis in sea urchin embryos: linking cellular events to gene regulatory network states

Deirdre C Lyons et al. Wiley Interdiscip Rev Dev Biol. 2012 Mar-Apr.

Abstract

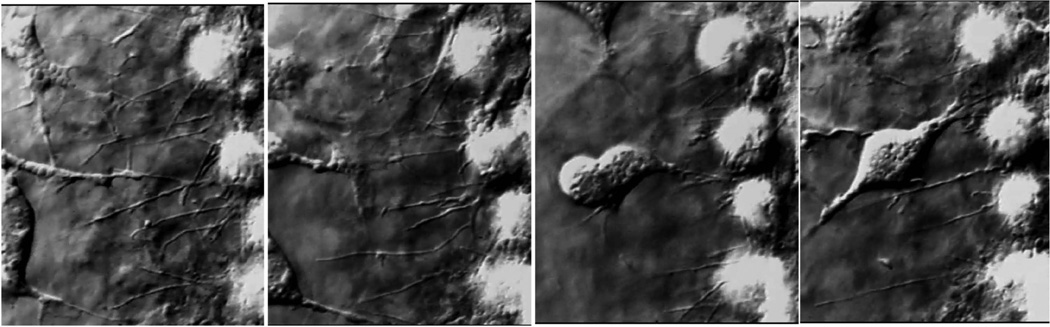
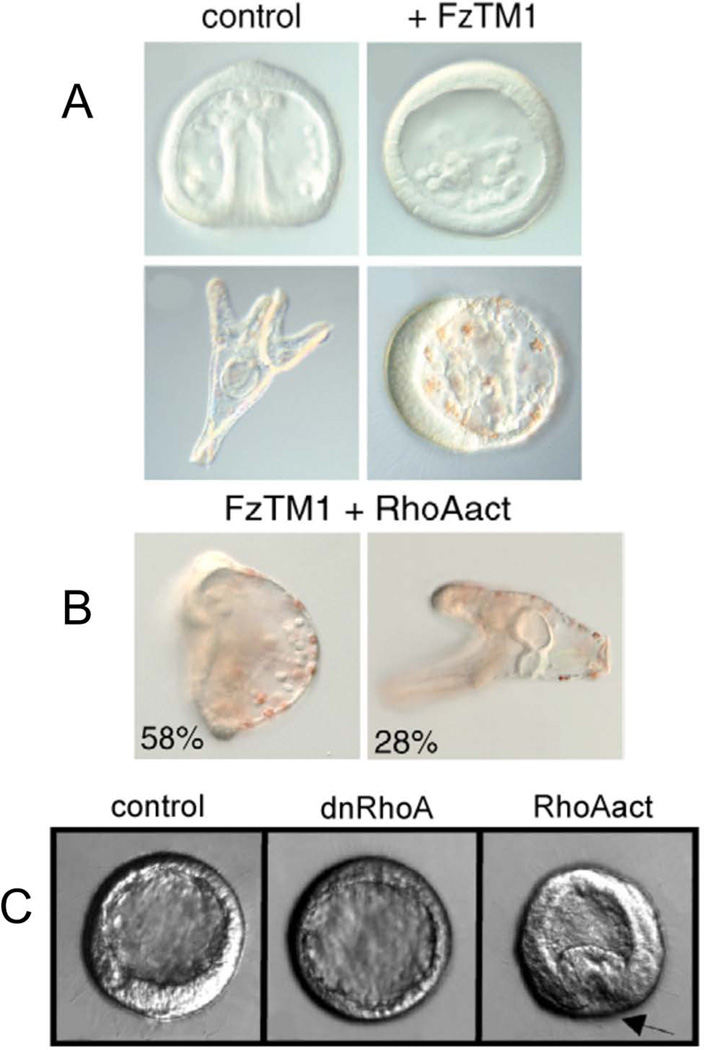
Gastrulation in the sea urchin begins with ingression of the primary mesenchyme cells (PMCs) at the vegetal pole of the embryo. After entering the blastocoel the PMCs migrate, form a syncitium, and synthesize the skeleton of the embryo. Several hours after the PMCs ingress the vegetal plate buckles to initiate invagination of the archenteron. That morphogenetic process occurs in several steps. The nonskeletogenic cells produce the initial inbending of the vegetal plate. Endoderm cells then rearrange and extend the length of the gut across the blastocoel to a target near the animal pole. Finally, cells that will form part of the midgut and hindgut are added to complete gastrulation. Later, the stomodeum invaginates from the oral ectoderm and fuses with the foregut to complete the archenteron. In advance of, and during these morphogenetic events, an increasingly complex input of transcription factors controls the specification and the cell biological events that conduct the gastrulation movements.


Figures

Figure 1
Figure 1
Sequence of development of sea urchin embryos. This diagram shows several stages in the development of the embryo up to the pluteus larval stage. Mesomeres, macromeres and micromeres originate at 4th cleavage, which includes an asymmetric cleavage in the vegetal half of the embryo. The micromeres (red) are fated to produce the larval skeleton. The macromeres are fated to produce mesoderm (shades of red), endoderm (yellow), and a small amount of ectoderm (blue). The animal half of the embryo produces ectoderm and neural tissues. The PMCs ingress at the mesenchyme blastula stage, and shortly thereafter the archenteron begins its invagination. As the skeleton grows the embryo changes shape, first to a prism shape and then to the pluteus larval shape.
Figure 2
Figure 2
Endomesoderm gene regulatory network (GRN). Each node represents a gene with its enhancer region above an arrow to indicate activation. Inputs into the enhancer include arrows to indicate an activating input, or repression, indicated by a bar input. The background of each field indicates the subnetwork operating in the micromeres (pink), NSM (purple), and endoderm (yellow and orange). Time roughly is displayed with the first events occurring at the top of the diagram, and later events occurring toward the bottom. This graphic model is from the Davidson Lab website http://sugp.caltech.edu/endomes/ and the graphic is updated periodically as new information becomes available.
Figure 3
Figure 3
Micromere GRN. This subnetwork represents specification of the skeletogenic lineage. Following initial specification at the top provided by maternal inputs, a series of transcription factors are activated sequentially. About 1 to 1.5 hrs before ingression the bottom two rows of transcription factors (Tel, Erg, Hex, Tgif, FoxN2/3, Dri, FoxB, FoxO) are activated and will control both ingression and events of PMC differentiation. Some of the genes expressing differentiation proteins are shown at the bottom of the graphic. Modified from the Davidson website.
Figure 4
Figure 4
Ingression of PMCs. (A) Diagram modified from Katow and Solursh, (1981), based on an ultrastructural analysis of ingression. The yellow cell is the PMC as seen during ingression. (B,C) Ingression as visualized from a time-lapse sequence. The (B) sequence shows fluorescent PMCs as they assume the teardrop shape and ingress into the blastocoel. The same sequence is shown in (C) with added DIC images to show where the PMCs are located during the ingression process. (D) Two images of ingression in which the plasma membranes of the embryo are labeled with expressed cadherin-GFP. Note that the ingressed PMCs have lost the cadherin from their surface. (E) an image of PMCs expressing a PMC marker (green), that have internalized cadherin (red). (F) An enlarged image of an embryo stained as in E to show the intracellular vesicles containing cadherin (red). (G,H) Two images taken 30 min apart. In (G) an antibody directed against glycosylated MSP-130 is first seen in intracellular vesicles as ingression begins (green). Thirty minutes later MSP-130 is expressed on the cell surface of all the PMCs (green) and is joined by NgCAM (red), a protein that is inserted into the PMC membrane after ingression is completed. (Miller and McClay, 1997a; Peterson and McClay, unpublished images).
Figure 5
Figure 5
Genes involved in control of ingression. In each case either a green dyed control micromere or a red-dyed morpholino-injected micromere was transferred to the vegetal pole of a control or morpholino-injected embryo. (A,G) A Snail-morpholino injected micromere (red) failed to ingress in a control embryo. (B,H) A control green micromere ingressed in an embryo that had been injected with a Snail morpholino. (C,I) Micromeres containing Twist morpholino (red) fail to ingress in a control (green) embryo. (D,J) Control micromeres ingress in an embryo containing Twist morpholino. (E,K) Control PMCs produce the skeleton in an unlabeled host embryo. (F,L) An unlabeled host embryo produces a skeleton but PMCs containing FoxN2/3 morpholino do not participate in the skeleton production. (Wu et al., 2007; Wu et al., 2008; Rho and McClay, 2011).
Figure 6
Figure 6
PMCs actively extending thin filopodia. Four frames taken approximately 10 min apart show the dynamics of thin filopodial extension and withdrawal. The four cells to the right in each frame are PMCs. During this time period a Non-skeletogenic cell wanders into the frame. Over time thin filopodia extend and shorten. The filopodia that shorten usually form a kink as they begin to shorten. (From Miller et al., 1995)
Figure 7
Figure 7
PMC patterning involves filopodial interactions with the ectoderm. (A) an antibody to both PMCs and NSM (at tip of archenteron) shows that both cells extend many thin filopodia. (B) The PMCs at the beginning of skeletogenesis stained with an antibody to MSP-130. The 64 PMCs form a ring around the archenteron and on the two sides a cluster of PMCs harbors the early triradiate skeleton. Thin filopodia are abundant at the growing tips of the skeleton. (C) An embryo producing a skeleton. Half the embryo was injected with a dye. (D) A single thin filopodium extends about 60 – 70 µm. (D) An embryo fertilized at the same time as the embryo in (B), but grown for three hours in dilute NiCl2 sufficient to radialize the embryo. The filopodia produced by the PMCs wrap around the wall of the blastocoel with some up to 150 µm in length. (F) An embryo in which the red half was injected with a truncated cadherin which prevented specification of that half of the embryo. The PMCs migrate but tend to avoid contact with the un-specified, and therefore uninformative half embryo. (Armstrong, et al., 1993; Armstrong and McClay, 1994).
Figure 8
Figure 8
PMCS use ectoderm for patterning information. On the left half the blue embryo was treated with NiCl2 and after the treatment PMCs were swapped between blue and red embryos. NiCl2-treated PMCs produce a normal skeleton if placed in a control red embryo (top skeleton). Control red PMCs produce a radialized skeleton if placed in a NiCl2-treated embryo, demonstrating that the NiCl2 effect is on the ectoderm, and the PMCs receive information for patterning from that ectoderm. On the right half the red embryos are Lytechinus variegatus and the blue embryos are Tripneustes esculentus. The top half shows the skeletons produced in control embryos of each species. On the bottom PMCs are transferred between species, and again the correct skeleton is produced in each case. Of importance, the T. esculentus skeleton includes elements not found on L. variegatus skeletons, and the ectodermal information necessary for those elements could only be delivered as positional cues. (Harden, et al., 1992; Armstrong and McClay, 1994).
Figure 9
Figure 9
VEGF and FGF are two ectodermal signals that contribute to PMC patterning. (A) VEGF is produced by the ectoderm just lateral to the two ventrolateral clusters, and in (E) The VEGF receptor is produced by the PMCs that receive the VEGF signal. (B) NiCl2-treatment radializes expression of VEGF, and correspondingly in (F) the VEGFR-expressing PMCs do not form ventrolateral clusters as the do in control embryos in (E). (C) Ectoderm produces FGF just opposite the ventrolateral clusters. Cells in (G) express FGF receptor and form ventrolateral clusters immediately beneath the cells expressing the FGF. (D) A control embryo produces a ring of cells and is initiating skeletogenesis (bright triradiate skeleton at bottom of embryo). If FGF is knocked down, as in (H) the PMCs do not form ventrolateral clusters. (I) Control larva and (J) a larva in which VEGF signaling was eliminated. (K) Control larva, and (L) a larva in which FGF signaling was eliminated.
Figure 10
Figure 10
Sea Urchin Gastrulation. (A) Primary invagination. Micromeres (red) have already ingressed into the blastocoel. At the beginning of primary invagination, cells in the vegetal plate take on a bottle cell shape (orange) helping to buckle the epithelium. (B) Secondary invagination. After the archenteron buckles the gut lengthens. Secondary mesenchyme cells at the tip of the archenteron (orange) extend filopodia and search the inside of the blastocoel. They make contact the roof of the blastocoel and stretch the archentron to its full length. Adapted from Kominami andTakata 2004
Figure 11
Figure 11
A subnetwork that helps drive restriction of hindgut differentiation state. Adapted from Cole et al. 2009.
Figure 12
Figure 12
Frizzled 5/8 and RhoA are necessary for gastrulation in Lytechinus variegatus. (A). Comparison of control embryos at late gastrula and prism stages (left, top and bottom, respectively) and embryos injected with mRNA coding for a dominant negative form of Frizzled5/8 (FzTM1, right). Inhibiting Frizzled 5/8 leads to failure to form the gut. (B) RhoA is downstream of Frizzled5/8. If embryos are co-injected with dnFrizzled5/8 (FzTM1) and mRNA for a constitutively active form of RhoA, normal development is rescued in 28% of the cases. (C). RhoA promotes gut formation. If a dominant negative form of RhoA in injected into embryos, no gut forms (even at later stages, data not shown). If a constitutively active form of RhoA is injected a precocious archenteron forms at the hatched blastula stage, at the appropriate location. (A) and (B) Adapted from Croce et al. 2006; and (C) from Beane et al. 2006).
Figure 13
Figure 13
Filopodia are not necessary for lengthening the gut up to two-thirds its final length. Ablation of filopodia on NSM cells delays archenteron lengthening. Time-lapse of an ablation experiment at the onset of archenteron elongation. (A) gastrula with archenteron at 1/3 it full length, right before the ablation. A prominent secondary mesenchyme cell is marked by an arrow. (B) immediately following the ablation; remnants of mesenchyme cells can still be seen (arrow). (C) 2h and 17min after ablation. Significant elongation has occurred. There is a normal aggregation of primary mesenchyme cells into ventrolateral clusters (large arrow). Remnants of severed filopodia ablated after the first series of laser pulses are still visible (small arrows). Adapted from Hardin 1988.
Figure 14
Figure 14
Veg 1 cells are added to the archenteron late in gastrulation. A lineage tracer labels progeny of a single Veg 1 cell (the upper daughter of the macromere division at sixth cleavage). Those Veg 1 cells reach the blastopore in panel (C) when the gut is just beginning to elongate. In (D) the gut has almost completely elongated yet the Veg 1 cells are still near the blastopore. In (E) after the gut reaches the animal pole, the Veg 1 cells enter the archenteron some of the progeny reach as far as the midgut of the archenteron.

Similar articles

Cited by

References

    1. Angerer LM, Angerer RC. Patterning the sea urchin embryo: gene regulatory networks, signaling pathways, and cellular interactions. Curr Top Dev Biol. 2003;53:159–198. - PubMed
    1. Anstrom JA. Sea urchin primary mesenchyme cells: ingression occurs independent of microtubules. Dev Biol. 1989;131:269–275. - PubMed
    1. Anstrom JA. Microfilaments, cell shape changes, and the formation of primary mesenchyme in sea urchin embryos. J Exp Zool. 1992;264:312–322. - PubMed
    1. Anstrom JA, Chin JE, Leaf DS, Parks AL, Raff RA. Localization and expression of msp130, a primary mesenchyme lineage-specific cell surface protein in the sea urchin embryo. Development. 1987;101:255–265. - PubMed
    1. Armstrong N, Hardin J, McClay DR. Cell-cell interactions regulate skeleton formation in the sea urchin embryo. Development. 1993;119:833–840. - PubMed

Publication types

LinkOut - more resources