. 2013 Sep;62(9):3251-60.
doi: 10.2337/db13-0033. Epub 2013 Jun 25.

Relaxin treatment reverses insulin resistance in mice fed a high-fat diet

Affiliations

Relaxin treatment reverses insulin resistance in mice fed a high-fat diet

Jeffrey S Bonner et al. Diabetes. 2013 Sep.

Abstract

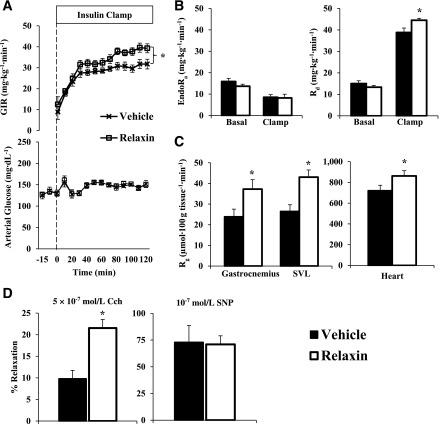
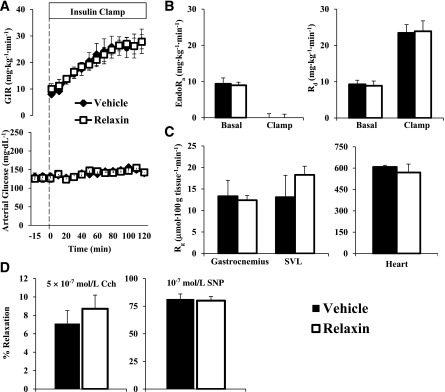
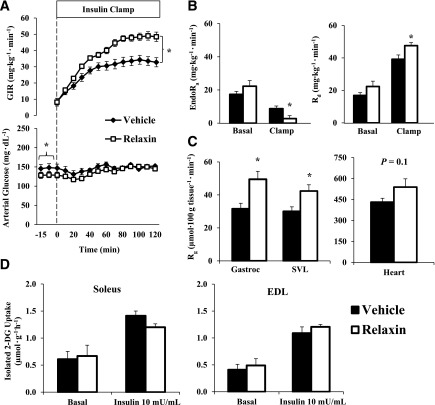
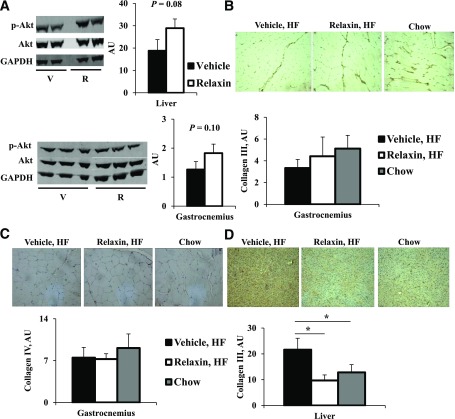
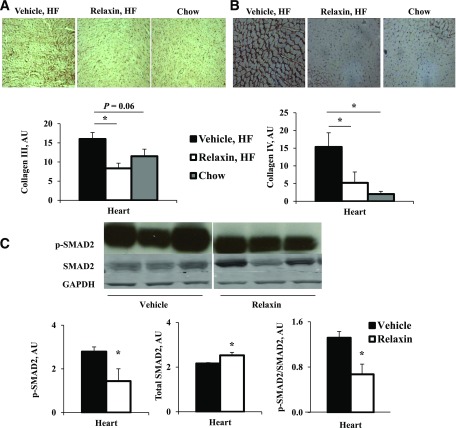
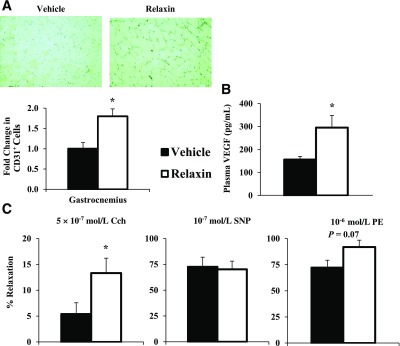
The endogenous hormone relaxin increases vascular reactivity and angiogenesis. We demonstrate that acute relaxin infusion in lean C57BL/6J mice enhances skeletal muscle perfusion and augments muscle glucose uptake during a hyperinsulinemic-euglycemic clamp. However, an acute effect was absent in mice fed a high-fat (HF) diet for 13 weeks. In contrast, mice fed an HF diet for 13 weeks and continuously treated with relaxin for the final 3 weeks of the diet exhibited decreased fasting blood glucose. Insulin-stimulated whole-body glucose disappearance and percent suppression of hepatic glucose production are corrected by chronic relaxin. The increase in peripheral glucose utilization is a result of augmented in vivo skeletal muscle glucose uptake. Relaxin intervention improves endothelial-dependent vascular reactivity and induces a two-fold proliferation in skeletal muscle capillarity. The metabolic effects of the treatment are not attributed to changes in myocellular insulin signaling. Relaxin intervention reverses the accumulation of collagen III in the liver and collagen III and collagen IV in the heart; this is induced by HF feeding. These studies show the potential of relaxin in the treatment of diet-induced insulin resistance and vascular dysfunction. Relaxin provides a novel therapeutic approach targeting the extramyocellular barriers to insulin action, which are critical to the pathogenesis of insulin resistance.


Figures

FIG. 1.
FIG. 1.
Protocol 1: chow-fed mice. Hyperinsulinemic-euglycemic clamps, glucose flux analysis, and vascular reactivity after a 6.5-h Rlx or vehicle infusion were performed in lean mice. A: Glucose infusion rate (top) and arterial glucose (bottom) during the insulin clamp. Mice were fasted 5 h before the onset of the clamp. Blood glucose was maintained at ∼150 mg/dL during steady state (80–120 min), and the time course is displayed to demonstrate quality of the clamp; 50% glucose was infused to maintain euglycemia. B: EndoRa and Rd during the insulin clamp. Basal values are an average of −15 min and −5 min, and the insulin clamp values are an average of 80–120 min (steady state). C: Rg after the insulin clamp in the gastrocnemius, SVL, and heart. D: Endothelial and smooth muscle–dependent relaxation in aortas excised from mice after the insulin clamp in response to carbachol (Cch) and sodium nitroprusside (SNP), respectively. Data are expressed as mean ± SE. n = 8–9. *P ≤ 0.05.
FIG. 2.
FIG. 2.
Protocol 1: HF-fed mice. Hyperinuslinemic-euglycemic clamps, glucose flux analysis, and vascular reactivity after a 6.5-h Rlx or vehicle infusion were performed in HF-fed mice. A: Glucose infusion rate (top) and arterial glucose (bottom) during the insulin clamp. Mice were fasted 5 h before the onset of the clamp. Blood glucose was maintained at ∼150 mg/dL during steady state (80–120 min), and the time course is displayed to demonstrate quality of the clamp; 50% glucose was infused to maintain euglycemia. B: EndoRa and Rd during the insulin clamp. Basal values are an average of −15 min and −5 min, and the insulin clamp values are an average of 80–120 min (steady state). C: Rg after the insulin clamp in the gastrocnemius, SVL, and heart. D: Endothelial and smooth muscle–dependent relaxation in aortas excised from mice after the insulin clamp in response to carbachol (Cch) and sodium nitroprusside (SNP), respectively. Data are expressed as mean ± SE. n = 5.
FIG. 3.
FIG. 3.
Protocol 2: hyperinsulinemic-euglycemic clamps, glucose flux analysis, and isolated muscle glucose uptake after the 3-week Rlx or vehicle intervention in HF-fed mice. A: Glucose infusion rate (top) and arterial glucose (bottom) during the insulin clamp. Mice were fasted 5 h before the onset of the clamp. Blood glucose was maintained at ∼150 mg/dL during steady state (80–120 min) and the time course is displayed to demonstrate quality of the clamp; 50% glucose was infused to maintain euglycemia. B: EndoRa and Rd during the insulin clamp. Basal values are an average of −15 min and −5 min, and the insulin clamp values are an average of 80–120 min (steady state). C: Rg after the insulin clamp in the gastrocnemius (gastroc), SVL, and heart. D: Isolated muscle glucose uptake on the soleus and extensor digitorum longus (EDL). Mice were fasted for 5 h before muscles were excised. Data are expressed as mean ± SE. n = 11–13. *P ≤ 0.05.
FIG. 4.
FIG. 4.
Protocol 2: insulin signaling and immunohistochemical stain of skeletal muscle and liver. Western blot analysis of the activation status of Akt (A) analyzed as the ratio of phosphorylated Akt (p-Akt) to total Akt in liver (top) and skeletal muscle (bottom) from protein extracted from mice after the insulin clamp (V, vehicle; R, relaxin). Immunohistochemical detection of skeletal muscle collagen III (B) and collagen IV (C) from the gastrocnemius muscle. Immunohistochemical detection of hepatic collagen III (D). Immunohistochemical analysis was performed on tissues fixed immediately after the insulin clamp. Data are expressed as mean ± SE. AU, arbitrary units. n = 5–6. *P ≤ 0.05.
FIG. 5.
FIG. 5.
Protocol 2: collagen protein levels and SMAD2 signaling in cardiac muscle. Immunohistochemical detection of collagen III (A) and collagen IV (B) from hearts fixed after the insulin clamp. Western blot analysis of phosphorylated SMAD2 (p-SMAD2), total SMAD2, and the ratio of p-SMAD2 to total SMAD2 (C) from cardiac protein extracts after the insulin clamp. Data are expressed as mean ± SE. AU, arbitrary units. n = 5–6. *P ≤ 0.05.
FIG. 6.
FIG. 6.
Protocol 2: capillarity density and vascular reactivity in response to the Rlx intervention. Capillary density (A) quantified with immunohistochemical staining of CD-31. Capillary density is quantified as the number of CD31+ cells. Plasma VEGF concentration (B) after the insulin clamps. Vascular reactivity (C) from excised aortas after the insulin clamps. Endothelial-dependent relaxation (left; carbachol [Cch]), smooth muscle–dependent relaxation (middle; sodium nitroprusside [SNP]), and stress generated from phenylephrine (right; PE). Responses represented as a percent of maximal tension from KCl stimulation. Data are expressed as mean ± SE. n = 5–8. *P ≤ 0.05.

References

    1. Kang L, Ayala JE, Lee-Young RS, et al. . Diet-induced muscle insulin resistance is associated with extracellular matrix remodeling and interaction with integrin alpha2beta1 in mice. Diabetes 2011;60:416–426 - PMC - PubMed
    1. Berria R, Wang L, Richardson DK, et al. . Increased collagen content in insulin-resistant skeletal muscle. Am J Physiol Endocrinol Metab 2006;290:E560–E565 - PubMed
    1. Gavin TP, Stallings HW, 3rd, Zwetsloot KA, et al. . Lower capillary density but no difference in VEGF expression in obese vs. lean young skeletal muscle in humans. J Appl Physiol 2005;98:315–321 - PubMed
    1. Chou E, Suzuma I, Way KJ, et al. . Decreased cardiac expression of vascular endothelial growth factor and its receptors in insulin-resistant and diabetic States: a possible explanation for impaired collateral formation in cardiac tissue. Circulation 2002;105:373–379 - PubMed
    1. Baron AD, Clark MG. Role of blood flow in the regulation of muscle glucose uptake. Annu Rev Nutr 1997;17:487–499 - PubMed

Publication types