. 2013 Oct;62(10):3362-72.
doi: 10.2337/db13-0501. Epub 2013 Jun 25.

Remodeling the integration of lipid metabolism between liver and adipose tissue by dietary methionine restriction in rats

Affiliations

Remodeling the integration of lipid metabolism between liver and adipose tissue by dietary methionine restriction in rats

Barbara E Hasek et al. Diabetes. 2013 Oct.

Abstract

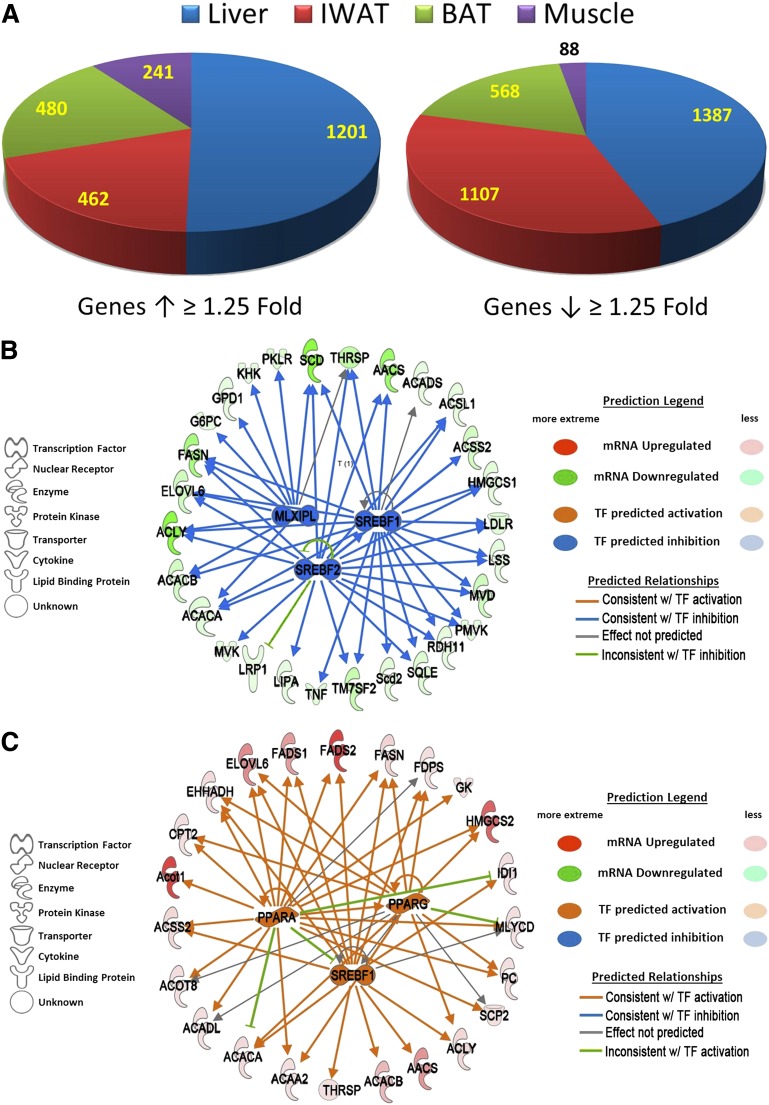
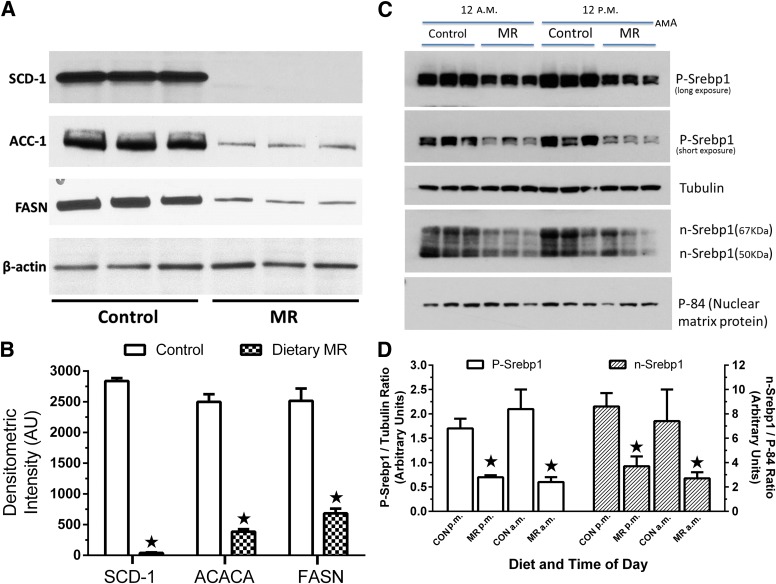
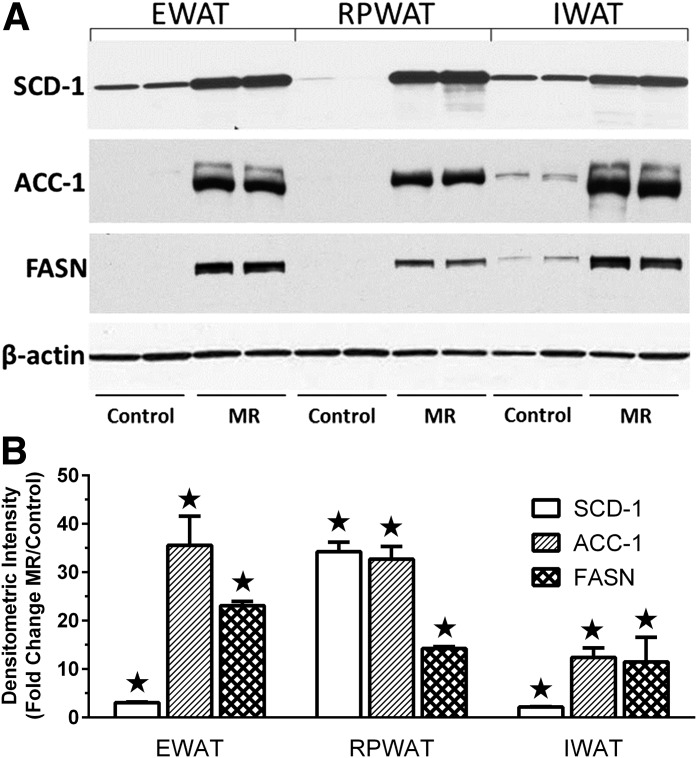
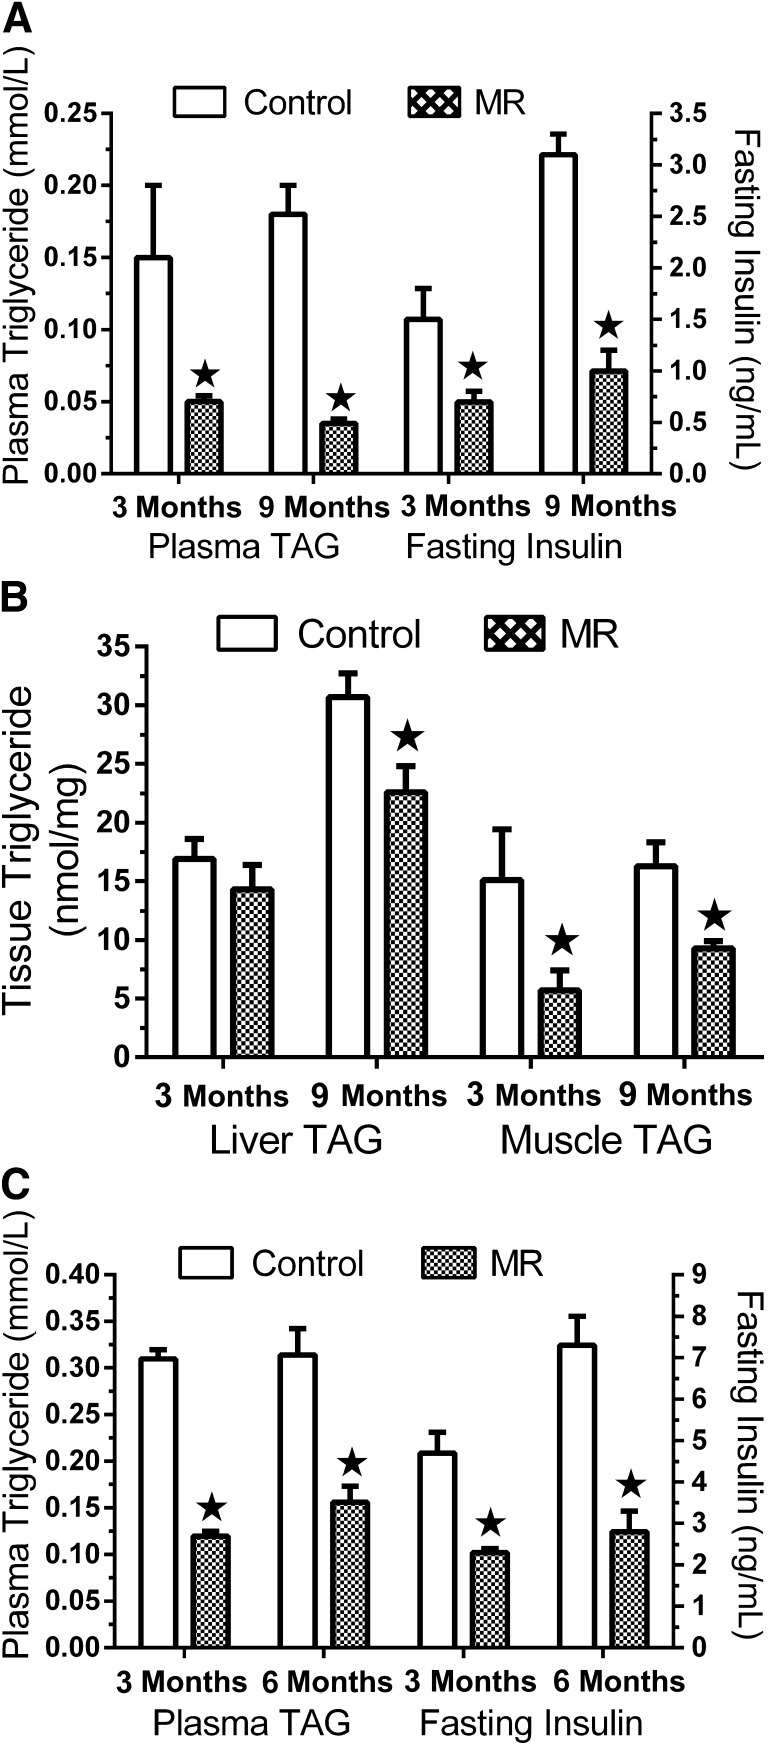
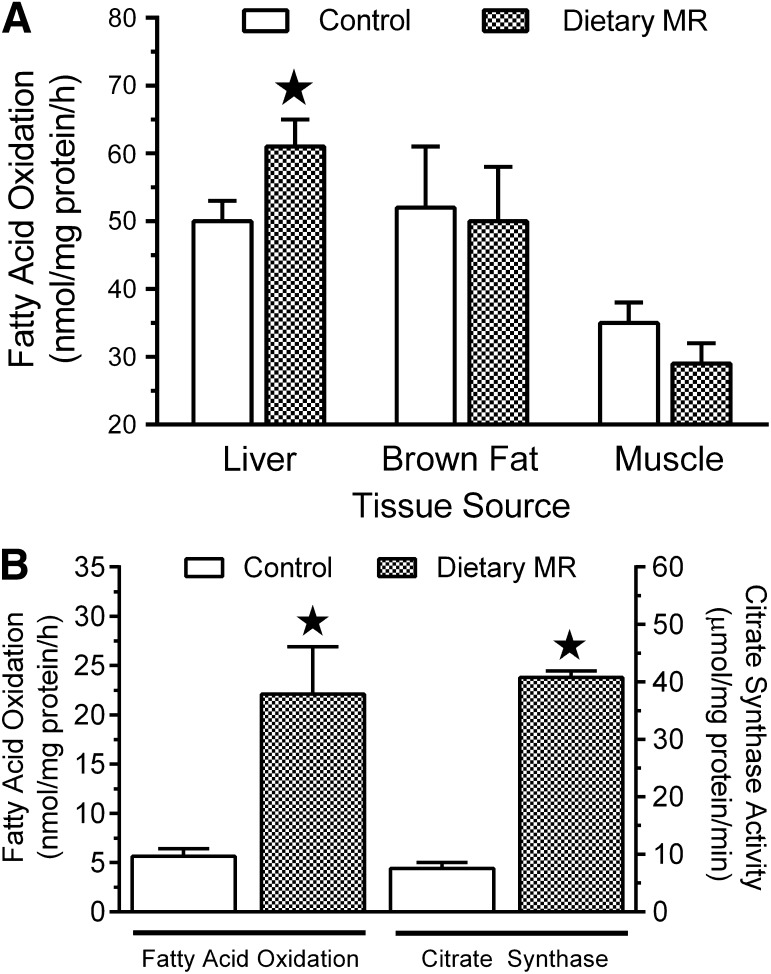
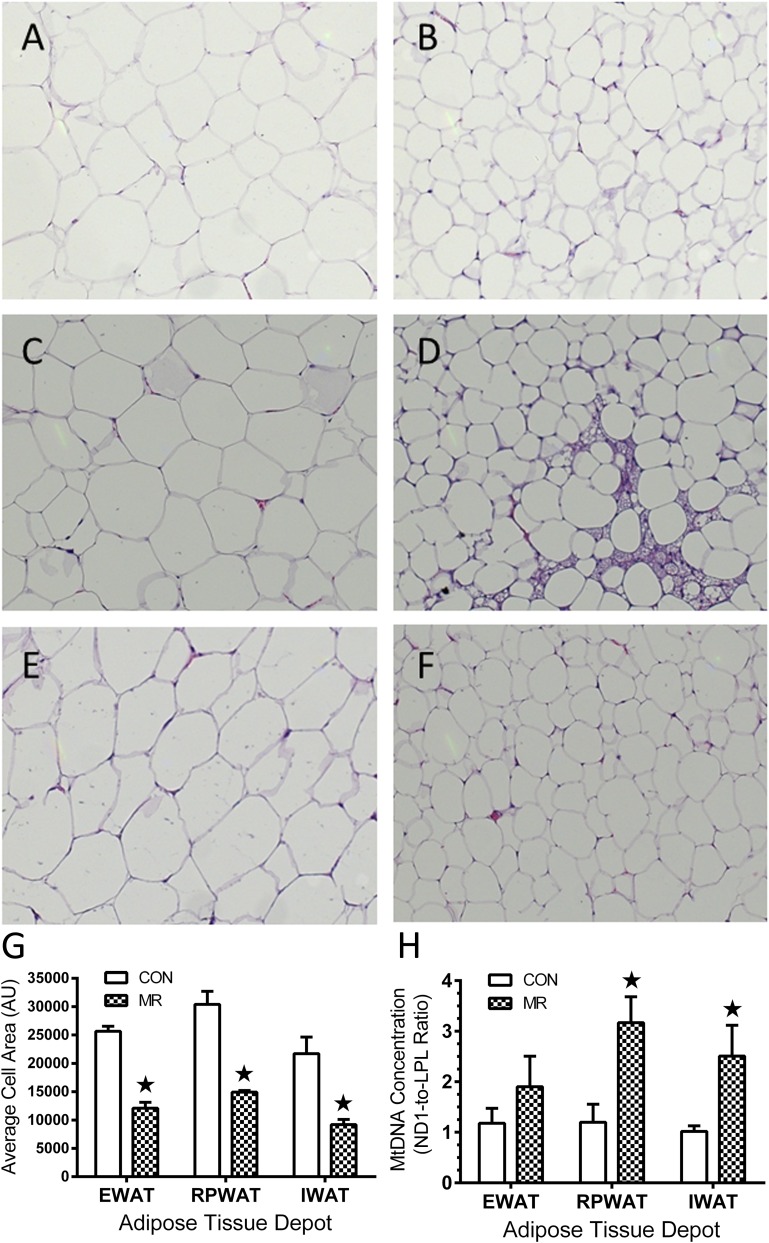
Dietary methionine restriction (MR) produces an integrated series of biochemical and physiological responses that improve biomarkers of metabolic health, limit fat accretion, and enhance insulin sensitivity. Using transcriptional profiling to guide tissue-specific evaluations of molecular responses to MR, we report that liver and adipose tissue are the primary targets of a transcriptional program that remodeled lipid metabolism in each tissue. The MR diet produced a coordinated downregulation of lipogenic genes in the liver, resulting in a corresponding reduction in the capacity of the liver to synthesize and export lipid. In contrast, the transcriptional response in white adipose tissue (WAT) involved a depot-specific induction of lipogenic and oxidative genes and a commensurate increase in capacity to synthesize and oxidize fatty acids. These responses were accompanied by a significant change in adipocyte morphology, with the MR diet reducing cell size and increasing mitochondrial density across all depots. The coordinated transcriptional remodeling of lipid metabolism between liver and WAT by dietary MR produced an overall reduction in circulating and tissue lipids and provides a potential mechanism for the increase in metabolic flexibility and enhanced insulin sensitivity produced by the diet.


Figures

FIG. 1.
FIG. 1.
Differential regulation of gene expression by dietary MR for 20 months in liver, IWAT, BAT, and muscle as assessed by microarray. A: Pie chart illustrating transcriptional effect of dietary MR by tissue. Genes were identified as differentially expressed if dietary MR increased or decreased their expression by ≥1.25-fold and P < 0.05. Upstream regulator analysis is shown of differentially expressed genes in liver (B) and IWAT (C). B: In liver, the algorithm detected coordinated downregulation of genes involved in lipid metabolism and predicted that the transcriptional network was being regulated by SREBF1, SREBF2, and MLXIPL and that the network was inhibited. C: In IWAT, the algorithm detected coordinated upregulation of genes involved in lipid metabolism. The algorithm predicted that the transcriptional network was being regulated by SREBF1, PPARα, and PPARγ and that the transcriptional activity of the network was activated. The prediction legend for panels B and C denotes the observed changes in gene expression (green to red ellipses) and predicted activation/inhibition of TFs that may explain such differences (blue and orange ellipses). The nature of the interaction between a TF and its target gene is described as follows: A blue arrow indicates that the TF normally activates the target gene and that the downregulation of the target gene is therefore consistent with TF inhibition; conversely, an orange arrow indicates target gene expression changes that are consistent with TF activation; and a gray arrow indicates that the effect of the TF on the target is not unambiguously known. A green line indicates cases where the literature-based relationship between a TF and its target (activating or inhibitory) was not matched by the expression data, leading to an inconsistent prediction of TF activation or inhibition.
FIG. 2.
FIG. 2.
Effects of 9 months of dietary MR after weaning are shown on protein expression of lipogenic genes in the liver. A: Hepatic SCD-1, ACC-1, and FASN expression was measured by Western blotting of 30 μg microsomal membranes (SCD-1) and 15 μg cytosolic extracts (ACC-1, FASN) using antibodies described in Research Design and Methods. β-Actin served as a loading control. B: Scanning densitometry was used to quantitate expression levels for each protein between groups. ★Means differ from controls at P < 0.05. C: Western blots of precursor (P-Srebp1) and nuclear forms (n-Srebp1) of SREBP-1c in hepatic extracts of rats killed in the middle of the daily dark (12:00 a.m.) and light (12:00 p.m.) cycles. Tubulin was used as a loading control for the precursor form, and P-84 was used for the nuclear form. D: Expression levels were compared by densitometry. ★Means differ from controls at P < 0.05. CON, control diet.
FIG. 3.
FIG. 3.
Effects of 9 months of dietary MR after weaning are shown on protein expression of lipogenic genes among WAT depots. A: SCD-1, ACC-1, and FASN expression in the EWAT, RPWAT, and IWAT depots were measured by Western blotting of 15 μg microsomal membranes (SCD-1) and 15 μg cytosolic extracts (ACC-1, FASN) using antibodies described in Research Design and Methods. β-Actin was measured as a loading control. B: Scanning densitometry was used to quantitate expression levels for each protein and expressed as fold-change of each protein in each depot relative to controls. ★Means differ from controls at P < 0.05.
FIG. 4.
FIG. 4.
Plasma triglyceride and insulin levels (A) and liver and muscle triglyceride levels (B) after 3 and 9 months of MR in experiment 2, and plasma triglyceride and insulin levels after 3 and 6 months of dietary MR in experiment 3 (C). Plasma was obtained from each rat at euthanasia in the respective experiments and means ± SEM are from seven to eight rats per group and time point in each experiment. ★Means differ from controls at P < 0.05.
FIG. 5.
FIG. 5.
Fatty acid oxidation in liver, BAT, and quadriceps muscle (A) and in IWAT (B) in tissues harvested at euthanasia after 9 months of MR in experiment 2. B: Citrate synthase activity was also measured in IWAT harvested from each rat. Means ± SEM were calculated from seven to eight rats per group. ★Means differ from controls at P < 0.05.
FIG. 6.
FIG. 6.
Effects of 9 months of dietary MR after weaning are shown on morphology, cell size, and mtDNA concentration in adipocytes among WAT depots. Cell size of adipocytes in hematoxylin-stained sections of epididymal (A and B), retroperitoneal (C and D), and inguinal depots (E and F) were measured in 10 fields from each section using Image J software. G: A summary of means ± SEM for each diet and depot is shown. H: The mtDNA concentration in genomic DNA isolated from each depot and diet is shown expressed as the ratio of mtDNA copy number to nuclear DNA copy number. ★Means differ from controls at P < 0.05.

Similar articles

Cited by

References

    1. Gietzen DW. Neural mechanisms in the responses to amino acid deficiency. J Nutr 1993;123:610–625 - PubMed
    1. Gietzen DW, Erecius LF, Rogers QR. Neurochemical changes after imbalanced diets suggest a brain circuit mediating anorectic responses to amino acid deficiency in rats. J Nutr 1998;128:771–781 - PubMed
    1. Koehnle TJ, Russell MC, Gietzen DW. Rats rapidly reject diets deficient in essential amino acids. J Nutr 2003;133:2331–2335 - PubMed
    1. Guo F, Cavener DR. The GCN2 eIF2alpha kinase regulates fatty-acid homeostasis in the liver during deprivation of an essential amino acid. Cell Metab 2007;5:103–114 - PubMed
    1. Cheng Y, Meng Q, Wang C, et al. Leucine deprivation decreases fat mass by stimulation of lipolysis in white adipose tissue and upregulation of uncoupling protein 1 (UCP1) in brown adipose tissue. Diabetes 2010;59:17–25 - PMC - PubMed

Publication types