. 2013 Aug 8;122(6):1017-25.
doi: 10.1182/blood-2013-04-497644. Epub 2013 Jun 25.

Potent inhibition of DOT1L as treatment of MLL-fusion leukemia

Affiliations

Potent inhibition of DOT1L as treatment of MLL-fusion leukemia

Scott R Daigle et al. Blood. .

Abstract

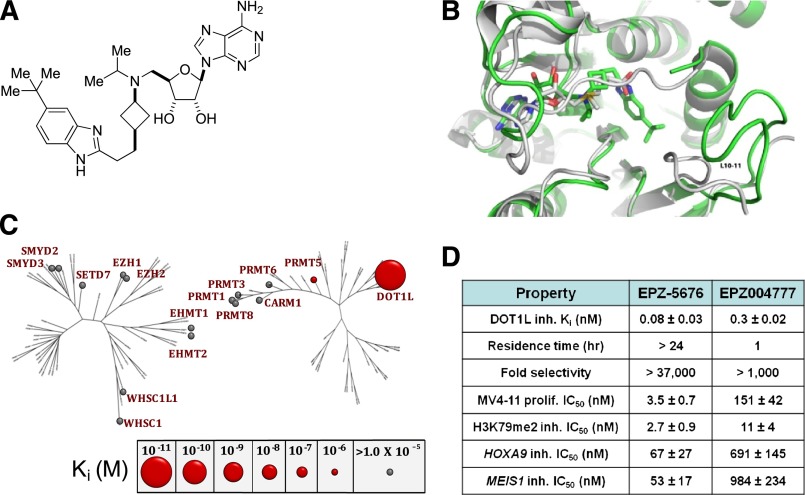
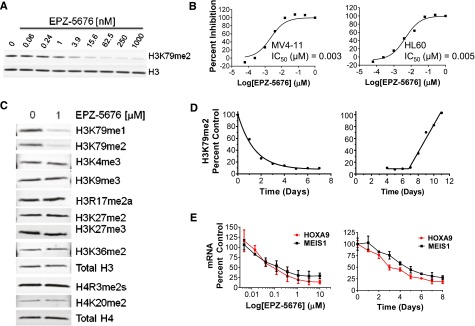
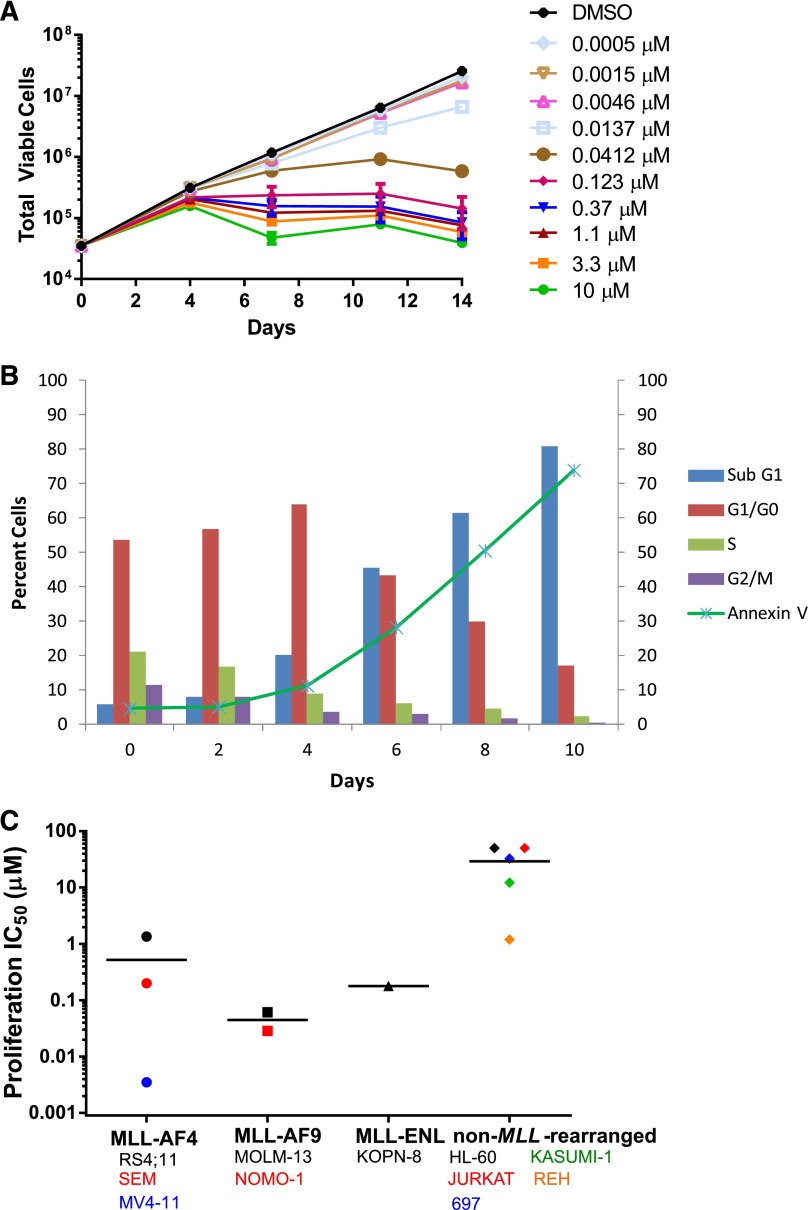
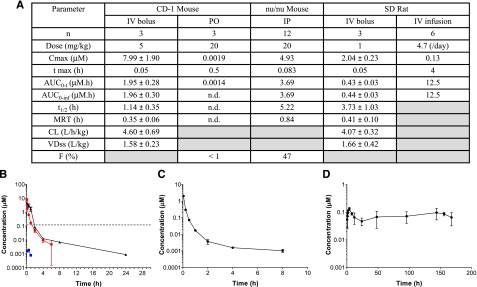
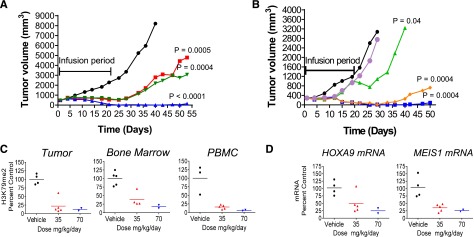
Rearrangements of the MLL gene define a genetically distinct subset of acute leukemias with poor prognosis. Current treatment options are of limited effectiveness; thus, there is a pressing need for new therapies for this disease. Genetic and small molecule inhibitor studies have demonstrated that the histone methyltransferase DOT1L is required for the development and maintenance of MLL-rearranged leukemia in model systems. Here we describe the characterization of EPZ-5676, a potent and selective aminonucleoside inhibitor of DOT1L histone methyltransferase activity. The compound has an inhibition constant value of 80 pM, and demonstrates 37 000-fold selectivity over all other methyltransferases tested. In cellular studies, EPZ-5676 inhibited H3K79 methylation and MLL-fusion target gene expression and demonstrated potent cell killing that was selective for acute leukemia lines bearing MLL translocations. Continuous IV infusion of EPZ-5676 in a rat xenograft model of MLL-rearranged leukemia caused complete tumor regressions that were sustained well beyond the compound infusion period with no significant weight loss or signs of toxicity. EPZ-5676 is therefore a potential treatment of MLL-rearranged leukemia and is under clinical investigation.


Figures

Figure 1
Figure 1
Structure, binding, and inhibitory activity of EPZ-5676. (A) Chemical structure of EPZ-5676. (B) Superposition of DOT1L-EPZ-5676 (green) and DOT1L-SAM (gray; Protein Data Base accession number 3QOW). To accommodate the extended hydrophobic tail of the inhibitor, significant rearrangement of the protein is required, including the loop between β-strands 10 and 11 (L10-11). Details on the interactions between the protein and compound and the induced changes caused by EPZ-5676 binding are shown in supplemental Figure 1. (C) Selectivity profile of EPZ-5676 inhibitory activity against representative members of the lysine (left) and arginine (right) enzyme families. The diameter of the sphere for each enzyme is directly related to the magnitude of inhibition by EPZ-5676. Larger circles correlate to increased potency; gray circles indicate no measurable inhibition up to 10 µM of EPZ-5676. (D) Comparison of EPZ-5676 and EPZ004777 potency, selectivity, and cell-based activity. The enzyme inhibition Ki values for EPZ004777 and EPZ-5676 in DOT1L enzymatic assays are listed (n = 3; mean values ± SD are shown). Residence time for each compound is listed and was calculated as the reciprocal of the enzymatic-ligand dissociation rate as determined by surface plasmon resonance. Also listed are inhibitory activities for both compounds in MV4-11 proliferation assays (n = 3 [EPZ-5676] or n = 2 [EPZ004777]; mean values ± SD are shown), MV4-11 cell H3K79me2 ELISA assays (n = 2; mean values ± SD are shown) and MV4-11 cell HOXA9 and MEIS1 qRT-PCR assays (n = 2; mean values ± SD are shown).
Figure 2
Figure 2
Inhibition of histone methylation and MLL-fusion target gene expression by EPZ-5676. (A) Immunoblot analysis of H3K79me2 levels in histones extracted from MV4-11 cells treated for 4 days with increasing concentrations of EPZ-5676. (B) Concentration-dependent inhibition of H3K79 methylation in MV4-11 (left) and HL60 (right) cells following 4-day EPZ-5676 treatment as measured by quantitative ELISA assay for H3K79me2. (C) Immunoblot analysis of histones extracted from MV4-11 cells treated for 4 days with either 1 µM EPZ-5676 or vehicle control and probed with a panel of specific methyl-lysine and methyl-arginine antibodies. Total H3 and H4 antibodies were used as the loading controls. (D) Time course of cellular H3K79me2 depletion in MV4-11 cells incubated in the presence of 1 µM EPZ-5676 (left). The diminution of intracellular H3K79me2 as a function of time after dosing with EPZ-5676 was fit to a simple exponential decay function that included a non-zero limit at infinite time, as described. Time course of recovery of H3K79me2 levels in MV4-11 cells upon removal of EPZ-5676 from the culture medium following a 4-day incubation (right). In both plots, H3K79me2 levels are normalized to total H3 and expressed as a percent of DMSO-treated (control) cells at each time point. Recovery of intracellular H3K79me2 levels following compound washout displayed a significant lag phase before semilinear recovery. These data were fit to a modified version of the expolinear function for crop growth as a function of photon interception and leaf area. The amount of H3K79me2 at any given time after compound washout (y) was fit as y = ymin +[(v/a)ln{1 + exp(a(t-tlag))}], where ymin is the non-zero limit of H3K79me2 at the start of the washout experiment, v is the velocity of the linear phase of recovery, and a is a constant of proportionality for our purposes. (E) Concentration dependent inhibition of HOXA9 and MEIS1 transcription by EPZ-5676 as measured by qRT-PCR in MV4-11 cells following 6 days of treatment (left; n = 2, mean ± SD are shown). Time course of inhibition of HOXA9 and MEIS1 mRNA expression as measured by qRT-PCR in MV4-11 cells incubated in the presence of 1 µM EPZ-5676 (right). Relative mRNA expression is plotted as a percentage of those at day 0 (n = 2; mean values ± SD are shown).
Figure 3
Figure 3
Selective inhibition of MLL-rearranged cell proliferation by EPZ-5676. (A) Inhibition of the proliferation of MV4-11 cells following 14-day treatment with the indicated concentrations of EPZ-5676 (n = 3, mean ± SD are shown). (B) Effect of treatment of MV4-11 cells with 1 μM EPZ-5676 on cell-cycle phase and apoptosis over time as measured by staining for DNA content and Annexin V. (C) EPZ-5676 selectively kills acute leukemia cell lines harboring MLL fusions. IC50 values for inhibition of proliferation are plotted for each cell line following 14 days of exposure to increasing concentrations of EPZ-5676 (n = 2, mean value is shown, apart from MV4-11, where n = 3). Cell lines are grouped according to MLL status and horizontal lines represent the mean IC50 value for each group. IC50 values are also listed along with IC90 values in supplemental Table 2.
Figure 4
Figure 4
The preclinical pharmacokinetics of EPZ-5676 determined in mouse and rat. (A) Table of EPZ-5676 pharmacokinetic parameters as determined in mouse and rat. All values reported as mean ± standard deviation (SD) with exception of mouse IP and rat IV infusion study where nonserial, sparse blood sampling was used. In this case, all values are means. Pharmacokinetic data analysis was performed using noncompartmental analysis and WinNonlin Phoenix v6.2 software. Calculated pharmacokinetic parameters show high clearance (CL) in both species with low oral bioavailability and high intraperitoneal bioavailability in mouse (the latter calculated using the IV area under the curve [AUC] from CD-1 mouse). Volume of distribution at steady state (VDss) was greater than total body water of 0.7 L/kg in both species. Terminal half-lives (t1/2) ranged from 1 to 5 hours depending on the route of administration, whereas mean residence times (MRT) were short, ranging from 0.35 to 0.84 hours. Cmax, the maximum plasma concentration, is determined at time tmax. AUC0-t and AUC0-inf are the areas under the curve to the last measurable data point and extrapolated to infinity, respectively. Data are shown graphically as (B) concentration vs time profile of mean ± SD (n = 3) plasma concentrations following IV bolus (5 mg/kg, red line) and PO (20 mg/kg, blue line) administrations to CD-1 mouse as well as IP (20 mg/kg, black line) administration to NCr nu/nu mouse (all formulated in 10% ethanol:90% saline). The dotted line represents the EPZ-5676 concentration required to completely block proliferation of MV4-11 cells in vitro (Fig. 2C); (C) concentration vs time profile of mean ± SD (n = 3) plasma concentrations following IV bolus (1 mg/kg formulated in 0.4% hydroxypropyl-β-cyclodextrin in saline) administration to Sprague-Dawley rat; (D) concentration vs time profile of mean ± SD (n = 3) plasma concentrations following IV infusion (4.7 mg/kg per day for 7 days formulated in 10% PEG400:90% saline) administration to Sprague-Dawley rat (elimination phase data after 168 hours not shown for clarity). F, absolute bioavailability.
Figure 5
Figure 5
EPZ-5676 causes tumor regressions and demonstrates in vivo target inhibition in tumor and surrogate tissue in a rat model of MLL-rearranged leukemia. (A) Effect of EPZ-5676 administration on the growth of MV4-11 xenograft tumors implanted SC in immunocompromised rats. Rats were dosed continuously by IV infusion with vehicle (black line), with EPZ-5676 at 70 mg/kg/day (blue line), 35 mg/kg/day (red line), or for 8 hours daily at 67 mg/kg per day (green line) for 21 days. Median tumor sizes are plotted for each group (n = 10). Tumor growth in individual animals is shown in supplemental Figure 3. Significant P values of P ≤ .0005, calculated using a repeated-measures analysis of variance (ANOVA) and Dunnett posttest, were determined between the vehicle and all 3 treated groups. (B) Effect of additional EPZ-5676 dose and schedules on MV4-11 xenograft tumor growth. Significant tumor growth inhibition was observed in rats treated with 70 mg/kg per day EPZ-5676 by continuous IV infusion for 14 (orange line) or 21 days (blue line) (P = .0004, repeated-measures ANOVA with a Dunnett posttest). Treatment with 70 mg/kg per day continuously for 7 days followed by 14 days at 33.5 mg/kg per day infused for 8 hours daily (green line) led to weak, but statistically significant tumor growth inhibition (P = .04, repeated-measures ANOVA with a Dunnett posttest). A final group dosed for 21 days with 33.5 mg/kg per day infused for 8 hours daily (purple line) showed no tumor growth inhibition when compared with the vehicle control. Median tumor sizes are plotted for each group (vehicle [n = 9], 70 mg/kg per day, 21-day infusion [n = 9], 70 mg/kg per day, 14-day infusion [n = 10], 70 mg/kg per day, 7-day infusion, then 14 days at 33.5 mg/kg per day infused for 8 hours daily [n = 9], 33.5 mg/kg per day, 21 days infused for 8 hours daily [n = 10]). Tumor growth in individual animals is shown in supplemental Figure 4. (C) H3K79me2 levels in tumor tissue, PBMCs, and bone marrow cells harvested from nude rats dosed continuously by IV infusion for 14 days with vehicle or EPZ-5676 at 35 and 70 mg/kg per day. H3K79me2 levels were determined in acid extracted histones by ELISA (tumor, bone marrow) or quantitated immunoblot of whole cell lysates (PBMCs). H3K79me2 levels were normalized to those of total histone H3 in the same sample and are plotted as a percent of the mean H3K79me2 level in tissue from the vehicle-treated (control) group, which is set at 100%. Horizontal lines represent the mean percent H3K79me2 values for each group. (D) Reduced expression of MLL-fusion target genes HOXA9 and MEIS1 measured by qRT-PCR of RNA extracted from tumor tissue harvested from rats dosed continuously by IV infusion for 14 days with EPZ-5676 at 35 and 70 mg/kg per day. HOXA9 or MEIS1 transcript levels are plotted as a percent of the mean transcript level in tumors from the vehicle-treated (control) group, which is set at 100%. Horizontal lines represent the mean percent transcript level in each group.

References

    1. Hess JL. MLL: a histone methyltransferase disrupted in leukemia. Trends Mol Med. 2004;10(10):500–507. - PubMed
    1. Krivtsov AV, Armstrong SA. MLL translocations, histone modifications and leukaemia stem-cell development. Nat Rev Cancer. 2007;7(11):823–833. - PubMed
    1. Muntean AG, Hess JL. The pathogenesis of mixed-lineage leukemia. Annu Rev Pathol. 2012;7:283–301. - PMC - PubMed
    1. Tamai H, Inokuchi K. 11q23/MLL acute leukemia: update of clinical aspects. J Clin Exp Hematop. 2010;50(2):91–98. - PubMed
    1. Ayton PM, Chen EH, Cleary ML. Binding to nonmethylated CpG DNA is essential for target recognition, transactivation, and myeloid transformation by an MLL oncoprotein. Mol Cell Biol. 2004;24(23):10470–10478. - PMC - PubMed

MeSH terms