. 2013 Jun 20:4:110.
doi: 10.3389/fgene.2013.00110. eCollection 2013.

Modeling regulatory cascades using Artificial Neural Networks: the case of transcriptional regulatory networks shaped during the yeast stress response

Affiliations

Modeling regulatory cascades using Artificial Neural Networks: the case of transcriptional regulatory networks shaped during the yeast stress response

Maria E Manioudaki et al. Front Genet. .

Abstract

Over the last decade, numerous computational methods have been developed in order to infer and model biological networks. Transcriptional networks in particular have attracted significant attention due to their critical role in cell survival. The majority of network inference methods use genome-wide experimental data to search for modules of genes with coherent expression profiles and common regulators, often ignoring the multi-layer structure of transcriptional cascades. Modeling methodologies on the other hand assume a given network structure and vary significantly in their algorithmic approach, ranging from over-simplified representations (e.g., Boolean networks) to detailed -but computationally expensive-network simulations (e.g., with differential equations). In this work we use Artificial Neural Networks (ANNs) to model transcriptional regulatory cascades that emerge during the stress response in Saccharomyces cerevisiae and extend in three layers. We confine the structure of the ANNs to match the structure of the biological networks as determined by gene expression, DNA-protein interaction and experimental evidence provided in publicly available databases. Trained ANNs are able to predict the expression profile of 11 target genes across multiple experimental conditions with a correlation coefficient >0.7. When time-dependent interactions between upstream transcription factors (TFs) and their indirect targets are also included in the ANNs, accurate predictions are achieved for 30/34 target genes. Moreover, heterodimer formation is taken into account. We show that ANNs can be used to (1) accurately predict the expression of downstream genes in a 3-layer transcriptional cascade based on the expression of their indirect regulators and (2) infer the condition- and time-dependent activity of various TFs as well as during heterodimer formation. We show that a three-layer regulatory cascade whose structure is determined by co-expressed gene modules and their regulators can successfully be modeled using ANNs with a similar configuration.

Keywords: Artificial Neural Networks; asynchronous regulation; heterodimers; three layers regulatory cascades; transcriptional regulatory networks; yeast stress response.


Figures

Figure 1
Figure 1
Representative example of a regulatory cascade. The regulatory cascade that is formed based on module 20 in Category A (heat shock). The module, as derived from GRAM, consists of seven genes (YLL006W, YDR043C, YML127W, YFL067W, YLL005C, YLL003W, and YJL225C) which are regulated by the transcription factors FKH2 and NDD1. While the biological cascade is common for all genes, a different ANN is trained/validated/tested based on the expression of every target gene in the module. Most of these genes are implicated in the stress response as evidenced from their MIPS annotation (Mewes et al., 1997).
Figure 2
Figure 2
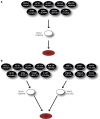
Flow chart of the proposed method. (A) Left panel: Gene expression data from microarray studies and DNA-binding data (ChIP-chip) are used as input to the GRAM algorithm in order to identify gene modules and their regulators. Middle panel: Bibliographical information from public databases is used to add another layer of regulators and build the three-layer regulatory cascade. Right panel: ANNs with the same structure as the biological cascade are built and trained to predict the expression of the target gene given the expression of the upper-layer regulators. (B) The basic scheme was extended to include additional biological aspects such as time-delays among the expression of a transcription factor and the expression of the target gene and formation of heterodimers.
Figure 3
Figure 3
Schematic example of how the TF-delay table is constructed. Assume a category that consists of two conditions, with n1 and n2 time points, respectively (black and white rectangles), and a module that, for simplicity, is regulated by two upper-layer TFs (black and gray circles). The condition with the smallest number of time points is n1 so this will be the “leading” condition. Imagine that the target gene is expressed at time point n1 = 4 (This ranges from 1 to 4, since the expression profile of the gene is also shifted in time). Every TF is allowed to be expressed at the time points 1, 2, 3, and 4 (k represents the steps that each TF is shifted). (A) Both TFs are expressed at time point 1 (k = 0). (B) The first (black) TF is expressed at time point 2 (k = 1) while the second (gray) at time point 1 (k = 0). (C) The first (black) TF is expressed at time point 3 (k = 2) while the second (gray) at time point 4 (k = 3).
Figure 4
Figure 4
Correlation coefficient (CC) distributions for Synchronous and Asynchronous ANNs. ANN models which consider asynchronous interactions (white) achieve significantly higher performance (larger CC values) than synchronous ANNs (black).
Figure 5
Figure 5
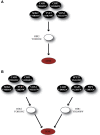
Regulatory cascades containing the TF BAS1 as the GRAM-identified regulator. (A) Regulatory cascade where only BAS1 is considered as a regulator. (B) Regulatory cascade where BAS1 as well as PHO2 are considered as regulators of the target gene. These cascades are found in all three stress categories but correspond to different gene modules as identified by the GRAM algorithm.
Figure 6
Figure 6
Pie charts showing the grouped correlation coefficients (CC) of the ANN models in the three stress categories. (A) Results correspond to genes in modules regulated by BAS1 alone. Successful ANNs (CC > 0.7) are found only for stress conditions in Category A (heat shock). (B) Results correspond to genes in modules regulated by the BAS1-PHO2 dimer. In this case, there is a significant increase in the correlation coefficient of ANNs over all three stress categories.
Figure 7
Figure 7
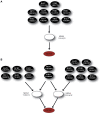
Regulatory cascades containing the TF HIR2 as the GRAM-identified regulator. (A) Regulatory cascade where only HIR2 is considered as regulator. (B) Regulatory cascade where HIR2 and HIR1 are considered as regulators of the target gene.
Figure 8
Figure 8
Pie charts that show the grouped correlation coefficients (CC) of the ANN models in the three stress categories. (A) Results correspond to genes in modules regulated by HIR2 alone. ANNs with CC > 0.7 are only seen in Category A (heat shock). For Category C in particular, the correlation coefficient for all genes is very low (CC < 0.5). (B) Results correspond to genes in modules regulated by HIR2 and HIR1. In this case the ANN performance is slightly improved in all three categories.
Figure 9
Figure 9
Regulatory cascades containing the TF MSN4 as the GRAM-identified regulator. (A) Regulatory cascade where only MSN4 is considered as a regulator. (B) Regulatory cascade where MSN4 and MSN2 are considered as regulators of the target gene.
Figure 10
Figure 10
Pie charts that show the grouped correlation coefficients (CC) of the ANN models in the three stress categories. (A) Results correspond to genes in modules regulated by MSN4 alone. ANNs with CC > 0.7 are only seen in Category A (heat shock) whereas no good predictions were found in categories B and C. (B) Results that correspond to genes in modules regulated by MSN4 and MSN2. In this case the ANN performance is improved in all three categories, with Category A having the majority of the successful ANNs, in agreement with experimental evidence.
Figure 11
Figure 11
Correlation coefficients of the normal and shuffled data. Bars show the mean and standard deviation of the correlation coefficients achieved by all ANN models when either the normal (white) or randomly shuffled (black) expression profiles for the target gene where used to train the models.

Similar articles

Cited by

References

    1. Amoutzias G. D., Robertson D. L., Van De Peer Y., Oliver S. G. (2008). Choose your partners: dimerization in eukaryotic transcription factors. Trends Biochem. Sci. 33, 220–229 10.1016/j.tibs.2008.02.002 - DOI - PubMed
    1. Archambault J., Friesen J. D. (1993). Genetics of eukaryotic RNA polymerases I, II, and III. Microbiol. Rev. 57, 703–724 - PMC - PubMed
    1. Bammert G. F., Fostel J. M. (2000). Genome-wide expression patterns in Saccharomyces cerevisiae: comparison of drug treatments and genetic alterations affecting biosynthesis of ergosterol. Antimicrobial Agents Chemother. 44, 1255–1265 10.1128/AAC.44.5.1255-1265.2000 - DOI - PMC - PubMed
    1. Bar-Joseph Z., Gerber G. K., Lee T. I., Rinaldi N. J., Yoo J. Y., Robert F., et al. (2003). Computational discovery of gene modules and regulatory networks. Nat. Biotechnol. 21, 1337–1342 10.1038/nbt890 - DOI - PubMed
    1. Benayoun B. A., Veitia R. A. (2009). A post-translational modification code for transcription factors: sorting through a sea of signals. Trends Cell Biol. 19, 189–197 10.1016/j.tcb.2009.02.003 - DOI - PubMed

LinkOut - more resources