

Worldwide, mortality risk is high soon after initiation of hemodialysis
- PMID: 23802192
- PMCID: PMC3877739
- DOI: 10.1038/ki.2013.252
Worldwide, mortality risk is high soon after initiation of hemodialysis
Abstract
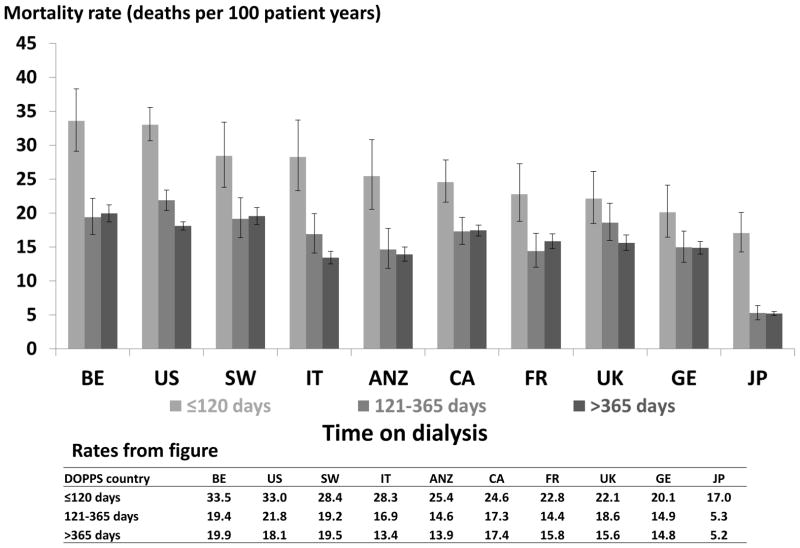
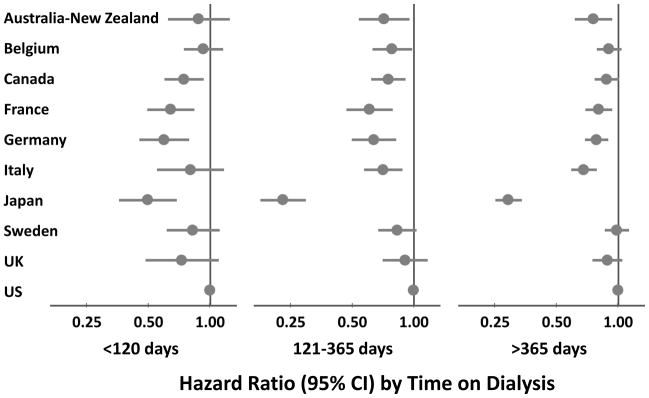
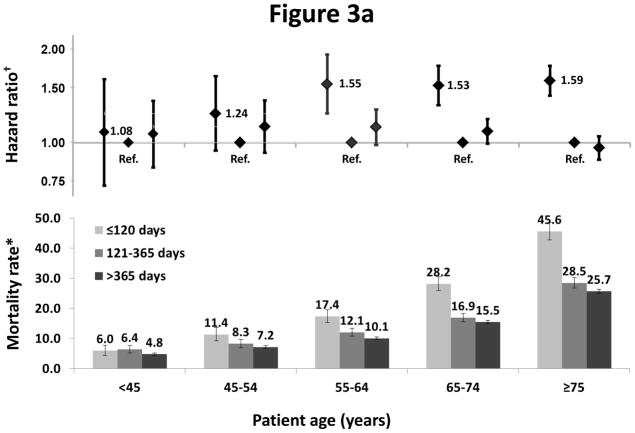
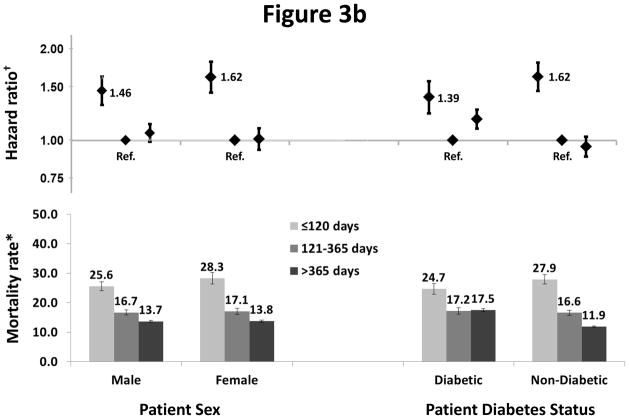
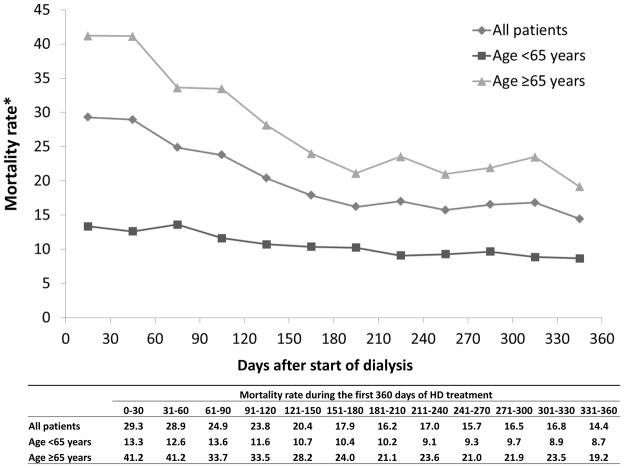
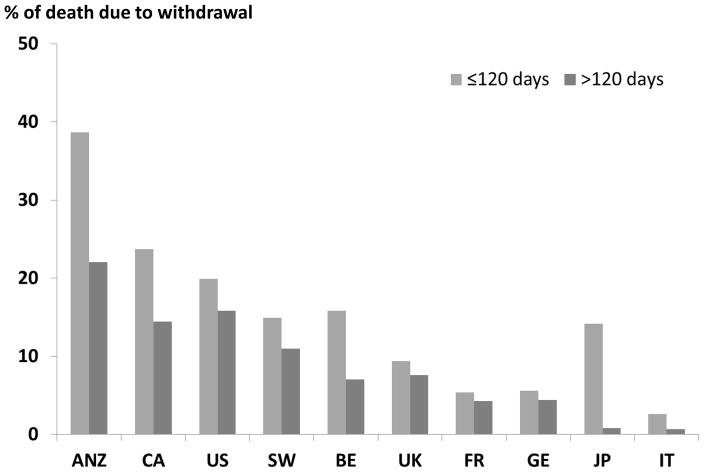
Mortality rates for maintenance hemodialysis patients are much higher than the general population and are even greater soon after starting dialysis. Here we analyzed mortality patterns in 86,886 patients in 11 countries focusing on the early dialysis period using data from the Dialysis Outcomes and Practice Patterns Study, a prospective cohort study of in-center hemodialysis. The primary outcome was all-cause mortality, using time-dependent Cox regression, stratified by study phase adjusted for age, sex, race, and diabetes. The main predictor was time since dialysis start as divided into early (up to 120 days), intermediate (121-365 days), and late (over 365 days) periods. Mortality rates (deaths/100 patient-years) were 26.7 (95% confidence intervals 25.6-27.9), 16.9 (16.2-17.6), and 13.7 (13.5-14.0) in the early, intermediate, and late periods, respectively. In each country, mortality was higher in the early compared to the intermediate period, with a range of adjusted mortality ratios from 3.10 (2.22-4.32) in Japan to 1.15 (0.87-1.53) in the United Kingdom. Adjusted mortality rates were similar for intermediate and late periods. The ratio of elevated mortality rates in the early to the intermediate period increased with age. Within each period, mortality was higher in the United States than in most other countries. Thus, internationally, the early hemodialysis period is a high-risk time for all countries studied, with substantial differences in mortality between countries. Efforts to improve outcomes should focus on the transition period and the first few months of dialysis.
Conflict of interest statement
DISCLOSURES
Drs. Bradbury and Ng work in the Center for Observational Research at Amgen, Inc.
Bruce Robinson, Jinyao Zhang, Keith McCullough, Francesca Tentori, and Ronald Pisoni are employees of Arbor Research Collaborative for Health. The DOPPS is administered by Arbor Research Collaborative for Health and is supported by scientific research grants from Amgen (since 1996), Kyowa Hakko Kirin (since 1999, in Japan), Sanofi Renal (since 2009), Abbott (since 2009), Baxter (since 2011), and Vifor Fresenius Renal Pharma (since 2011), without restrictions on publications.
Francesca Tentori is supported by award number 1K01DK087762-01A1 from the National Institute of Diabetes And Digestive And Kidney Diseases.
Hal Morgenstern has no conflicts of interest.
Brenda Gillespie has no conflicts of interest.
Raymond Hakim has no conflicts of interest.
Hugh Rayner has no conflicts of interest.
Joan Fort has no conflicts of interest.
Tadao Akizawa has received speaker’s fees and research grants from Kyowa Hakko Kirin.
Figures
Comment in
-
Increased mortality early after dialysis initiation: a universal phenomenon.Kidney Int. 2014 Jan;85(1):12-4. doi: 10.1038/ki.2013.316. Kidney Int. 2014. PMID: 24380902
References
-
- U S Renal Data System, USRDS. Annual Data Report: Atlas of Chronic Kidney Disease and End-Stage Renal Disease in the United States. National Institutes of Health, National Institute of Diabetes and Digestive and Kidney Diseases; Bethesda, MD: 2011.
-
- Bradbury BD, Fissell RB, Albert JM, et al. Predictors of early mortality among incident US hemodialysis patients in the Dialysis Outcomes and Practice Patterns Study (DOPPS) Clin J Am Soc Nephrol. 2007;2:89–99. - PubMed
-
- Caskey F, Dawnay A, Farrington K, Feest T, Fogarty D, Inward C, Tomson CRV. Report Nephron Clinical Practice. UK Renal Registry 2010; 13th Annual Report of the Renal Association; Bristol, UK: UK Renal Registry; 2011. 2010.
-
- Khan IH, Catto GR, Edward N, et al. Death during the first 90 days of dialysis: a case control study. Am J Kidney Dis. 1995 Feb;25(2):276–80. - PubMed
-
- Garcia-Garcia G, Deddens JA, D’Achiardi-Rey R, et al. Results of Treatment in Patients with End-Stage Renal Disease: A Multivariate Analysis of Risk Factors and Survival in 341 Successive Patients. Am J Kidney Dis. 1985 Jan;1(5):10–18. - PubMed
Publication types
MeSH terms
Grants and funding
LinkOut - more resources
Full Text Sources
Other Literature Sources
Medical
