

Effects of hepatocyte nuclear factor-1A and -4A on pancreatic stone protein/regenerating protein and C-reactive protein gene expression: implications for maturity-onset diabetes of the young
- PMID: 23803251
- PMCID: PMC3707779
- DOI: 10.1186/1479-5876-11-156
Effects of hepatocyte nuclear factor-1A and -4A on pancreatic stone protein/regenerating protein and C-reactive protein gene expression: implications for maturity-onset diabetes of the young
Abstract
Background: There is a significant clinical overlap between patients with hepatocyte nuclear factor (HNF)-1A and HNF4A maturity-onset diabetes of the young (MODY), two forms of monogenic diabetes. HNF1A and HNF4A are transcription factors that control common and partly overlapping sets of target genes. We have previously shown that elevated serum pancreatic stone protein / regenerating protein A (PSP/reg1A) levels can be detected in subjects with HNF1A-MODY. In this study, we investigated whether PSP/reg is differentially regulated by HNF1A and HNF4A.
Methods: Quantitative real-time PCR (qPCR) and Western blotting were used to validate gene and protein expression in cellular models of HNF1A- and HNF4A-MODY. Serum PSP/reg1A levels and high-sensitivity C-reactive protein (hsCRP) were measured by ELISA in 31 HNF1A- and 9 HNF4A-MODY subjects. The two groups were matched for age, body mass index, diabetes duration, blood pressure, lipid profile and aspirin and statin use.
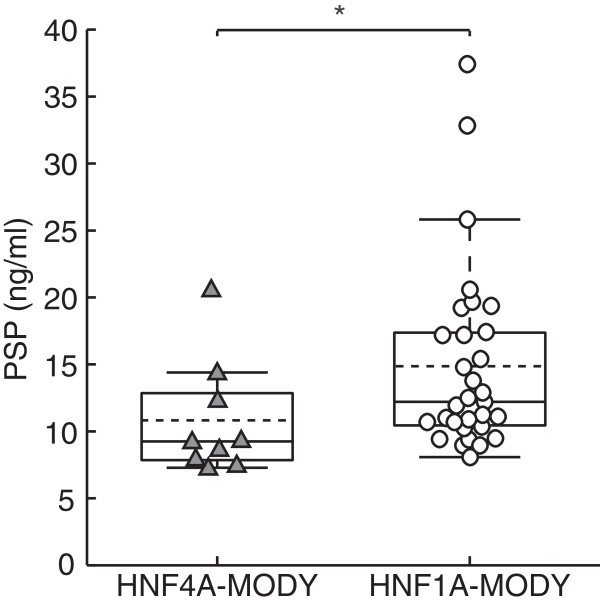
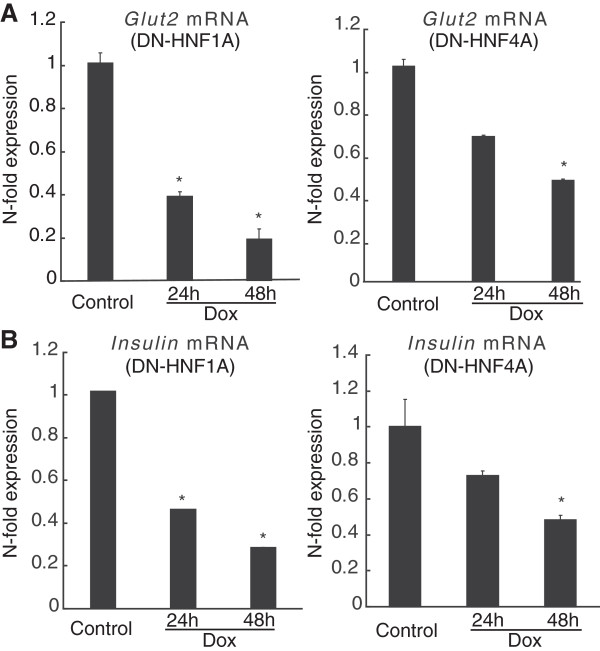
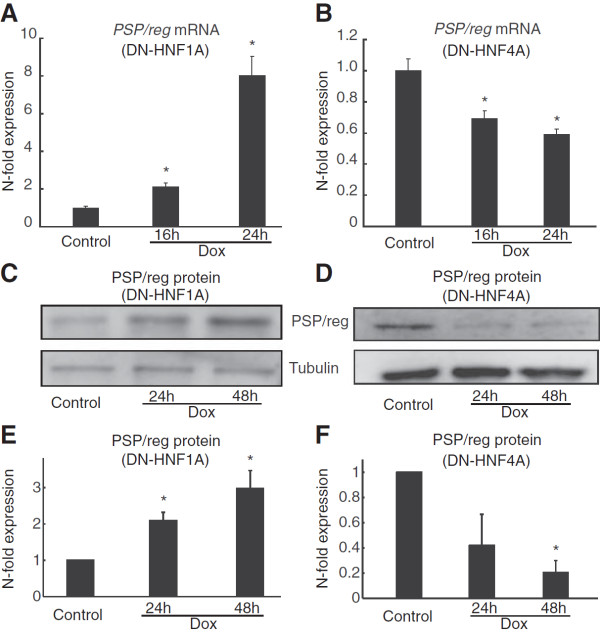
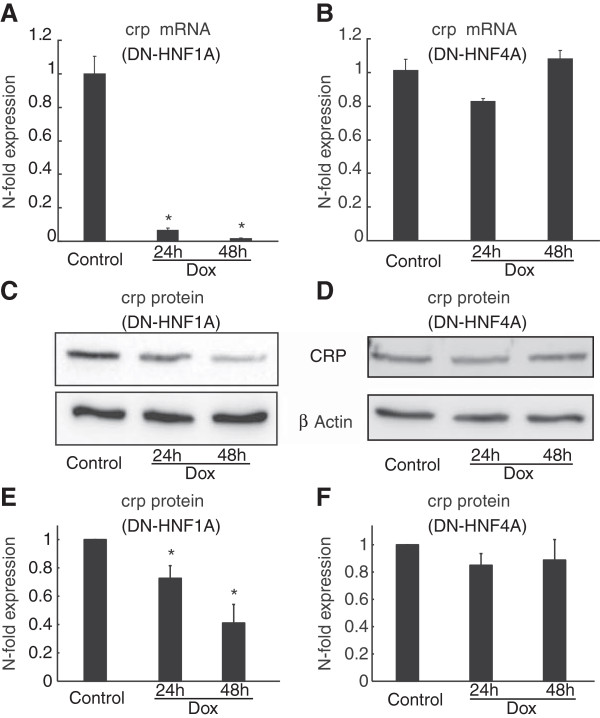
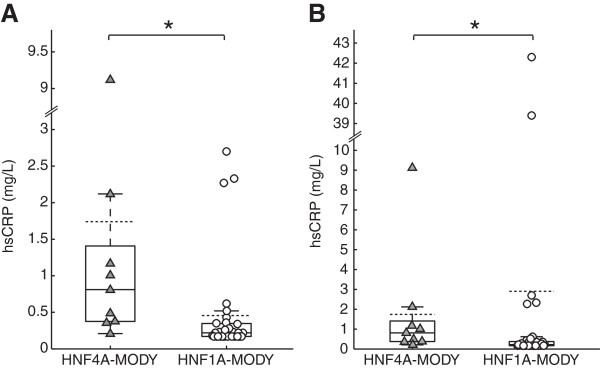
Results: Inducible repression of HNF1A and HNF4A function in INS-1 cells suggested that PSP/reg induction required HNF4A, but not HNF1A. In contrast, crp gene expression was significantly reduced by repression of HNF1A, but not HNF4A function. PSP/reg levels were significantly lower in HNF4A subjects when compared to HNF1A subjects [9.25 (7.85-12.85) ng/ml vs. 12.5 (10.61-17.87) ng/ml, U-test P = 0.025]. hsCRP levels were significantly lower in HNF1A-MODY [0.22 (0.17-0.35) mg/L] compared to HNF4A-MODY group [0.81 (0.38-1.41) mg/L, U-test P = 0.002], Parallel measurements of serum PSP/reg1A and hsCRP levels were able to discriminate HNF1A- and HNF4A-MODY subjects.
Conclusion: Our study demonstrates that two distinct target genes, PSP/reg and crp, are differentially regulated by HNF1A and HNF4A, and provides clinical proof-of-concept that serum PSP/reg1A and hsCRP levels may distinguish HNF1A-MODY from HNF4A-MODY subjects.
Figures
Similar articles
-
Serum levels of pancreatic stone protein (PSP)/reg1A as an indicator of beta-cell apoptosis suggest an increased apoptosis rate in hepatocyte nuclear factor 1 alpha (HNF1A-MODY) carriers from the third decade of life onward.BMC Endocr Disord. 2012 Jul 18;12:13. doi: 10.1186/1472-6823-12-13. BMC Endocr Disord. 2012. PMID: 22808921 Free PMC article.
-
INS-1 cells undergoing caspase-dependent apoptosis enhance the regenerative capacity of neighboring cells.Diabetes. 2010 Nov;59(11):2799-808. doi: 10.2337/db09-1478. Epub 2010 Aug 3. Diabetes. 2010. PMID: 20682686 Free PMC article.
-
Urinary C-peptide creatinine ratio is a practical outpatient tool for identifying hepatocyte nuclear factor 1-{alpha}/hepatocyte nuclear factor 4-{alpha} maturity-onset diabetes of the young from long-duration type 1 diabetes.Diabetes Care. 2011 Feb;34(2):286-91. doi: 10.2337/dc10-1293. Diabetes Care. 2011. PMID: 21270186 Free PMC article. Clinical Trial.
-
Half-Life of Sulfonylureas in HNF1A and HNF4A Human MODY Patients is not Prolonged as Suggested by the Mouse Hnf1a(-/-) Model.Curr Pharm Des. 2015;21(39):5736-48. doi: 10.2174/1381612821666151008124036. Curr Pharm Des. 2015. PMID: 26446475 Review.
-
Insights from basic adjunctive examinations of GCK-MODY, HNF1A-MODY, and type 2 diabetes: A systemic review and meta-analysis.J Diabetes. 2023 Jun;15(6):519-531. doi: 10.1111/1753-0407.13390. Epub 2023 May 24. J Diabetes. 2023. PMID: 37226652 Free PMC article.
Cited by
-
The Association between High-Sensitivity C-Reactive Protein and Metabolic Syndrome in an Elderly Population Aged 50 and Older in a Community Receiving Primary Health Care in Taiwan.Int J Environ Res Public Health. 2022 Oct 12;19(20):13111. doi: 10.3390/ijerph192013111. Int J Environ Res Public Health. 2022. PMID: 36293692 Free PMC article.
-
Disruption of Tumor Suppressors HNF4α/HNF1α Causes Tumorigenesis in Liver.Cancers (Basel). 2021 Oct 26;13(21):5357. doi: 10.3390/cancers13215357. Cancers (Basel). 2021. PMID: 34771521 Free PMC article. Review.
-
Impact of high-sensitivity C-reactive protein on metabolic syndrome in an elderly population: Findings from a hospital-based cross-sectional study in J&K, India.J Family Med Prim Care. 2024 Oct;13(10):4173-4180. doi: 10.4103/jfmpc.jfmpc_888_23. Epub 2024 Oct 18. J Family Med Prim Care. 2024. PMID: 39629444 Free PMC article.
-
Mutations on a conserved distal enhancer in the porcine C-reactive protein gene impair its expression in liver.Front Immunol. 2023 Sep 14;14:1250942. doi: 10.3389/fimmu.2023.1250942. eCollection 2023. Front Immunol. 2023. PMID: 37781386 Free PMC article.
-
Regenerating 1 and 3b gene expression in the pancreas of type 2 diabetic Goto-Kakizaki (GK) rats.PLoS One. 2014 Feb 26;9(2):e90045. doi: 10.1371/journal.pone.0090045. eCollection 2014. PLoS One. 2014. PMID: 24587207 Free PMC article.
References
-
- Frayling TM, Evans JC, Bulman MP, Pearson E, Allen L, Owen K, Bingham C, Hannemann M, Shepherd M, Ellard S, Hattersley AT. Beta-cell genes and diabetes: molecular and clinical characterization of mutations in transcription factors. Diabetes. 2001;50(Suppl 1):S94–S100. - PubMed
Publication types
MeSH terms
Substances
LinkOut - more resources
Full Text Sources
Other Literature Sources
Medical
Research Materials
Miscellaneous
