. 2013 Aug 9;288(32):23380-93.
doi: 10.1074/jbc.M113.470542. Epub 2013 Jun 26.

Plasma membrane calcium ATPase activity is regulated by actin oligomers through direct interaction

Affiliations

Plasma membrane calcium ATPase activity is regulated by actin oligomers through direct interaction

Marianela G Dalghi et al. J Biol Chem. .

Abstract

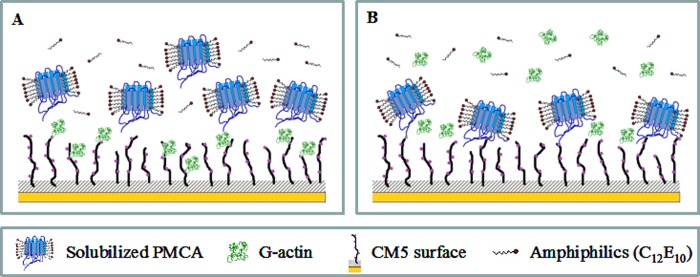
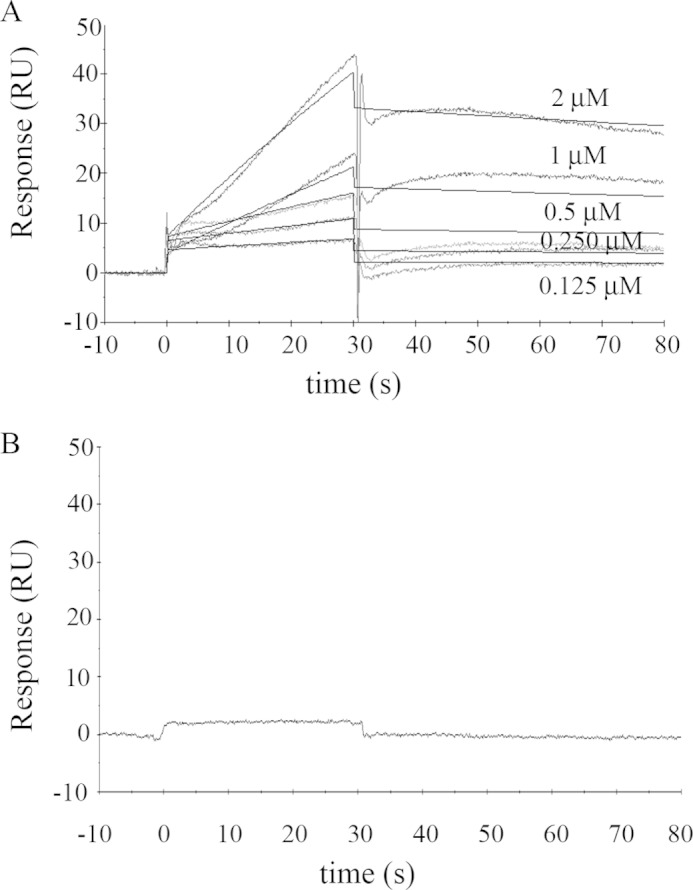
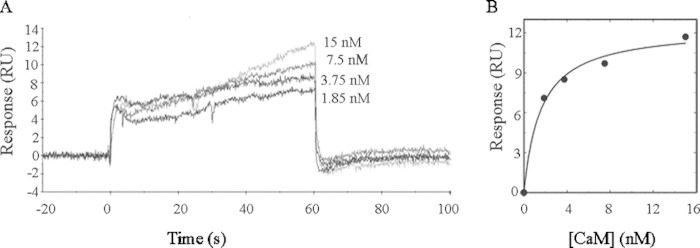
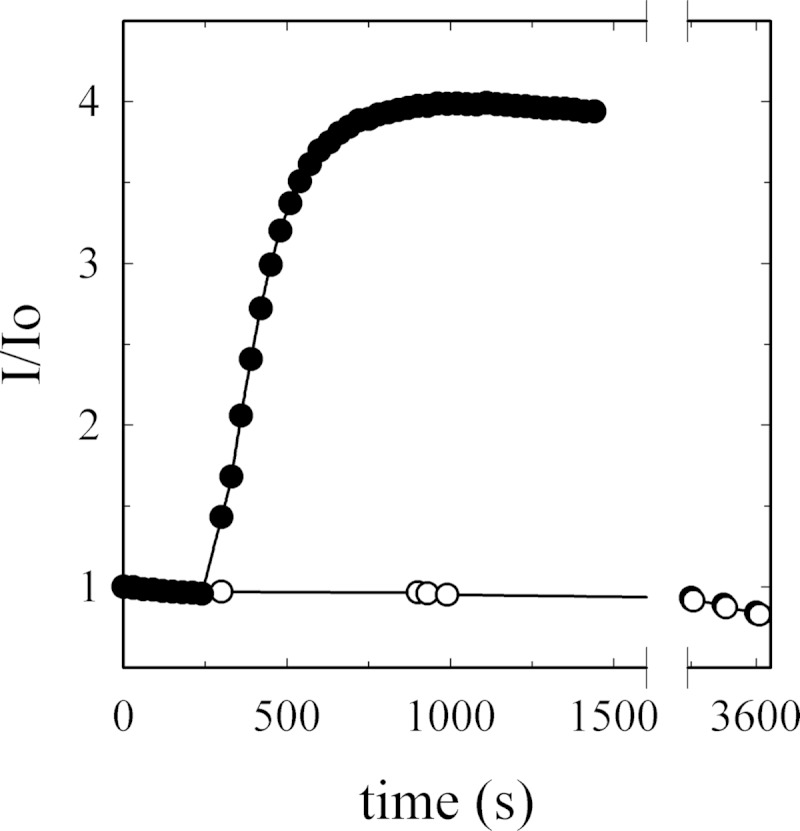
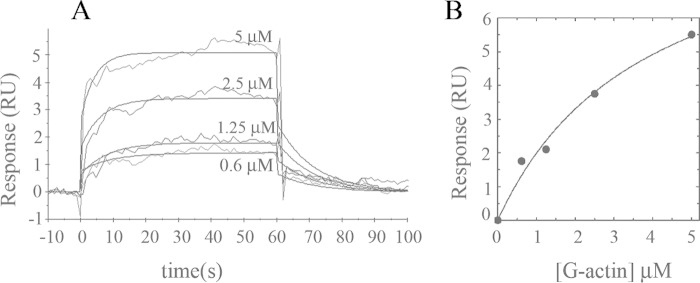
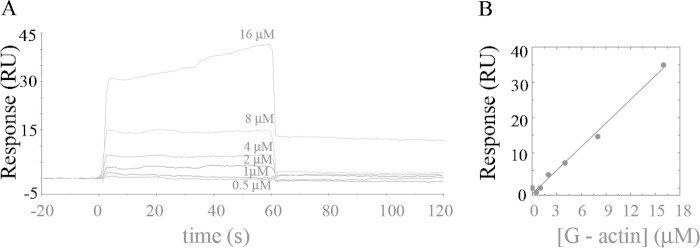
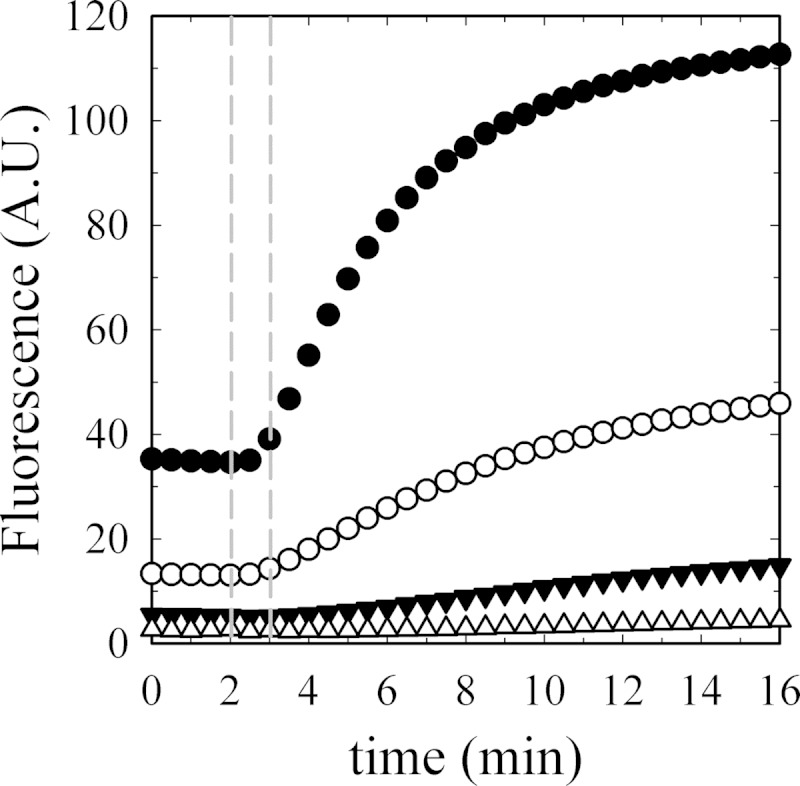
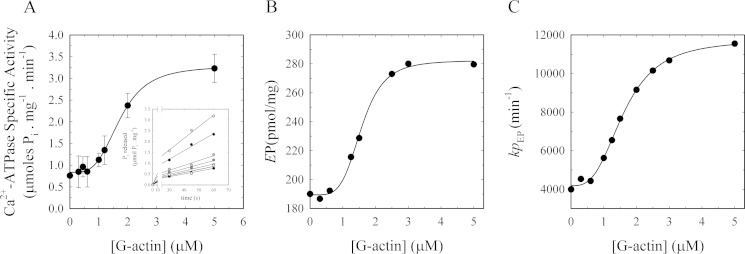
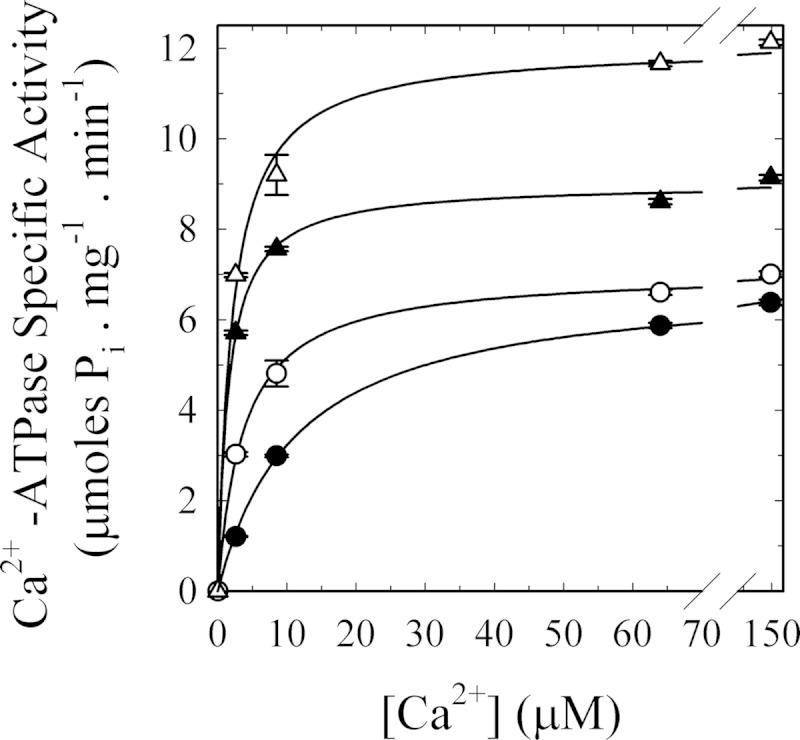
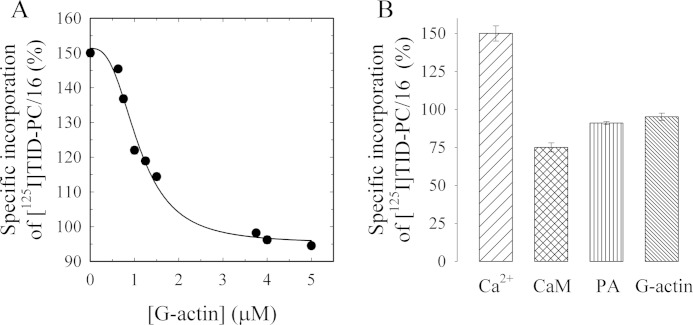
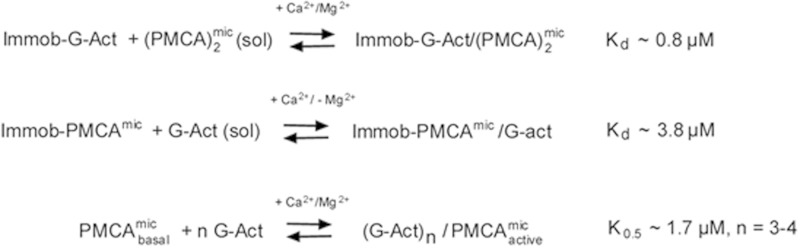
As recently described by our group, plasma membrane calcium ATPase (PMCA) activity can be regulated by the actin cytoskeleton. In this study, we characterize the interaction of purified G-actin with isolated PMCA and examine the effect of G-actin during the first polymerization steps. As measured by surface plasmon resonance, G-actin directly interacts with PMCA with an apparent 1:1 stoichiometry in the presence of Ca(2+) with an apparent affinity in the micromolar range. As assessed by the photoactivatable probe 1-O-hexadecanoyl-2-O-[9-[[[2-[(125)I]iodo-4-(trifluoromethyl-3H-diazirin-3-yl)benzyl]oxy]carbonyl]nonanoyl]-sn-glycero-3-phosphocholine, the association of PMCA to actin produced a shift in the distribution of the conformers of the pump toward a calmodulin-activated conformation. G-actin stimulates Ca(2+)-ATPase activity of the enzyme when incubated under polymerizing conditions, displaying a cooperative behavior. The increase in the Ca(2+)-ATPase activity was related to an increase in the apparent affinity for Ca(2+) and an increase in the phosphoenzyme levels at steady state. Although surface plasmon resonance experiments revealed only one binding site for G-actin, results clearly indicate that more than one molecule of G-actin was needed for a regulatory effect on the pump. Polymerization studies showed that the experimental conditions are compatible with the presence of actin in the first stages of assembly. Altogether, these observations suggest that the stimulatory effect is exerted by short oligomers of actin. The functional interaction between actin oligomers and PMCA represents a novel regulatory pathway by which the cortical actin cytoskeleton participates in the regulation of cytosolic Ca(2+) homeostasis.

Keywords: ATPases; Actin; Calcium; Calmodulin; Cytoskeleton; Transport.


Figures

SCHEME 1.
SCHEME 1.
Binding analysis between PMCA and G-actin using the SPR technique. A, binding of solubilized PMCA to immobilized G-actin. G-actin is covalently attached to the CM5 sensor by reactive NH2 groups using the conventional protocol for activating the carboxyl groups of the surface. Solubilized PMCAs constitute the flowing analyte. C12E10 monomers are in equilibrium with micelles. B, binding of G-actin to immobilized PMCA. Covalently attached PMCA is stabilized on the sensor surface through continuous addition of C12E10. Immobilization is carried out using the same amine coupling procedure described above. G-actin constitutes the flowing analyte and is maintained in the monomeric state by using a running buffer of low ionic strength without Mg2+.
FIGURE 1.
FIGURE 1.
Binding of solubilized human erythrocyte PMCA to immobilized G-actin. A, representative sensorgram of PMCA binding to immobilized G-actin obtained for different PMCA concentrations in the range of 0.125 to 2 μm. G-actin immobilization level was ∼ 800 RU. The running buffer consisted of a low ionic strength Tris-HCl buffer with 70 μm Ca2+ and 0.005% C12E10 to maintain PMCA solubilized in micelles. The time for the association phase was set to 30 s. Steady state for binding interaction was not attained, and therefore a kinetic analysis was carried out. Curves were corrected for bulk effects by simple subtraction of the corresponding control sensorgrams. The dark gray lines represent the experimental curves, and the continuous black lines are the corresponding fits. B, representative sensorgram of PMCA (0.75 μm) injected in a running buffer devoid of Ca2+ by the addition of 2 mm EGTA shows no binding interaction. All other running conditions were identical to those in A. Note that human erythrocyte PMCA corresponds mostly to isoform PMCA4b (see under “Materials and Methods”).
FIGURE 2.
FIGURE 2.
Calmodulin binding to immobilized PMCA. A, human erythrocyte PMCA at an immobilization level of ∼1000 RU was stabilized on the sensor surface in C12E10 micelles. Immediately after immobilization, a buffer containing 0.005% C12E10 was injected. Calmodulin was injected in the range 1.8–15 nm in a buffer composed of 20 mm MOPS-KOH (pH 7.2 at 25 °C), 120 mm KCl, 1 mm MgCl2, 0.005% C12E10, and 70 μm Ca2+ at a flow rate of 30 μl/min for 60 s. B, nonlinear analysis of the binding response obtained in the SPR assays was performed using a 1:1 interaction fit. The Kd values that best fit the experimental data were 1.6 ± 0.3 nm.
FIGURE 3.
FIGURE 3.
G-actin monomer stability during surface plasmon resonance analysis. G-actin tendency to aggregate or polymerize was assessed by measuring the fluorescence signal associated with pyrene-actin during incorporation into a filament (λex = 365 ± 3; λem = 407 ± 10, in nm). The fluorescence signal of 10 μm G-actin, containing 6% pyrene-label (○), was measured in a medium composed of 2 mm Tris-HCl (pH 7.7 at 25 °C), 70 μm CaCl2, and 0.005% C12E10. No changes in the intensity of fluorescence could be detected during 1 h. The slightly negative slope represents pyrene bleaching. As a positive control of actin polymerization, a 10× polymerization buffer was added to another aliquot of the preparation (●). The data are displayed as I/I0 (fluorescence signal at time t divided by initial fluorescence).
FIGURE 4.
FIGURE 4.
Binding of G-actin to immobilized PMCA isolated from human erythrocytes. A, representative sensorgram of G-actin binding to immobilized PMCA at an immobilization level of ∼1000 RU is shown. PMCA was stabilized on the sensor surface in a micellar environment provided by the extraction detergent C12E10. Immediately after immobilization, a buffer containing 0.005% C12E10 was injected. G-actin was assayed in the range 0.6–5 μm in a modified Buffer G supplemented with 0.005% C12E10. The time for the association phase was set to 60 s. Curves were corrected for bulk effects by simple subtraction of the corresponding control sensorgrams. B, binding interaction analyzed from the kinetic global fit assuming a 1:1 interaction fit. The Kd values that best fit the experimental data were 3.8 ± 1.2 μm. Dark gray lines represent the experimental curves, and continuous black lines are the corresponding fits.
FIGURE 5.
FIGURE 5.
Binding of G-actin to immobilized C28 peptide. A, representative sensorgram of G-actin binding to immobilized C28 peptide at an immobilization level of ∼650 RU is shown. G-actin was assayed in the range 0.5–16 μm in a modified Buffer G (2 mm Tris-HCl, 70 μm Ca2+, pH 7.7 at 25 °C). The time for the association phase was set to 60 s. Curves were corrected for bulk effects by simple subtraction of the corresponding control sensorgrams. B, nonspecific binding of G-actin to the C28 peptide.
FIGURE 6.
FIGURE 6.
Time course of actin polymerization in Ca2+-ATPase and EP experiments. Actin polymerization (6% pyrene-label) was measured as a function of G-actin concentration as follows: ●, 5.00; ○, 2.50; ▾, 1.25; and Δ, 0.62 μm final concentrations. The first 120 s show the base-line signals that are different for each actin concentration because the percentage of label is constant and therefore not the total amount. Polymerization was initiated as described under “Materials and Methods” at 120 s. Data were collected every 30 s. The range between the two vertical dashed lines shows the time window used to perform Ca2+-ATPase activity experiments and phosphoenzyme level determinations.
FIGURE 7.
FIGURE 7.
Effect of actin on the Ca2+-ATPase activity and phosphorylated intermediates in isolated human erythrocyte PMCA during early stages of actin polymerization. A, Ca2+-ATPase activity was measured in PMCA reconstituted in DMPC/C12E10-mixed micelles in the presence of increasing amounts of purified G-actin. The reaction was started by the addition of [32P]ATP to a final concentration of 30 μm concomitant with the addition of G-actin. Each point represents the slope ± S.E. of the Pi released (inset) during 1 min after initiation of the reaction. The continuous line corresponds to the plot of Equation 2 as the best fit to the experimental data. Inset, Ca2+-dependent Pi release as a function of time for increasing concentrations of G-actin; data are from three independent experiments. B, effect of actin on the phosphoenzyme levels. Intermediate levels of PMCA reconstituted in DMPC/C12E10-mixed micelles as a function of G-actin concentration were measured 1 min after initiating the reaction in a medium of identical composition as for the experiment in A. The reaction was started by the addition of [32P]ATP to a final concentration of 30 μm concomitant with the addition of G-actin. The continuous line corresponds to the plot of Equation 2 as the best fit to the experimental data. C, turnover (kpEP) of the phosphoenzyme was calculated as the ratio between the Ca2+-ATPase activity taken from A and the EP values obtained in B at the different G-actin concentrations. The continuous line corresponds to the plot of Equation 2 as the best fit to the experimental data.
FIGURE 8.
FIGURE 8.
[Ca2+] dependence of G-actin effect on human erythrocyte PMCA Ca2+-ATPase activity. Ca2+-ATPase activity was measured at different [Ca2+] in the presence of the following: 100 nm calmodulin (▴) as a positive control for PMCA activation; 5 μm G-actin (○); 100 nm calmodulin plus 5 μm G-actin (Δ), or buffer (●) as the basal condition. The reaction was started by the addition of 2 mm ATP concomitant with the addition of the effector/buffer. The reaction medium contained 120 mm KCl, 30 mm MOPS-K (pH 7.4 at 25 °C), 3.75 mm MgCl2, 70 μg/ml C12E10, 10 μg/ml phosphatidylcholine, 1 mm EGTA, and enough CaCl2 to give the desired final [Ca2+]free. PMCA concentration was 0.8 μg/ml. Pi release was determined by the continuous method of Webb (46). Values are the mean ± S.E. from three different experiments. When not apparent, error bars are within the symbols. The values of K0.5 and Vmax for the different treatments are as follows: basal conditions 11.4 ± 0.4 μm and 6.9 ± 0.1 μmol of Pi·mg−1·min−1, respectively; addition of 100 nm CaM 1.5 ± 0.1 μm and 9.0 ± 0.1 μmol of Pi·mg−1·min−1, respectively; addition of 5 μm G-actin 3.7 ± 0.2 μm and 7.1 ± 0.1 μmol of Pi·mg−1·min−1, respectively; addition of 100 nm CaM plus 5 μm G-actin 2.1 ± 0.3 μm and 12.1 ± 0.3 μmol of Pi·mg−1·min−1, respectively.
FIGURE 9.
FIGURE 9.
PMCA conformational change induced by G-actin measured as the relative incorporation of [125I]TID-PC/16 to PMCA. A, purified human erythrocyte PMCA was incubated with [125I]TID-PC/16 as described under “Materials and Methods” after which purified G-actin was added at different concentrations. The reaction medium contained 70 μm Ca2+. After 1 min of actin addition, the reaction was stopped by exposing the samples to a UV light source. Data are the mean ± S.E. of two independent experiments. The continuous line corresponds to the best fitted parameters of Equation 3 to the experimental data. B, effect of saturating concentrations of 120 nm CaM, 10 μm phosphatidic acid, and 5 μm actin on the incorporation of [125I]TID-PC/16 to purified PMCA. As expected for a calmodulin-like activator, the specific incorporation of [125I]TID-PC/16 decreased with actin from near 150% to a value of 95.1 ± 2.4%, although CaM and phosphatidic acid (PA) decreased the specific incorporation to 76 ± 1 and 89 ± 2%, respectively.
SCHEME 2.
SCHEME 2.
Summary of G-actin-PMCA interactions determined by SPR and activity measurements. Top, interaction of immobilized G-actin (immob-G-Act) with soluble PMCA dimers in micelles ((PMCA)2mic(sol)), determined by SPR in the presence of Ca2+ and Mg2+. The calculated Kd was ∼0.8 μm. Middle, interaction of immobilized micellar PMCA with soluble G-actin in the presence of Ca2+ but absence of Mg2+. The Kd determined by SPR was ∼3.8 μm. Bottom, stimulation of the basal ATPase activity of the micellar PMCA (PMCAmicbasal) by G-actin in the presence of Ca2+ and Mg2+. The K0.5 is ∼1.7 μm and n = 3–4 G-actin monomers/PMCA are required for activation. For details, see the text.
FIGURE 10.
FIGURE 10.
PMCA sequences corresponding to the acidic phospholipid binding domains. Amino acid number: a, 342 for hPMCA2xb, 373 for hPMCA2wb, and 328 for hPMCA2zb; b, 347 for hPMCA3xb and 333 for hPMCA3zb; c, 339 for hPMCA4xb and 327 for hPMCA4zb.

Similar articles

Cited by

References

    1. Strehler E. E., Zacharias D. A. (2001) Role of alternative splicing in generating isoform diversity among plasma membrane calcium pumps. Physiol. Rev. 81, 21–50 - PubMed
    1. James P., Maeda M., Fischer R., Verma A. K., Krebs J., Penniston J. T., Carafoli E. (1988) Identification and primary structure of a calmodulin binding domain of the Ca2+ pump of human erythrocytes. J. Biol. Chem. 263, 2905–2910 - PubMed
    1. Enyedi A., Vorherr T., James P., McCormick D. J., Filoteo A. G., Carafoli E., Penniston J. T. (1989) The calmodulin binding domain of the plasma membrane Ca2+ pump interacts both with calmodulin and with another part of the pump. J. Biol. Chem. 264, 12313–12321 - PubMed
    1. Niggli V., Adunyah E. S., Carafoli E. (1981) Acidic phospholipids, unsaturated fatty acids, and limited proteolysis mimic the effect of calmodulin on the purified erythrocyte Ca2+-ATPase. J. Biol. Chem. 256, 8588–8592 - PubMed
    1. Niggli V., Adunyah E. S., Penniston J. T., Carafoli E. (1981) Purified (Ca2+-Mg2+)-ATPase of the erythrocyte membrane. Reconstitution and effect of calmodulin and phospholipids. J. Biol. Chem. 256, 395–401 - PubMed

Publication types

MeSH terms