

Salience network-based classification and prediction of symptom severity in children with autism
- PMID: 23803651
- PMCID: PMC3951904
- DOI: 10.1001/jamapsychiatry.2013.104
Salience network-based classification and prediction of symptom severity in children with autism
Abstract
Importance: Autism spectrum disorder (ASD) affects 1 in 88 children and is characterized by a complex phenotype, including social, communicative, and sensorimotor deficits. Autism spectrum disorder has been linked with atypical connectivity across multiple brain systems, yet the nature of these differences in young children with the disorder is not well understood.
Objectives: To examine connectivity of large-scale brain networks and determine whether specific networks can distinguish children with ASD from typically developing (TD) children and predict symptom severity in children with ASD.
Design, setting, and participants: Case-control study performed at Stanford University School of Medicine of 20 children 7 to 12 years old with ASD and 20 age-, sex-, and IQ-matched TD children.
Main outcomes and measures: Between-group differences in intrinsic functional connectivity of large-scale brain networks, performance of a classifier built to discriminate children with ASD from TD children based on specific brain networks, and correlations between brain networks and core symptoms of ASD.
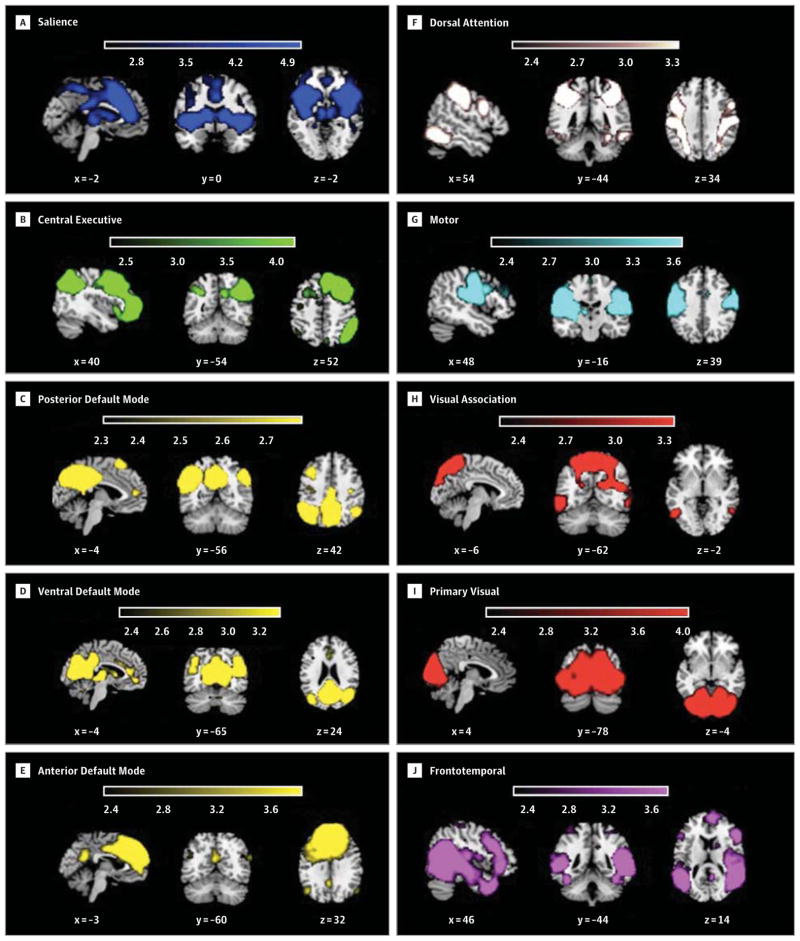
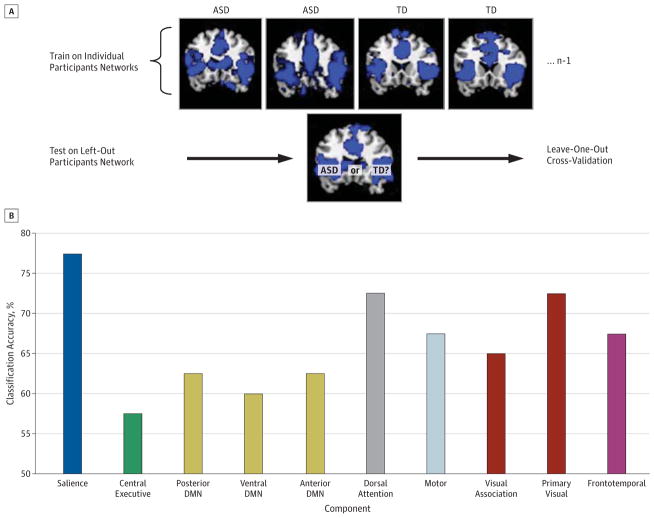
Results: We observed stronger functional connectivity within several large-scale brain networks in children with ASD compared with TD children. This hyperconnectivity in ASD encompassed salience, default mode, frontotemporal, motor, and visual networks. This hyperconnectivity result was replicated in an independent cohort obtained from publicly available databases. Using maps of each individual's salience network, children with ASD could be discriminated from TD children with a classification accuracy of 78%, with 75% sensitivity and 80% specificity. The salience network showed the highest classification accuracy among all networks examined, and the blood oxygen-level dependent signal in this network predicted restricted and repetitive behavior scores. The classifier discriminated ASD from TD in the independent sample with 83% accuracy, 67% sensitivity, and 100% specificity.
Conclusions and relevance: Salience network hyperconnectivity may be a distinguishing feature in children with ASD. Quantification of brain network connectivity is a step toward developing biomarkers for objectively identifying children with ASD.
Conflict of interest statement
Figures

References
-
- Autism and Developmental Disabilities Monitoring Network Surveillance Year 2008 Principal Investigators; Centers for Disease Control and Prevention. Prevalence of autism spectrum disorders—Autism and Developmental Disabilities Monitoring Network, 14 sites, United States, 2008. MMWR Surveill Summ. 2012;61(3):1–19. - PubMed
-
- Hughes JR. Autism: the first firm finding = underconnectivity? Epilepsy Behav. 2007;11(1):20–24. - PubMed
-
- Geschwind DH, Levitt P. Autism spectrum disorders: developmental disconnection syndromes. Curr Opin Neurobiol. 2007;17(1):103–111. - PubMed
Publication types
MeSH terms
Grants and funding
LinkOut - more resources
Full Text Sources
Other Literature Sources
