. 2013 Jun 26;5(191):191ra84.
doi: 10.1126/scitranslmed.3005982.

Identifying the interaction between influenza and pneumococcal pneumonia using incidence data

Affiliations

Identifying the interaction between influenza and pneumococcal pneumonia using incidence data

Sourya Shrestha et al. Sci Transl Med. .

Abstract

The association between influenza virus and the bacterium Streptococcus pneumoniae (pneumococcus) has been proposed as a polymicrobial system, whereby transmission and pathogenicity of one pathogen (the bacterium) are affected by interactions with the other (the virus). However, studies focusing on different scales of resolution have painted an inconsistent picture: Individual-scale animal experiments have unequivocally demonstrated an association, whereas epidemiological support in human populations is, at best, inconclusive. We integrate weekly incidence reports and a mechanistic transmission model within a likelihood-based inference framework to characterize the nature, timing, and magnitude of this interaction. We find support for a strong but short-lived interaction, with influenza infection increasing susceptibility to pneumococcal pneumonia ~100-fold. We infer modest population-level impacts arising from strong processes at the level of an individual, thereby resolving the dichotomy in seemingly inconsistent observations across scales. An accurate characterization of the influenza-pneumococcal interaction can form a basis for more effective clinical care and public health measures for pneumococcal pneumonia.


Figures

Fig.1
Fig.1
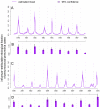
Weekly incidences of influenza, and pneumococcal-pneumonia in Illinois, (A; Dataset I) before and (B; Dataset II) after the introduction of pneumococcal conjugate vaccines (PCV). Incidences are the weekly hospitalization case reports as a fraction of the total population. [See Materials and Methods of details.]
Fig.2
Fig.2
The nature and intensity of influenza-pneumococcal interaction. (A) Schematic representation of the pneumococcal transmission model. Following the SIRS framework, individuals progress along SIRS at per capita rates λ, γ and , respectively. Progression of individuals recently infected with influenza are tracked separately, via classes SF and IF. Pneumococcal-pneumonia case reports are fraction of the infecteds as they recover. Births and deaths are present in the model, but omitted in this illustration for clarity. [See Materials and Methods for the complete model.] We test three hypothesized pathways of influenza-pneumococcal interaction: H1 (θ > 1): Individuals infected with pneumococcal pneumonia, contribute more to pneumococcal transmission if they have been recently infected with influenza. H2 (φ > 1): Individuals recently infected with influenza are more susceptible to pneumococcal pneumonia. H3 (ξ > 1): Individuals infected with pneumococcal pneumonia are more likely to be reported, if recently infected with influenza. The nature and intensity of interactions between influenza and pneumococcal-pneumonia, inferred in Illinois from (B,C,D) 1990 to 1997 (Dataset I); and (E,F,G) 2000 to 2009 (Dataset II). Arranged column-wise are the tests for the three hypotheses, H1, H2, and H3. Plotted in each graph are likelihood profiles for the respective parameters—the profiles are created by fitting a smooth line through the log of the arithmetic mean likelihoods (shown in colored filled circles) in 10 repeated likelihood estimates (shown in colored empty circles). The values within the two dashed black lines are within the estimated 95% confidence interval, and the value marked with dashed colored line represents the maximum likelihood estimate (MLE). The values corresponding to the MLE and the 95% confidence intervals are given on the top margin of the graphs. The 95% confidence interval is taken to be χ12(0.95)21.92 log-likelihood units below the maximum — univariate confidence limits using the χ2 distribution. For each of the three parameters, value of 1 represents the null hypothesis. For H2, we show the profiles with θ = 1, and ξ = 1 (i.e. after rejecting H1 and H3) in the inset graphs.
Fig.3
Fig.3
Impact of influenza on pneumococcal epidemiology. (A) Estimates of influenza attributable etiological fraction of pneumococcal pneumonia cases in Illinois in (A,B) Dataset I; and (C,D) Dataset II. The estimates are based on the corresponding MLE models for each dataset. Panels B and D are fractions averaged over annual periods, mid-year to mid-year, for intervals shown in A and C, respectively. Influenza attributable etiological fraction of pneumococcal pneumonia cases in any time interval, is taken to be the ratio of pneumococcal cases as a result of influenza to the total pneumococcal cases in the given time interval. The estimates for Dataset I and Dataset II are based on 1000 replicate simulations of the respective MLE models. [See Materials and Methods for details on the calculation of etiological fractions.]
Fig.4
Fig.4
Detectability of influenza-pneumococcal interaction in manufactured data. We manufactured multiple hypothetical influenza datasets that differ in their interannual variability in peak sizes. On the basis of the MLE model, we then predicted pneumococcal pneumonia incidences for each influenza dataset. (A) Color coded contours represent the magnitude of annual peaks in pneumococcal pneumonia incidences, when the annual peaks in influenza incidences (plotted on the horizontal axis), and susceptibility impact, φ (plotted on the vertical axis) vary. Magnitude of both influenza and pneumococcal pneumonia peaks are presented as fold-increase relative to their respective baseline peaks. Marked in filled circles are where actual annuals peaks in the data lie. We then sampled 5 scenarios (I,II,III,IV,V), indicated by five open red circles. Plotted column-wise are inference tests performed on these 5 sets of manufactured data in each of the scenarios. [See Materials and Methods for details on inference using manufactured data.] Figs. (B,C,D,E,F) are manufactured weekly influenza incidences (on a log10 scale); Figs. (G,H,I,J,K) are simulated weekly pneumococcal pneumonia incidences (on a log10 scale) using the MLE-model, and influenza cases as covariates; and Figs. (L,M,N,O,P) are likelihood profiles of the susceptibility impact, φ. The dashed red line is the actual value of interaction (φ = 85, MLE-model), and the the values of φ between the two dashed black lines are within 95% confidence interval.

Similar articles

Cited by

References

    1. Petney TN, Andrews RH. Multiparasite communities in animals and humans: Frequency, structure and pathogenic significance. Int. J. Parasitol. 1998;28:377–393. - PubMed
    1. Rohani P, Green C, Mantilla-Beniers N, Grenfell B. Ecological interference between fatal diseases. Nature. 2003;422:885–888. - PubMed
    1. Lello J, Boag B, Fenton A, Stevenson IR, Hudson PJ. Competition and mutualism among the gut helminths of a mammalian host. Nature. 2004;428:840–844. - PubMed
    1. Pullan R, Brooker S. The health impact of polyparasitism in humans: Are we under-estimating the burden of parasitic diseases? Parasitology. 2008;135:783–794. - PMC - PubMed
    1. Griffiths EC, Pedersen AB, Fenton A, Petchey OL. The nature and consequences of coinfection in humans. J. Infect. 2011;63:200–206. - PMC - PubMed

Publication types

MeSH terms