. 2013 Jul 25;499(7459):476-80.
doi: 10.1038/nature12276. Epub 2013 Jun 26.

Attention enhances synaptic efficacy and the signal-to-noise ratio in neural circuits

Affiliations

Attention enhances synaptic efficacy and the signal-to-noise ratio in neural circuits

Farran Briggs et al. Nature. .

Abstract

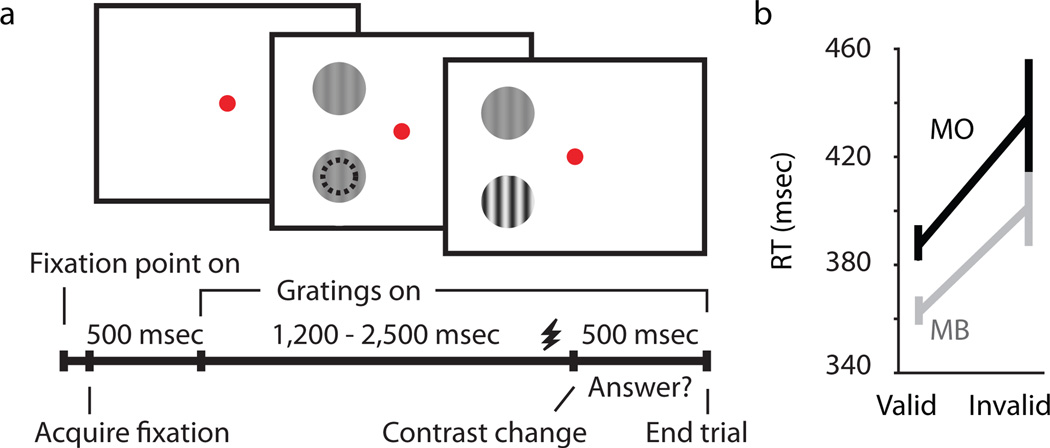
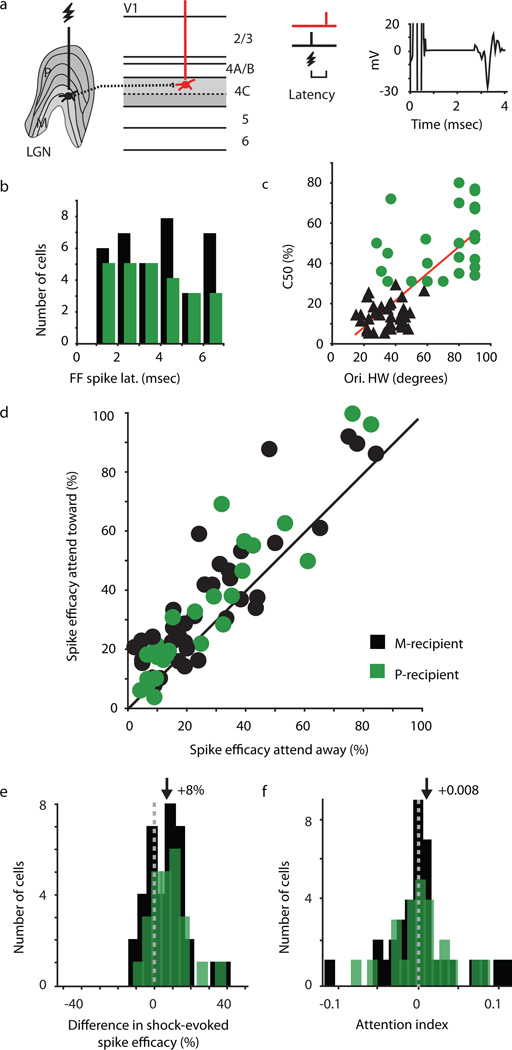
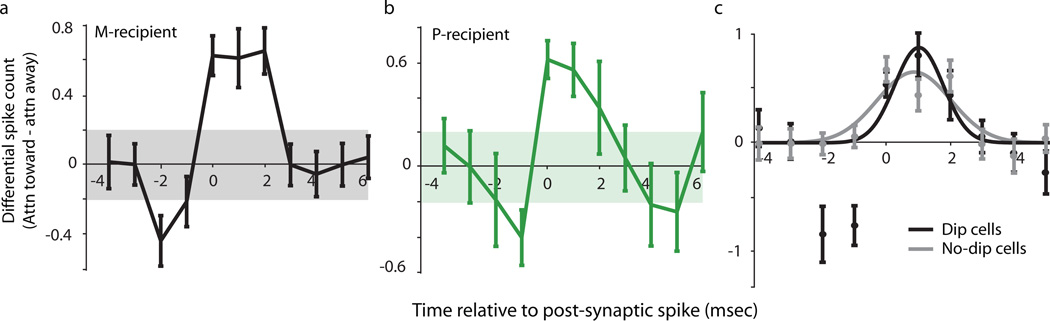
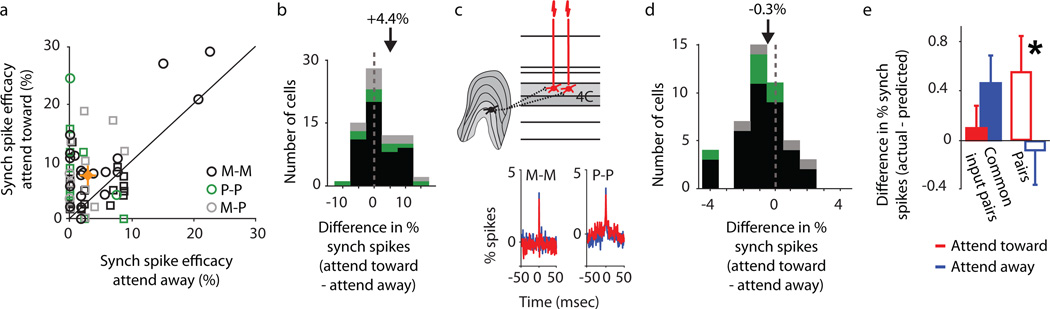
Attention is a critical component of perception. However, the mechanisms by which attention modulates neuronal communication to guide behaviour are poorly understood. To elucidate the synaptic mechanisms of attention, we developed a sensitive assay of attentional modulation of neuronal communication. In alert monkeys performing a visual spatial attention task, we probed thalamocortical communication by electrically stimulating neurons in the lateral geniculate nucleus of the thalamus while simultaneously recording shock-evoked responses from monosynaptically connected neurons in primary visual cortex. We found that attention enhances neuronal communication by increasing the efficacy of presynaptic input in driving postsynaptic responses, by increasing synchronous responses among ensembles of postsynaptic neurons receiving independent input, and by decreasing redundant signals between postsynaptic neurons receiving common input. The results demonstrate that attention finely tunes neuronal communication at the synaptic level by selectively altering synaptic weights, enabling enhanced detection of salient events in the noisy sensory environment.


Figures

Figure 1
Figure 1
Attention task and behavioral performance. (a) Illustration of the attention task including representative frames of the visual display for a validly cued trial where attention was directed by cue color toward the receptive field of the neuron. Dashed black circle represents the receptive field of the recorded neuron. The timeline for one trial is shown at bottom; LGN shock timing is indicated schematically just prior to the contrast change (shocks occured on 70% of trials). (b) Reaction time (RT) data for valid versus invalid trials for the two monkeys (Monkey B (MB), p=0.006); Monkey O (MO), p=0.046). Error bars represent SEMs.
Figure 2
Figure 2
Attentional modulation of thalamocortical synaptic efficacy. (a) Experimental set-up. Electrical stimulation of presynaptic LGN neurons (black) leads to a postsynaptic response in the simultaneously recorded TCR neuron (red). Shock-evoked postsynaptic spikes occur at fixed latencies with little temporal jitter, as illustrated by trial-averaged waveform of a representative TCR neuron (right). (b) Distribution of postsynaptic-response latencies for M- and P-recipient neurons in black and green, respectively (mean latency: M-recipient neurons = 3.4±0.3msec, P-recipient neurons = 3.1±0.4msec). (c) Relationship between C50 (contrast for half-maximum response) and orientation-tuning bandwidth (peak half-width, HW, at half height) for M- and P-recipient neurons (R2 = 0.52). M-recipient neurons: C50 =13.8±1.1%, orientation HW = 34±1.8°. P-recipient neurons: C50 = 49.4±3.4%, orientation HW = 69±4.6°. (d) Percentage of shock-evoked postsynaptic spikes in attend-toward versus attend-away conditions. Black line represents unity. Average efficacy (percentage of shocks that evoke a postsynaptic response) for all TCRs: attend-toward = 36±3%, attend-away = 28±3%; M-recipient neurons: attend-toward = 37±4%, attend-away = 29±4%; P-recipient neurons: attend-toward = 35±5%, attend-away = 28±5%. (e, f) Distributions of differences in shock-evoked spike efficacy and attention index (AI) values for M- and P-recipient neurons (note difference in scales). AI values calculated from firing rate 850–1,200 msec following onset of grating stimulation. Dashed lines indicate zero and arrows indicate mean values (mean diff. spike efficacy M- and P-recipient TCRs = 8±2%; mean AI M-recipient = 0.008±0.007, P-recipient = 0.006±0.007).
Figure 3
Figure 3
Temporal precision of attentional enhancement of synaptic efficacy. Average differential spiking activity (attend-toward – attend-away) surrounding the time of the shock-evoked postsynaptic spike (occurring at time=0) for (a) M-recipient TCR neurons, and (b) P-recipient TCR neurons. Error bars represent SEMs; shaded regions represent 2 standard deviations above and below mean activity. (c) Average differential spiking activity of TCR neurons separated into groups on the basis of displaying early inhibition (Dip vs. No-dip cells). Error bars represent SEMs. Black and grey lines illustrate Gaussian fits to Dip and No-dip cell data. Width at half height for Dip cells = 1.75msec, for No-dip cells = 2.75msec.
Figure 4
Figure 4
Attentional modulation of synchronized spiking. (a) Percentage of synchronously evoked postsynaptic spikes across attention conditions for 71 pairs of simultaneously recorded M-M (black; n=48), P-P (green; n=11), M-P (grey; n=12) TCR pairs (circles represent TCR pairs; squares represent putative TCR pairs). Black line represents unity. Average synchronous-spiking efficacy across all pairs attend-toward condition = 7.6±0.8%, attend-away condition = 3.1±0.6% (orange diamond, crosshairs represent SEMs). (b) Distribution of attention-mediated differences in percentage of shock-evoked synchronous spikes. Color conventions as in a. Dashed line represents zero and arrow illustrates population mean (+4.4±0.7%). (c) Diagram illustrating a pair of TCR neurons receiving common presynaptic input and two examples of shuffle-corrected cross-correlograms for M-M recipient and P-P recipient pairs illustrating the occurrence of synchronous spikes (narrow peaks centered at time zero) and the influence of attention on the percentage of synchronous spikes in attend-toward (red) and attend-away (blue) conditions. (d) Distribution of attention-mediated differences in correlated spikes among pairs receiving common input (21 M-M, 2 P-P, and 2 M-P pairs). Conventions as in b. Mean difference in spikes in peak = −0.3±0.2%. (e) Difference between actual and predicted synchronous spikes for TCR pairs receiving common feedforward input (solid bars; n=25) and TCR pairs receiving independent input (open bars; n=46) across attention conditions. Error bars represent SEMs; asterisk indicates significant difference across attention conditions for TCR pairs receiving independent input (p = 0.02). Average actual – predicted values: common input TCR pairs, attend-toward = 0.1±0.2%, attend-away = 0.5±0.2%; independent input TCR pairs, attend-toward = 0.6±0.3%, attend-away = −0.1±0.3%.

Comment in

References

    1. Van Voorhis S, Hillyard SA. Visual evoked potentials and selective attention to points in space. Perception and Psychophysics. 1977;22:54–62.
    1. Moran J, Desimone R. Selective Attention Gates Visual Processing in the Extrastriate Cortex. Science. 1985;229:782–784. - PubMed
    1. Heinze HJ, et al. Combined spatial and temporal imaging of brain activity during visual selective attention in humans. Nature. 1994;372:543–546. - PubMed
    1. Ito M, Gilbert CD. Attention modulates contextual influences in the primary visual cortex of alert monkeys. Neuron. 1999;22:593–604. - PubMed
    1. Kelly SP, Gomez-Ramirez M, Foxe JJ. Spatial attention modulates initial afferent activity in human primary visual cortex. Cerebral Cortex. 2008;18:2629–2636. - PMC - PubMed

Methods References

    1. Briggs F, Usrey WM. A fast reciprocal pathway between the lateral geniculate nucleus and visual cortex in the macaque monkey. J. Neurosci. 2007;27:5431–5436. - PMC - PubMed
    1. Briggs F, Usrey WM. Parallel processing in the corticogeniculate pathway of the macaque monkey. Neuron. 2009;62:135–146. - PMC - PubMed
    1. Skottun BC, et al. Classifying simple and complex cells on the basis of response modulation. Vision Res. 1991;31:1079–1086. - PubMed
    1. Brody CD. Slow covariations in neuronal resting potentials can lead to artefactual fast cross-correlations in their spike trains. J. Neurophysiology. 1998;80:3345–3351. - PubMed

Publication types