. 2013 Jun 26;33(26):10647-60.
doi: 10.1523/JNEUROSCI.5662-12.2013.

Multiple dileucine-like motifs direct VGLUT1 trafficking

Affiliations

Multiple dileucine-like motifs direct VGLUT1 trafficking

Sarah M Foss et al. J Neurosci. .

Abstract

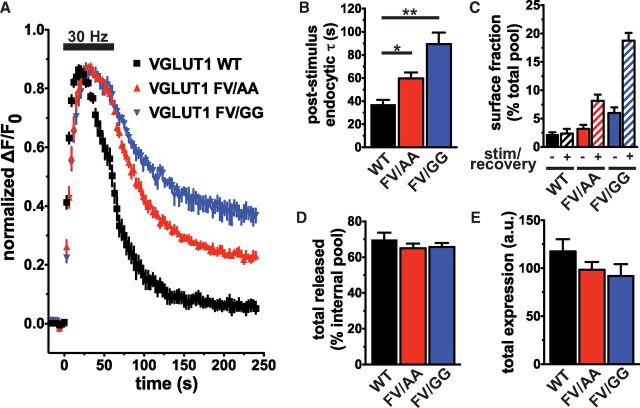
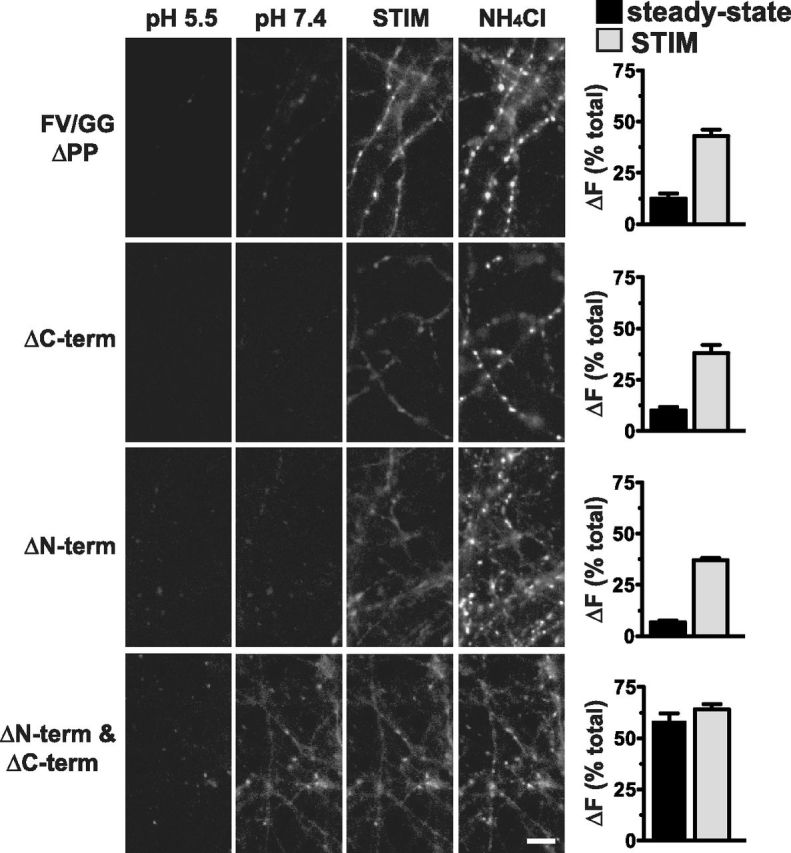
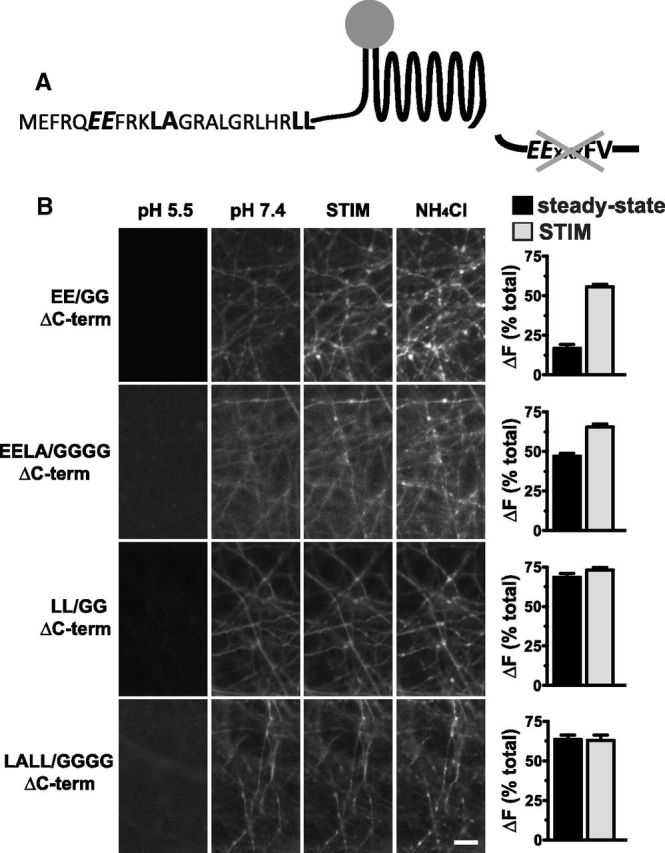
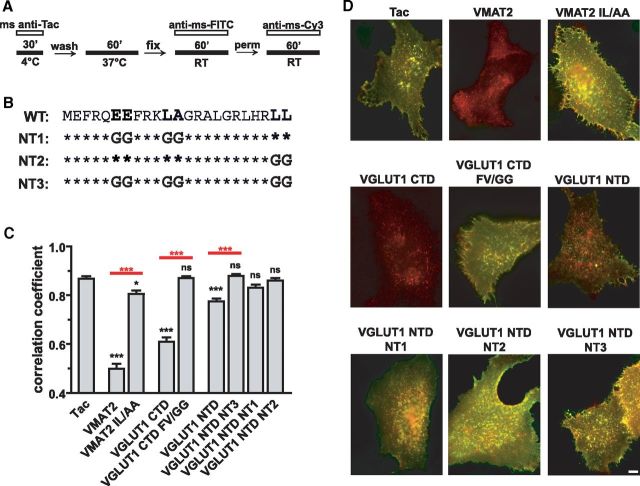
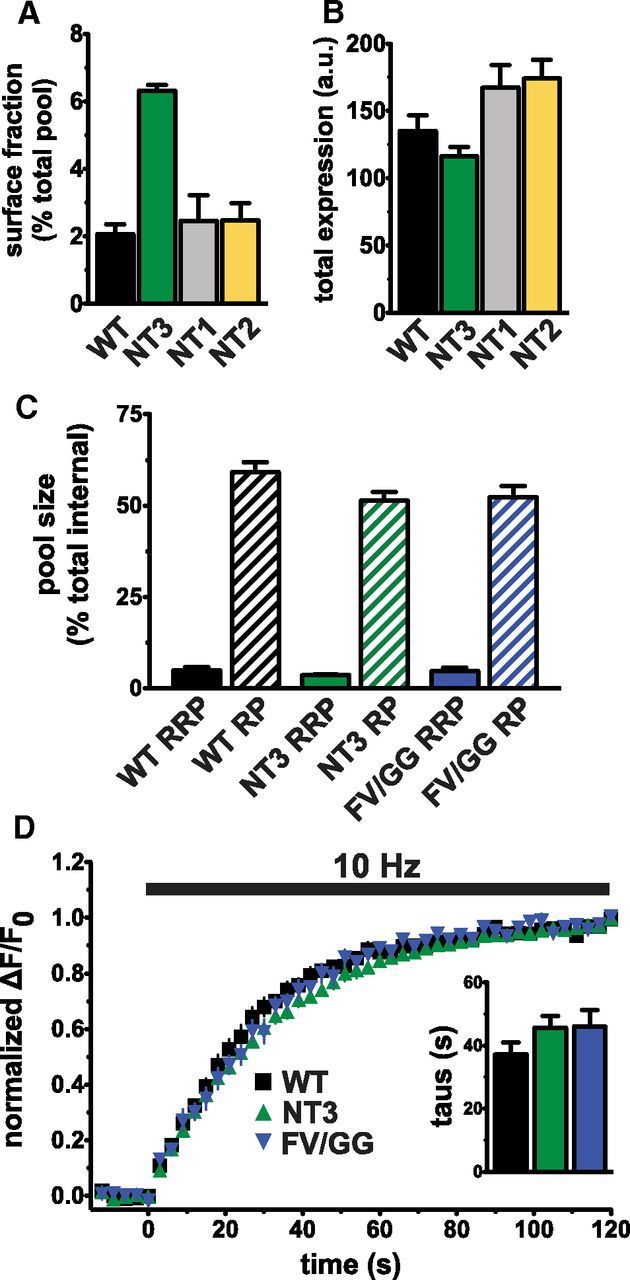
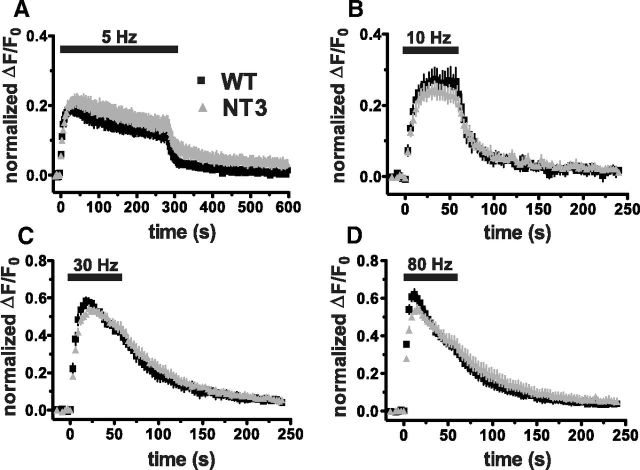
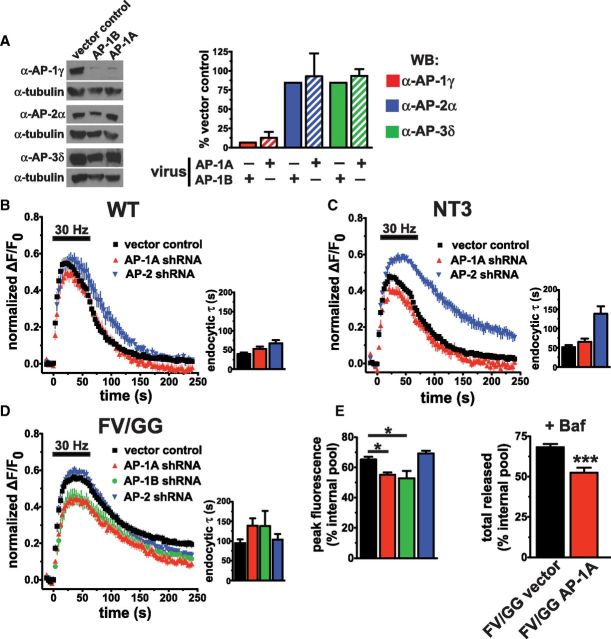
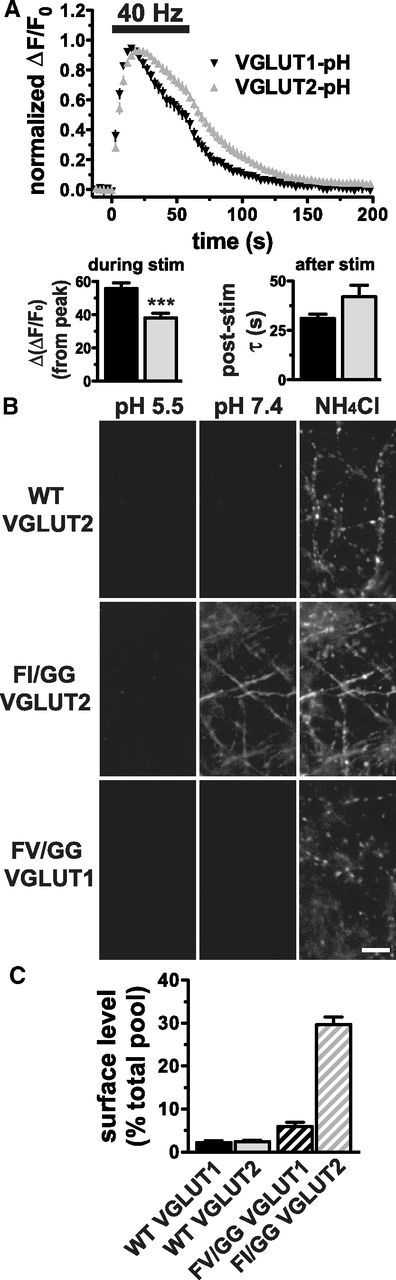
The vesicular glutamate transporters (VGLUTs) package glutamate into synaptic vesicles, and the two principal isoforms VGLUT1 and VGLUT2 have been suggested to influence the properties of release. To understand how a VGLUT isoform might influence transmitter release, we have studied their trafficking and previously identified a dileucine-like endocytic motif in the C terminus of VGLUT1. Disruption of this motif impairs the activity-dependent recycling of VGLUT1, but does not eliminate its endocytosis. We now report the identification of two additional dileucine-like motifs in the N terminus of VGLUT1 that are not well conserved in the other isoforms. In the absence of all three motifs, rat VGLUT1 shows limited accumulation at synaptic sites and no longer responds to stimulation. In addition, shRNA-mediated knockdown of clathrin adaptor proteins AP-1 and AP-2 shows that the C-terminal motif acts largely via AP-2, whereas the N-terminal motifs use AP-1. Without the C-terminal motif, knockdown of AP-1 reduces the proportion of VGLUT1 that responds to stimulation. VGLUT1 thus contains multiple sorting signals that engage distinct trafficking mechanisms. In contrast to VGLUT1, the trafficking of VGLUT2 depends almost entirely on the conserved C-terminal dileucine-like motif: without this motif, a substantial fraction of VGLUT2 redistributes to the plasma membrane and the transporter's synaptic localization is disrupted. Consistent with these differences in trafficking signals, wild-type VGLUT1 and VGLUT2 differ in their response to stimulation.


Figures

Figure 1.
Figure 1.
Sequence and membrane topology of VGLUT1. The partial amino acid sequences of rat and human VGLUT1 show the cytosolic N and C termini and adjacent transmembrane regions. The three dileucine-like motifs are highlighted in gray. Specific residues that were mutated are indicated in bold. Sites of the N- and C-terminal truncations, and pHluorin insertion, are also indicated. Transmembrane regions, as predicted by Fremeau et al. (2001), are underlined.
Figure 2.
Figure 2.
Mutation of the C-terminal dileucine-like motif slows, but does not eliminate VGLUT1 endocytosis. A, Time course of changes in fluorescence intensity (ΔF/F0) in hippocampal neurons transfected with WT VGLUT1-pH (black), FV/AA VGLUT1-pH (red), or FV/GG VGLUT1-pH (blue). The traces, normalized to peak fluorescence, exhibit increases during stimulation at 30 Hz for 1 min (bar) and decreases after stimulation, consistent with exocytosis followed by endocytosis. Endocytosis of FV/GG VGLUT1-pH is less efficient than either WT or FV/AA. B, The mean poststimulus fluorescence decay, fit to a single exponential, is significantly faster for WT (36.9 ± 4.3 s) than FV/AA (59.8 ± 5.0 s; *p < 0.05) or FV/GG (89.4 ± 10.0 s; **p < 0.001, one-way ANOVA, Tukey's post-test). C, The fraction of VGLUT1-pH present on the cell surface at steady-state before stimulation (solid bars; stim/recovery −) and 3 min after stimulation (striped bars; stim/recovery +) was estimated by subtracting the fluorescence upon acid quenching with Tyrode's solution containing MES, pH 5.5, from the fluorescence at rest, normalized to total fluorescence upon alkalinization with NH4Cl. The steady-state surface level of the FV/GG mutant (6.0 ± 1.0%) is significantly higher than both the FV/AA mutant (3.2 ± 0.7%; p < 0.05, one-way ANOVA, Tukey's post-test) and WT (2.2 ± 0.4%; p < 0.01, one-way ANOVA, Tukey's post-test). Fluorescence after recovery from stimulation of both FV/AA (8.2 ± 1.1%) and FV/GG (18.8 ± 1.4%) mutants are significantly higher than WT (2.3 ± 0.9%; WT vs FV/AA, p < 0.01; WT vs FV/GG, p < 0.001; one-way ANOVA, Tukey's post-test). D, The total amount of transporter released by stimulation at 30 Hz for 1 min was determined in the presence of bafilomycin. The fraction of the total internal pool released is similar between WT (69.6 ± 4.1%), FV/AA (65.0 ± 2.6%), and FV/GG (65.8 ± 2.2%) VGLUT1-pH (p = 0.55, one-way ANOVA). The total internal pool was determined by subtraction of the initial fluorescence from the total fluorescence, as measured by application of 50 mm NH4Cl. E, Total protein expression of WT (117.7 ± 12.7 a.u.), FV/AA (98.7 ± 7.9 a.u.), and FV/GG (92.1 ± 12.2 a.u.) VGLUT1-pH at boutons are not significantly different (p = 0.26, one-way ANOVA). Data are the mean ± SEM of at least 20 boutons per coverslip from 5–10 coverslips from at least two independent cultures.
Figure 3.
Figure 3.
VGLUT1 requires either the N or C terminus to maintain an intracellular localization. Hippocampal neurons transfected with VGLUT1-pH truncation mutants were imaged in Tyrode's solution buffered with MES to pH 5.5 to quench surface fluorescence; at rest, pH 7.4; after 30 s stimulation at 30 Hz, near the peak of fluorescence (STIM); and upon alkalinization in 50 mm NH4Cl to measure total fluorescence. Fluorescence at rest (steady state, black bars), normalized to unquenched fluorescence at pH 5.5 and total fluorescence [(FpH 7.4FpH 5.5)/Ftotal], increases during stimulation (STIM, gray bars) in neurons transfected with a VGLUT1-pH mutant that deletes the distal C terminus (FV/GG ΔPP; steady state, 12.4 ± 2.6%; STIM, 43.1 ± 3.1%), the full C terminus (ΔC-term; steady state, 10.1 ± 1.7%; STIM, 38.1 ± 4.1%), or the full N terminus (ΔN-term; steady state, 6.8 ± 0.8%; STIM, 37.1 ± 1.2%). In contrast, VGLUT1-pH lacking both the N and C termini (ΔN-term & ΔC-term) is highly expressed on the cell surface at steady state (58.4 ± 3.8%), and fluorescence is not significantly increased by stimulation (64.1 ± 2.5%; p = 0.28, unpaired, two-tailed t test). Data are the mean ± SEM of 10–18 coverslips from at least four independent cultures with the exception of ΔN-term & ΔC-term (n = 3 coverslips from one culture). Scale bar, 10 μm.
Figure 4.
Figure 4.
The N terminus of VGLUT1 contains two dileucine-like motifs. A, Diagram of VGLUT1-pH highlighting the N and C termini. Residues, in bold, in two N-terminal dileucine-like motifs were mutated to glycine in the context of the full C-terminal deletion. B, Point mutations were made in the N terminus of ΔC-term VGLUT1-pH and constructs transfected into hippocampal neurons stimulated at 30 Hz for 1 min. Shown are representative fluorescence images of cells in Tyrode's solution buffered with MES to pH 5.5 to quench surface fluorescence; at rest, pH 7.4; after 30 s stimulation, near the peak of fluorescence (STIM); and upon alkalinization in 50 mm NH4Cl to measure total fluorescence. Fluorescence levels, normalized to unquenched fluorescence at pH 5.5 and total fluorescence [(FpH 7.4FpH 5.5)/Ftotal], before stimulation (black bars) were compared to fluorescence levels after 30 s of stimulation (gray bars). Mutation of the acidic residues in the first dileucine-like motif to glycine (EE/GG ΔC-term) does not eliminate the increase in fluorescence in response to stimulation (steady state, 16.6 ± 2.7%; STIM, 55.5 ± 1.6%). Additional mutation of 11LA12 (EELA/GG ΔC-term) increases steady-state fluorescence levels (47.0 ± 1.8%), which increase further upon stimulation (STIM, 65.4 ± 1.9%). No fluorescence increase upon stimulation is observed with mutation of 22LL23 (LL/GG ΔC-term; steady state, 68.5 ± 2.5%; STIM, 73.0 ± 1.8%) or with mutation of both 22LL23 and 11LA12 (LALL/GGGG ΔC-term; steady state, 63.5 ± 3.0%; STIM, 63.1 ± 3.3%). Data are the mean ± SEM of 8–10 coverslips from two independent cultures. Scale bar, 10 μm.
Figure 5.
Figure 5.
The N-terminal dileucine-like motifs are sufficient to facilitate endocytosis. A, Diagram of staining procedure. HeLa cells transfected with the indicated Tac chimeras were incubated with mouse (ms) anti-Tac antibody for 30 min at 4°C. After removal of unbound antibody, cells were incubated at 37°C for 1 h to allow internalization. Cells were then fixed and incubated for 1 h with a FITC-conjugated secondary antibody to visualize surface Tac. To measure total Tac, cells were then permeabilized and stained with a Cy3-conjugated secondary antibody. B, Diagram of residues mutated to disrupt the N-terminal dileucine-like motifs of VGLUT1. To disrupt the first motif, Glu-6, Glu-7, Leu-11, and Ala-12 were replaced with glycine (NT1). Leu-22 and Leu-23 were replaced to eliminate the second motif (NT2). Mutation of all six residues disrupts both N-terminal motifs (NT3). C, To quantify the extent of internalization of the various Tac chimeras, colocalization of surface (green) and total (red) staining was measured and is represented as an average correlation coefficient (ravg) for >60 cells per construct from two independent transfections. Compared to Tac alone, the C termini of both VMAT2 (ravg = 0.50 ± 0.02; p < 0.001) and VGLUT1 (ravg = 0.61 ± 0.02; p < 0.001) are capable of conferring significant internalization onto Tac. In both cases, internalization is largely eliminated by mutation of the respective dileucine-like motifs [VMAT2 IL/AA, ravg = 0.81 ± 0.01, p < 0.05 relative to Tac (black), p < 0.001 relative to WT VMAT2 (red); VGLUT1 CTD FV/GG, ravg = 0.87 ± 0.01, p > 0.05 relative to Tac (black), p < 0.001 relative to VGLUT1 CTD (red)]. The N terminus of VGLUT1 is also sufficient to confer internalization on Tac but to a lesser degree than the VGLUT1 C terminus [VGLUT1 NTD, ravg = 0.78 ± 0.01; p < 0.001 relative to Tac (black)]. Internalization conferred by the VGLUT1 NTD is eliminated by mutation of both dileucine-like motifs [VGLUT1 NT3, ravg = 0.88 ± 0.01; p > 0.05 relative to Tac (black), p < 0.001 relative to VGLUT1 NTD (red)]. Mutation of either motif individually also appears to disrupt internalization (NT1, ravg = 0.83 ± 0.01; NT2, ravg = 0.86 ± 0.01, both p > 0.05 relative to Tac). Statistical differences relative to Tac are represented above each bar as black symbols, and differences between WT and corresponding dileucine mutant chimeras are indicated by red symbols and bars. *p < 0.05; ***p < 0.001. ns, Not significant. Data are shown as mean ± SEM. All p values were calculated using one-way ANOVA and Tukey's post-test. D, Representative images of cells quantified in C. Scale bar, 10 μm.
Figure 6.
Figure 6.
Mutation of N-terminal dileucine-like motifs increases cell surface expression. A, The surface fraction of NT3 (6.3 ± 0.2%) is significantly higher than either WT (2.1 ± 0.3%; p < 0.001) or either individual N-terminal mutant, NT1 (2.5 ± 0.7%; p < 0.01) or NT2 (2.5 ± 0.5%; p < 0.01, one-way ANOVA, Tukey's post-test). B, Total expression level of NT1 (167.2 ± 17.1 a.u.; p > 0.05), NT2 (174.2 ± 14.2 a.u.; p > 0.05), and NT3 (116.3 ± 7.2 a.u; p > 0.05) are not different than WT (135.1 ± 11.7 a.u.; one-way ANOVA, Tukey's post-test). C, The size of the readily releasable pool, as measured with a 100 Hz, 200 ms stimulus, is not significantly altered by mutation of either the N- or C-terminal dileucine-like motifs (WT, 5.0 ± 0.8%; NT3, 3.6 ± 0.3%; FV/GG, 4.8 ± 0.8%; p = 0.24, one-way ANOVA). Recycling pool size, as measured by a 10 Hz, 90 s stimulus, is also not significantly different for WT (59.2 ± 2.7%), NT3 (51.4 ± 2.3%), and FV/GG (52.3 ± 3.0%; p = 0.11, one-way ANOVA). Pool sizes are expressed as a fraction of the total internal pool, determined by subtraction of the initial fluorescence from total fluorescence. D, The rate of exocytosis in response to a 10 Hz, 120 s stimulus is not significantly different between WT (black; τ = 37.2 ± 3.7 s), NT3 (green; τ = 45.7 ± 3.8 s), and FV/GG (blue; τ = 46.1 ± 5.3 s; p = 0.28, one-way ANOVA). Data are the mean ± SEM of 8–31 coverslips from at least three independent cultures with at least 20 synapses averaged per coverslip.
Figure 7.
Figure 7.
Mutation of the N-terminal dileucine-like motifs does not significantly impair endocytosis. A–D, Time course of fluorescence changes in neurons transfected with WT VGLUT1-pH (black) or NT3 VGLUT1-pH (gray) with 5 Hz for 5 min (A), 10 Hz for 1 min (B), 30 Hz for 1 min (C), or 80 Hz for 1 min (D) stimulation (black bars). Each trace was normalized to the size of the total pool of VGLUT1-pH as determined by application of modified Tyrode's solution containing 50 mm NH4Cl. No differences are observed with the NT3 mutation relative to WT. All data are the mean ± SEM of n = 5–20 coverslips from at least two independent cultures with at least 20 synapses analyzed per coverslip.
Figure 8.
Figure 8.
N- and C-terminal dileucine-like motifs use different clathrin adaptor proteins. A, Western blotting of cell lysates from primary hippocampal neurons infected with lentiviral particles containing shRNA constructs demonstrates that only AP-1 levels are reduced by the AP-1A and AP-1B hairpins. The graph shows quantification of AP protein levels normalized to tubulin controls. Data are presented as percentages of vector controls. B, Time course of fluorescence changes in neurons transfected with WT VGLUT1-pH and infected with viral particles expressing empty vector (black), AP-1A shRNA (red), or AP-2 shRNA (blue), during and after stimulation at 30 Hz for 1 min (bar). Each trace was normalized to the size of the total pool of VGLUT1-pH, determined by NH4Cl application. Knockdown of AP-2 (blue), but not AP-1 (red), significantly slows poststimulus endocytosis of WT VGLUT1-pH (vector control, τdecay = 39.5 ± 4.2 s; AP-1A, τdecay = 52.6 ± 6.6 s; AP-2, τdecay = 67.1 ± 8.5 s; compared to vector control, AP-2, p < 0.05; AP-1A, p > 0.05; one-way ANOVA, Tukey's post-test). C, Depletion of AP-2, but not AP-1, also significantly slows poststimulus endocytosis of NT3 VGLUT1-pH [vector control (black), τdecay = 51.7 ± 5.2 s; AP-1A (red), τdecay = 64.9 ± 8.8 s; AP-2 (blue), τdecay = 138.2 ± 19.4 s; compared to vector control, AP-2, p < 0.001; AP-1A, p > 0.05; one-way ANOVA, Tukey's post-test]. D, The rate of poststimulus endocytosis of FV/GG VGLUT1-pH was not altered by knockdown of either AP-1 or AP-2 [vector control (black), τdecay = 94.4 ± 10.0 s; AP-1A (red), τdecay = 138.9 ± 18.5 s; AP-1B (green), τdecay = 137.9 ± 38.5 s; AP-2 (blue), τdecay = 103.4 ± 14.4 s; p > 0.05 for all comparisons; one-way ANOVA, Tukey's post-test]. E, Knockdown of AP-1, but not AP-2, lowers the peak fluorescence of FV/GG VGLUT1-pH during stimulation, normalized to the total internal pool [vector control (black), 65.2 ± 1.8%; AP-1A (red), 55.0 ± 1.6%; AP-1B (green), 52.7 ± 4.8%; AP-2 (blue), 69.2 ± 1.7%; compared to vector control, AP-1A, *p < 0.05; AP-1B, *p < 0.05; AP-2, p > 0.05; one-way ANOVA, Tukey's post-test]. F, Stimulation in the presence of the H+-ATPase inhibitor, bafilomycin, reveals that AP-1 knockdown significantly decreases the fraction of the total internal pool of FV/GG VGLUT1-pH released with a 30 Hz 1 min stimulus [vector control (black), 68.3 ± 2.1%; AP-1A (red), 52.4 ± 3.1%; ***p = 0.0006; unpaired, two-tailed t test]. Data are shown as the mean ± SEM. For B–F, n = 5–20 coverslips from at least two independent cultures with at least 20 synapses analyzed per coverslip.
Figure 9.
Figure 9.
VGLUT1 and VGLUT2 differ in their trafficking. A, Time course of fluorescence changes in neurons transfected with either WT VGLUT1-pH (black) or VGLUT2-pH (gray) to a 40 Hz, 1 min stimulation (bar). Traces were normalized to peak fluorescence during stimulation. The extent of fluorescence decay from peak fluorescence [Δ(ΔF/F0)] during stimulation is greater for VGLUT1 than VGLUT2 (VGLUT1, 55.8 ± 3.2% of peak F; VGLUT2, 38.2 ± 2.6% of peak F; ***p < 0.0006; unpaired, two-tailed t test; bottom left inset). The rate of VGLUT2 poststimulus endocytosis is not significantly slower than that for VGLUT1 (VGLUT1, τdecay = 31.2 ± 1.9 s; VGLUT2, τdecay = 41.9 ± 5.9 s; p = 0.12; unpaired, two-tailed t test; bottom right inset). For all graphs, n = 8–9 coverslips from four independent cultures with at least 20 synapses analyzed per coverslip. B, Hippocampal neurons transfected with WT VGLUT2-pH, FI/GG VGLUT2-pH, or FV/GG VGLUT1-pH were imaged in Tyrode's solution buffered with MES to pH 5.5 to quench surface fluorescence, at rest (pH 7.4), and upon alkalinization in NH4Cl to measure total fluorescence. Significant fluorescence is observed with FI/GG VGLUT2-pH at rest (pH 7.4) that is quenched by pH 5.5 Tyrode's solution, indicating that a large amount of the transporter is present on the cell surface at rest. C, At rest, the cell surface expression of WT VGLUT1-pH (2.2 ± 0.4% of total protein) and WT VGLUT2-pH (2.4 ± 0.3% of total protein) are similar (p = 0.65; unpaired, two-tailed t test). In contrast, considerably more FI/GG VGLUT2-pH is on the cell surface at rest than FV/GG VGLUT1-pH (FV/GG, 6.0 ± 1.0%; FI/GG, 29.7 ± 1.8%; p < 0.0001, unpaired, two-tailed t test). n = 5–15 coverslips from at least four independent cultures with at least 20 synapses analyzed per coverslip. Data for WT and FV/GG VGLUT1-pH are from Figure 2C. Data are shown as mean ± SEM. Scale bar, 10 μm.

Similar articles

Cited by

References

    1. Aihara Y, Mashima H, Onda H, Hisano S, Kasuya H, Hori T, Yamada S, Tomura H, Yamada Y, Inoue I, Kojima I, Takeda J. Molecular cloning of a novel brain-type Na(+)-dependent inorganic phosphate cotransporter. J Neurochem. 2000;74:2622–2625. - PubMed
    1. Ariel P, Ryan TA. Optical mapping of release properties in synapses. Front Neural Circuits. 2010 Aug;12:4. - PMC - PubMed
    1. Bai L, Xu H, Collins JF, Ghishan FK. Molecular and functional analysis of a novel neuronal vesicular glutamate transporter. J Biol Chem. 2001;276:36764–36769. doi: 10.1074/jbc.M104578200. - DOI - PubMed
    1. Bellocchio EE, Reimer RJ, Fremeau RT, Jr, Edwards RH. Uptake of glutamate into synaptic vesicles by an inorganic phosphate transporter. Science. 2000;289:957–960. doi: 10.1126/science.289.5481.957. - DOI - PubMed
    1. Bonanomi D, Benfenati F, Valtorta F. Protein sorting in the synaptic vesicle life cycle. Prog Neurobiol. 2006;80:177–217. doi: 10.1016/j.pneurobio.2006.09.002. - DOI - PubMed

Publication types

MeSH terms