. 2013 Jun 26;33(26):10750-61.
doi: 10.1523/JNEUROSCI.0735-13.2013.

A neocortical delta rhythm facilitates reciprocal interlaminar interactions via nested theta rhythms

Affiliations

A neocortical delta rhythm facilitates reciprocal interlaminar interactions via nested theta rhythms

Lucy M Carracedo et al. J Neurosci. .

Abstract

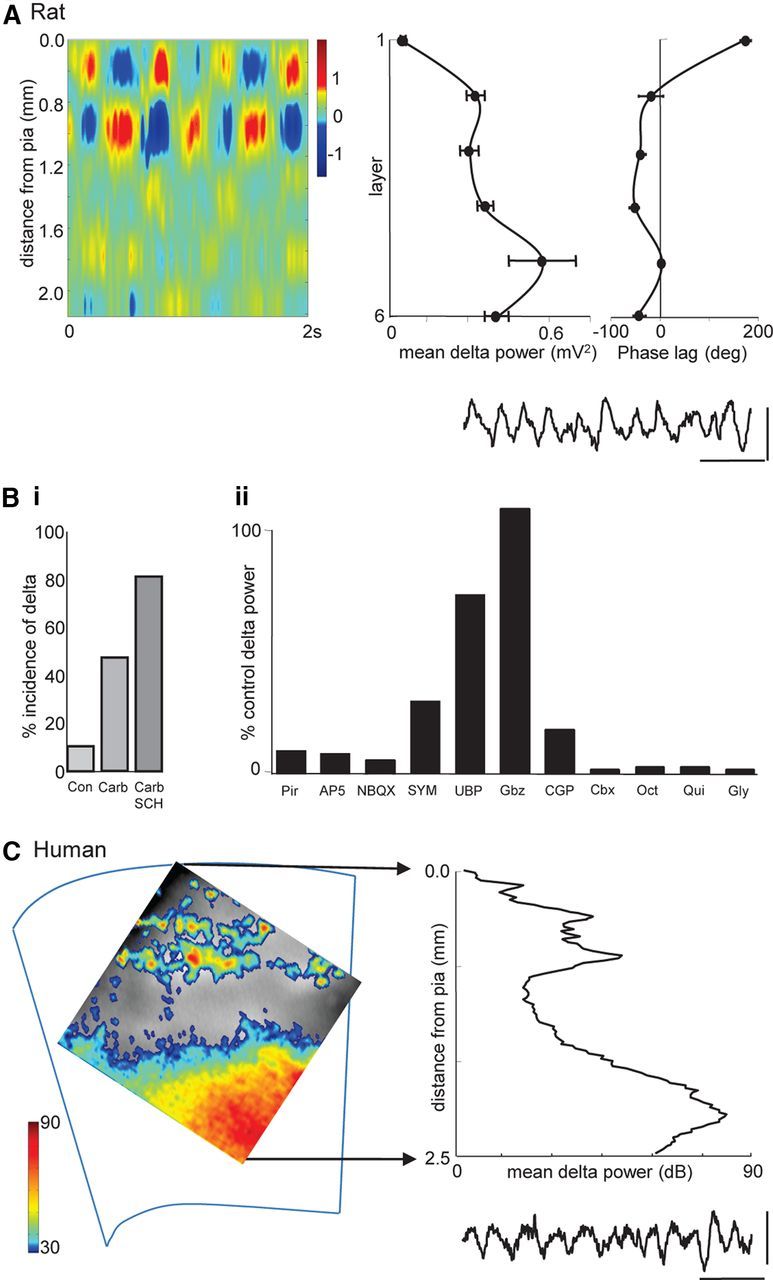
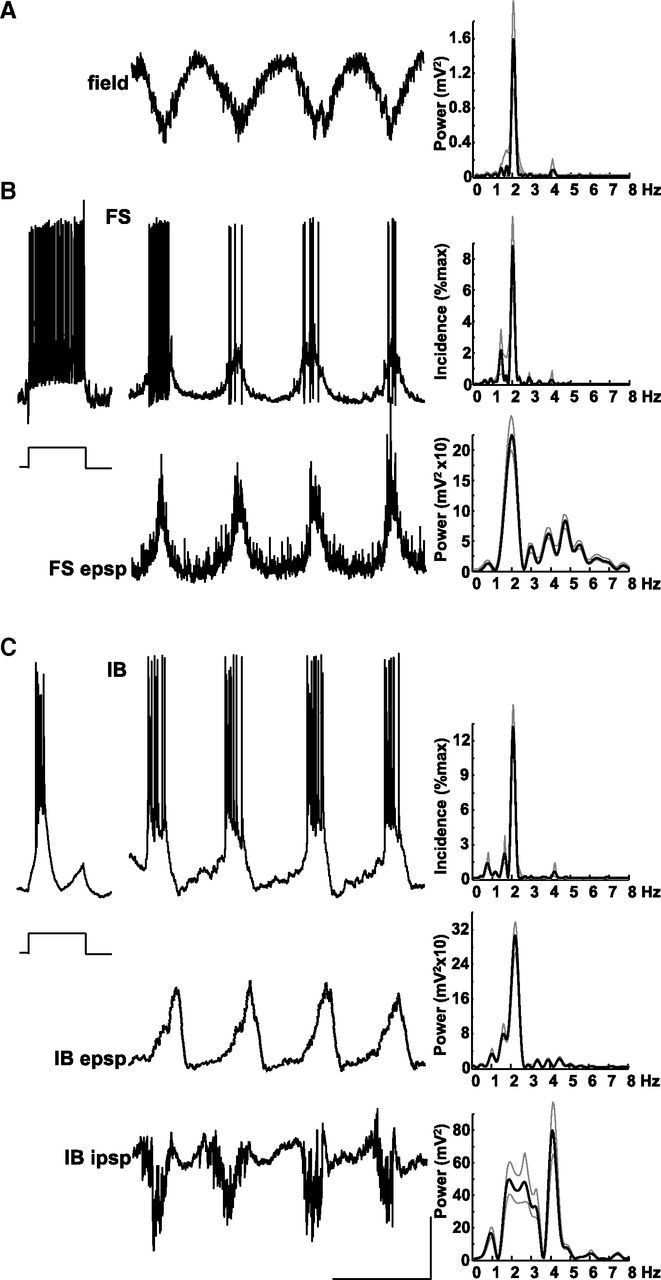
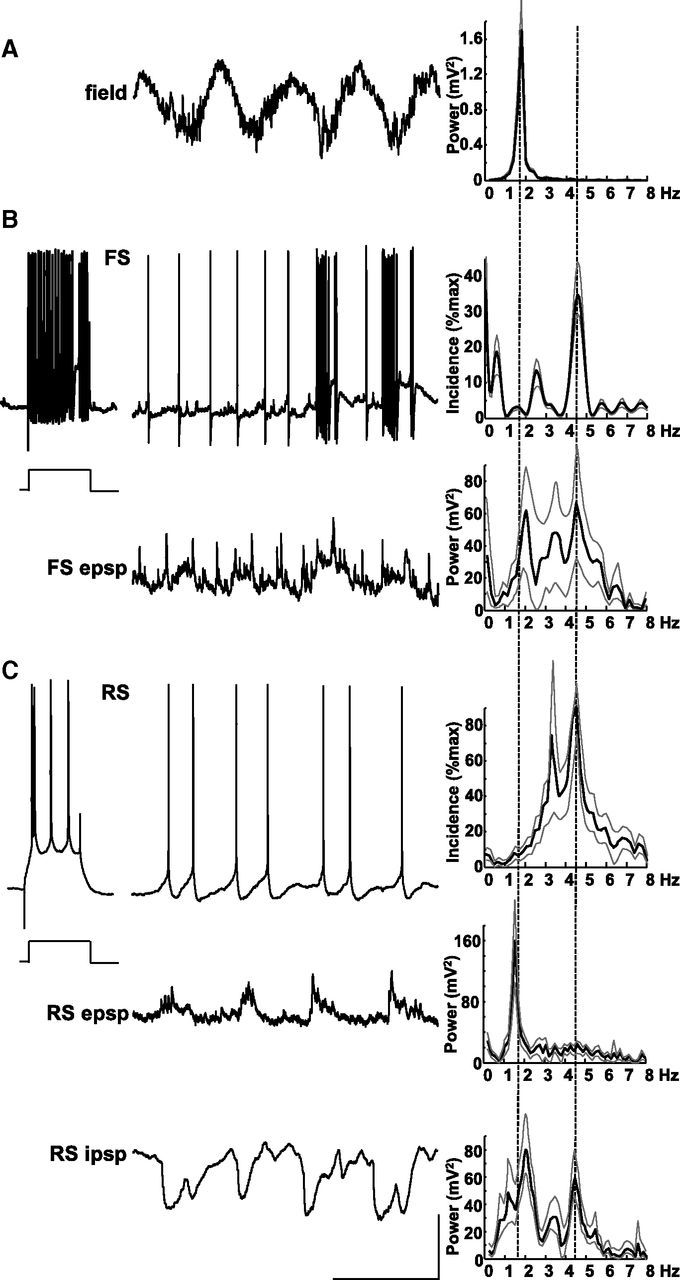
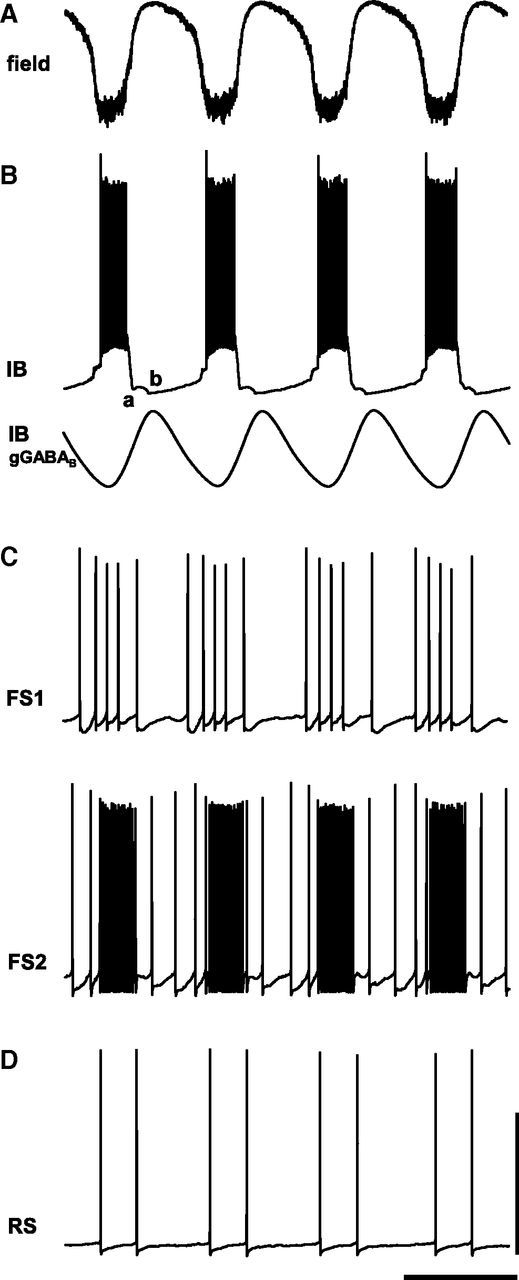
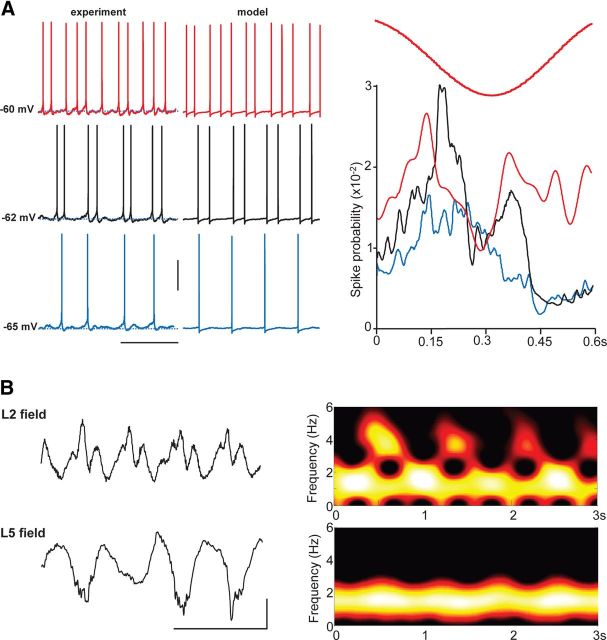
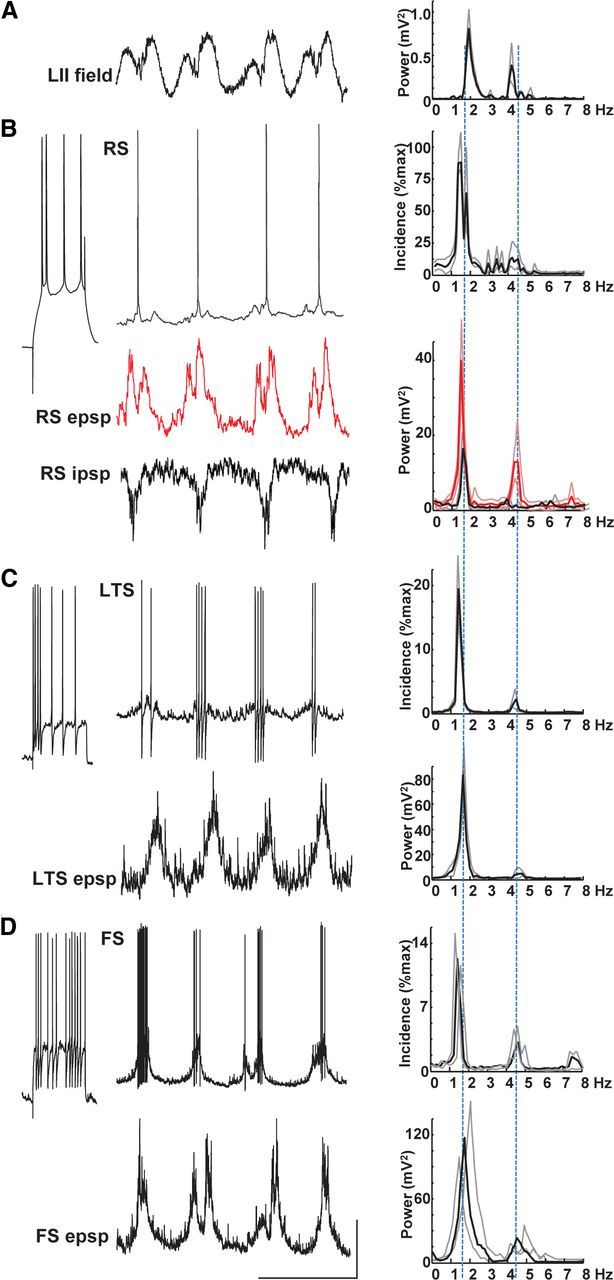
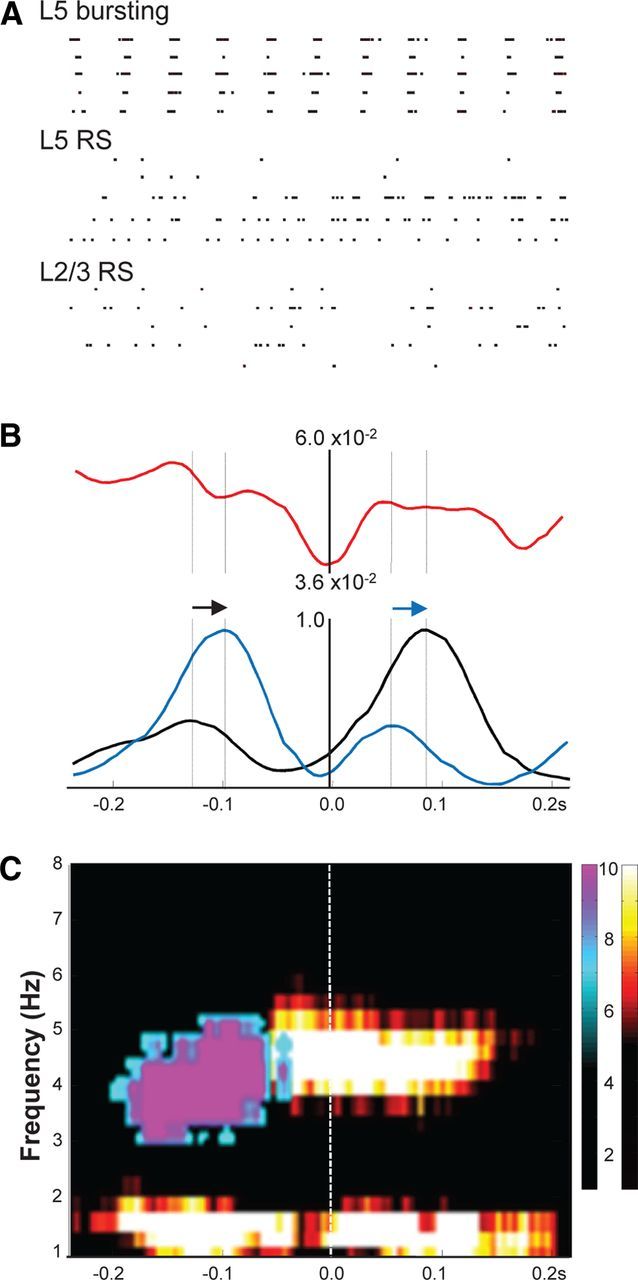
Delta oscillations (1-4 Hz) associate with deep sleep and are implicated in memory consolidation and replay of cortical responses elicited during wake states. A potent local generator has been characterized in thalamus, and local generators in neocortex have been suggested. Here we demonstrate that isolated rat neocortex generates delta rhythms in conditions mimicking the neuromodulatory state during deep sleep (low cholinergic and dopaminergic tone). The rhythm originated in an NMDA receptor-driven network of intrinsic bursting (IB) neurons in layer 5, activating a source of GABAB receptor-mediated inhibition. In contrast, regular spiking (RS) neurons in layer 5 generated theta-frequency outputs. In layer 2/3 principal cells, outputs from IB cells associated with IPSPs, whereas those from layer 5 RS neurons related to nested bursts of theta-frequency EPSPs. Both interlaminar spike and field correlations revealed a sequence of events whereby sparse spiking in layer 2/3 was partially reflected back from layer 5 on each delta period. We suggest that these reciprocal, interlaminar interactions may represent a "Helmholtz machine"-like process to control synaptic rescaling during deep sleep.


Figures

Figure 1.
Figure 1.
Basic properties of neocortical delta rhythms in vitro in human and rat tissue. A, Linear electrode array recording of persistent, spontaneous delta rhythms in rat parietal cortex. Image shows a 2 s epoch of delta activity as current source density plot. Note the superficial dominance of sink/source pairs. Graphs show mean delta power (n = 5, with 5 × 20 s epochs per n) and laminar phase difference relative to layer 5. Note the power maxima in layer 5 (as seen in human recordings in C) and the abrupt phase reversal between layers 1 and 2/3. Example trace taken from an electrode located in layer 5. Calibration: 0.3 mV, 1 s. B, Pharmacological profile of delta activity. i, Incidence of spontaneous delta generation with neuromodulation. Con, Control; Carb, carbachol, 2 μm; SCH, SCH23390, 10 μm. ii, Changes in mean delta power (n = 5) after application of drugs affecting various network mechanisms: pirenzipine (Pir, 10 μm) M1/M3 blockade, AP-5 (50 μm) NMDAR blockade, NBQX (20 μm) AMPA/kainate receptor blockade, SYM2206 (SYM, 10 μm) AMPAR blockade, UBP302 (UBP, 20 μm) GluR5 kainate receptor blockade, gabazine (Gbz, 500 nm) GABAA receptor blockade, CGP55845 (CGP, 1 μm) GABAB receptor blockade, and gap junction conductance decrease [carbenoxolone (Cbx, 0.2 mm), octanol (Oct, 1 mm), quinine (Qui, 0.2 mm), and 18β-glycyrrhetinic acid (Gly, 0.1 mm)]. C, Voltage-sensitive dye imaging of persistent, spontaneous delta rhythms in human frontal cortex. Image shows delta power averaged over 5 × 20 s epochs. Color map adjusted to show delta power hard-thresholded at 30 dB. Graph shows mean laminar distribution of delta power indicating maxima in layers 5/6 and 2/3. Example trace shows a 2 × 2 pixel binned time series of the raw fluorescence change. Calibration: 0.02% δF/F, 1 s.
Figure 2.
Figure 2.
Delta rhythms are generated by layer 5 IB neurons. A, Example trace showing a layer 5 LFP recording of delta activity. Spectrum shows a tight, single modal peak at ∼2 Hz. Data plotted as mean (black line) and SEM (gray lines). B, Example recordings from a non-accommodating, FS interneuron in layer 5. Response to step injection of +0.2 nA current for 200 ms demonstrates the intrinsic spiking behavior. Top trace shows spontaneous bursts of spike generation at resting membrane potential phase locked to the concurrently recorded field (A). Top histogram shows mean burst incidence at delta frequency. Bottom trace shows membrane potential at −70 mV (mean) revealing large, slow, regular depolarizations interspersed with more rapid but smaller, faster EPSPs. Bottom spectrogram shows that mean power of EPSPs onto FS cells had a modal peak at delta frequency but with a smaller additional peak in the theta (∼5 Hz) band. C, Example recordings from an IB neuron in layer 5. Step depolarization with 0.2 nA (200 ms) reveals the intrinsic bursting behavior of this cell type. Top trace shows spontaneous bursts of spike generation at resting membrane potential phase locked to the layer 5 field delta rhythm (note that these traces were not concurrently recorded with the example field in A). Top histogram demonstrates mean burst incidence at delta frequency. Middle trace shows a recording from the same neuron held at −70 mV (mean) revealing large, ramped EPSPs underlying the bursting behavior. Mean power spectra again show peak incidence of EPSPs at delta frequency. Bottom trace shows activity in the same cell held at −30 mV to reveal IPSP inputs. IPSPs were complex, consisting of delta-frequency bursts of higher frequency, fast IPSPs interleaved with single, slow hyperpolarizations. Mean spectra (bottom graph) of such behavior in n = 5 neurons exposed a bimodal power distribution with peaks at delta and theta frequencies. Calibration: 200 mV (field), 20 mV (resting membrane potential), 10 mV (−70 and −30 mV recordings), 0.5 s.
Figure 3.
Figure 3.
Layer 5 RS neurons produce theta-frequency spike outputs. A, Example trace showing a layer 5 LFP recording of delta activity. Spectrum shows a tight, single modal peak at ∼2 Hz as in Figure 2. B, Example recordings from a non-accommodating, FS interneuron in layer 5. Response to step injection of +0.2 nA current for 200 ms demonstrates the intrinsic spiking behavior. Top trace shows sporadic bursts of spike generation at resting membrane potential phase locked to the concurrently recorded field (A). Note also predominant theta-frequency spike generation. Top histogram shows mean spike incidence at theta frequency. Bottom trace shows membrane potential at −70 mV (mean) revealing small, slow, regular depolarizations interspersed with more rapid but smaller, faster EPSPs with large events occurring at theta frequency. Bottom spectrogram shows mean power of EPSPs onto FS cells had a bimodal peak at delta and theta frequency. Lines plotted show means of each of the three cells recorded. C, Example recordings from an RS neuron in layer 5. Step depolarization with 0.2 nA (200 ms) reveals the RS behavior of this cell type. Top trace shows spontaneous spike generation at resting membrane potential is dominated by single or double spikes per delta period (note that these traces were not concurrently recorded with the example field in A). Top histogram demonstrates mean spike incidence approximately at theta frequency. Middle trace shows a recording from the same neuron held at −70 mV (mean) revealing small compound EPSPs occurring at delta frequency (from mean power spectrum on the left). Bottom trace shows activity in the same cell held at −30 mV to reveal IPSP inputs. IPSPs were complex, consisting of both delta- and theta-frequency components. Note the absence of the runs of fast IPSPs seen in the FS cell in Figure 2. Calibration: 200 μV (field), 20 mV (resting membrane potential), 10 mV (−70 and −30 mV recordings), 0.5 s.
Figure 4.
Figure 4.
Computational model predicts local networks of IB neurons and GABAB receptor-mediated inhibition are necessary and sufficient to generate delta rhythms. A, Model layer 5 LFP (inverted sum of all synaptic inputs to IB neurons). B, Example simulation of the behavior of an IB neuron demonstrating delta activity as periodic bursts of action potentials (top trace). The quiescent period between bursts is composed of an initial AHP from the IB neurons (a compared with Fig. 2C) and a later GABAB-mediated IPSP (b). Bottom trace shows an example simulation of the periodic GABAB receptor-mediated conductance in layer 5 IB neurons. C, FS neurons in layer 5 were modeled as two types receiving different profiles of excitatory inputs from layer 5 pyramidal cells (see Materials and Methods). Those receiving greater tonic excitation (FS2, modeled as neurogliaform-like cells) demonstrated more intense spike bursts interspersed with theta-frequency single spikes (compare with Fig. 3B). D, Example trace of activity in non-tufted, layer 5 RS cells from the same simulation as A–C. Note the absence of delta-frequency bursts, being replaced by doublet spikes with interspike interval reflecting theta period, occurring every field potential delta period. Calibration arbitrary (field and IB GABAB): 50 mV (spike behavior examples), 0.5 s.
Figure 5.
Figure 5.
Layer 5 RS neuron theta spiking is only nested within delta rhythms over a narrow range of membrane potentials: outputs coincide with superficial layer field potential theta transients. A, Example traces (left) from a layer 5 RS neuron held at mean membrane potentials varied from −65 to −60 mV. Note at more hyperpolarized levels that the neuron fires only once on each delta period, whereas at more depolarized membrane potentials, firing is continuous at theta frequency. Example traces (right) show spiking behavior in three model layer 5 RS cells in which the population received a range of tonic drives. Note the neuron with highest drive spikes continuously at theta frequency, whereas the neuron with lowest drive fires only single spikes at delta frequency. Graph shows mean spike probability, from experiments, during a field delta period (10 ms bins) from seven layer 5 RS neurons held at −65 mV (blue), −62 mV (black), and −60 mV (red). Calibration: 20 mV, 0.75 s. B, Brief bursts of theta-frequency activity are manifest in superficial layer LFPs but not those from layer 5. Example traces show concurrently recorded fields from layers 2 and 5 along with corresponding spectrograms showing the theta bursts nested within the dominant delta rhythm. Calibration: 50 μV, 0.5 s.
Figure 6.
Figure 6.
Superficial layer field theta bursts are most evident in excitatory synaptic inputs to layer 2/3 RS neurons. A, Example LFP from layer 2 with corresponding power spectrum showing both theta and delta peaks. B, Example of superficial layer RS neuron behavior. RS neurons were defined by their spike response to 0.2 nA, 200 ms depolarizing step. These neurons fired sparsely (<1 spike per delta period on average) but received robust compound EPSPs with clear double peaks (middle, red, trace). In contrast, IPSPs received by these cells did not show double peaks (bottom trace). C, LTS neurons in layer 2 generated variable (1–10) spike numbers on each delta period and received weak, single maximum, compound EPSPs. D, In contrast, superficial layer FS neurons generated more spikes per delta period (3–20) and had EPSP inputs that sometime displayed double peaks. Calibration: 0.1 mV (field), 15 mV (spike traces), 5 mV (postsynaptic potentials), 0.5 s.
Figure 7.
Figure 7.
Relative interlaminar spike times and directed coherence show superficial layer sparse spike patterns reflected back from layer 5. A, Example spike raster grams of 5 s data from five units in each of three classes: units in layer 5 demonstrating overt bursting phase locked to the field delta rhythm [presumed layer 5 IB neurons (L5 bursting)], units in layer 5 demonstrating single or double spikes or continuous theta-frequency spiking (presumed layer 5 RS neurons), and units in layers 2/3 demonstrating sparse spiking [<1 spike on average per field delta period (presumed L2/3 RS neurons)]. Scale bar, 1 s. B, Mean (n = 5 units per N = 5 slices) spike–spike cross-correlograms for presumed L5 RS versus L2/3 RS neurons (red), L2/3 RS units versus L5 field delta rhythm (black), and L5 RS neuron units versus L5 field delta rhythm (blue). Note the temporal order of occurrence of the double peaks for the L2/3 and L5 RS units is reversed for the second compared with the first spike maxima per field delta period (arrows). C, Directed coherence estimates per delta period from concurrently recorded field potentials in layers 2 and 5. L2/3→L5 (cool color map) shows a peak in directed coherence early in the delta period at ∼4 Hz. L5→L2/3 (hot color map) shows delta frequency directed coherence throughout the period but a maximum in the theta range later in the delta period.

References

    1. Aeschbach D. Slow waves and learning: beyond correlations. Sleep. 2009;32:1253–1254. - PMC - PubMed
    1. Amzica F, Steriade M. Electrophysiological correlates of sleep delta waves. Electroencephalogr Clin Neurophysiol. 1998;107:69–83. doi: 10.1016/S0013-4694(98)00051-0. - DOI - PubMed
    1. Amzica F, Nuñez A, Steriade M. Delta frequency (1–4 Hz) oscillations of perigeniculate thalamic neurons and their modulation by light. Neuroscience. 1992;51:285–294. doi: 10.1016/0306-4522(92)90315-S. - DOI - PubMed
    1. Armstrong-James M, Fox K. Evidence for a specific role for cortical NMDA receptors in slow-wave sleep. Brain Res. 1988;451:189–196. doi: 10.1016/0006-8993(88)90763-9. - DOI - PubMed
    1. Aton SJ, Seibt J, Dumoulin M, Jha SK, Steinmetz N, Coleman T, Naidoo N, Frank MG. Mechanisms of sleep-dependent consolidation of cortical plasticity. Neuron. 2009;61:454–466. doi: 10.1016/j.neuron.2009.01.007. - DOI - PMC - PubMed

Publication types

LinkOut - more resources