. 2013 Jun 26;33(26):10875-86.
doi: 10.1523/JNEUROSCI.0896-13.2013.

Pattern of innervation and recruitment of different classes of motoneurons in adult zebrafish

Affiliations

Pattern of innervation and recruitment of different classes of motoneurons in adult zebrafish

Konstantinos Ampatzis et al. J Neurosci. .

Abstract

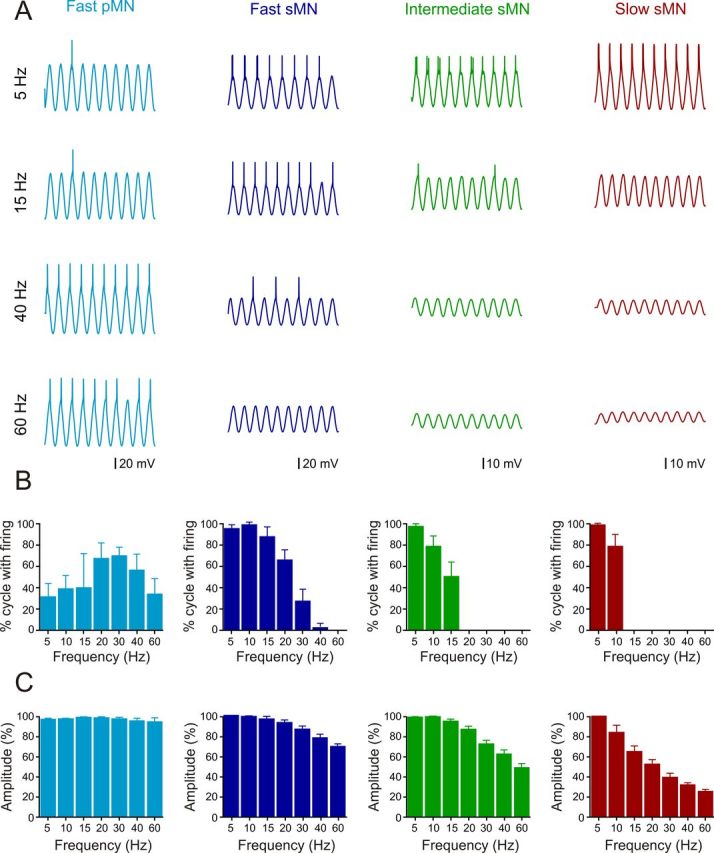
In vertebrates, spinal circuits drive rhythmic firing in motoneurons in the appropriate sequence to produce locomotor movements. These circuits become active early during development and mature gradually to acquire the flexibility necessary to accommodate the increased behavioral repertoire of adult animals. The focus here is to elucidate how different pools of motoneurons are organized and recruited and how membrane properties contribute to their mode of operation. For this purpose, we have used the in vitro preparation of adult zebrafish. We show that different motoneuron pools are organized in a somatotopic fashion in the motor column related to the type of muscle fibers (slow, intermediate, fast) they innervate. During swimming, the different motoneuron pools are recruited in a stepwise manner from slow, to intermediate, to fast to cover the full range of locomotor frequencies seen in intact animals. The spike threshold, filtering properties, and firing patterns of the different motoneuron pools are graded in a manner that relates to their order of recruitment. Our results thus show that motoneurons in adult zebrafish are organized into distinct modules, each with defined locations, properties, and recruitment patterns tuned to precisely match the muscle properties and hence produce swimming of different speeds and modalities.


Figures

Figure 1.
Figure 1.
Organization of MNs innervating the different muscle types. A, Schematic showing the location of the injection sites in fast muscles. B, Fast MNs are located in the dorsal part of the motor column and comprise pMNs and dorsal sMNs. Middle pMN (MiP) innervating the epaxial and caudal pMN (CaP) innervating the ventral aspect of the hypaxial muscle are labeled in these experiments. C, Site of injection of fluorescent dye in the slow and intermediate muscles at the level of the myoseptum. D, Slow and intermediate MNs are located in the ventral part of the motor column. E, Simultaneous dye injections into fast and slow/intermediate muscles. F, Fast MNs (green) are located in the dorsal part of the motor column and can be distinguished from the ventrally located slow/intermediate MNs (red). The dashed lines in B, D, and F delineate the dorsal and ventral aspects of the spinal cord.
Figure 2.
Figure 2.
Somatotopic organization of MNs in adult zebrafish. A, Schematic showing the sites of injections into the different parts of the axial muscles (red, slow; green, intermediate; gray, fast). B, Slow MNs labeled by injection of slow muscle. C, Depth analysis shows that slow MNs are located in the lateral aspect of the motor column. D, Slow and intermediate MNs labeled by injection of a fluorescent dye in slow and intermediate muscles. E, The labeled MNs are located in the ventral aspect of the motor column and extend along the lateromedial axis. F, Graph showing the distance of the MNs retrogradely labeled by injecting a fluorescent dye in slow, intermediate/slow, and fast muscle. G, Position of the different MNs in the motor column labeled by injections into only slow muscles, into slow and intermediate muscles, and into fast muscles. The dorsoventral position of the different MNs is set relative to the Mauthner axon and dorsal edge of the spinal cord.
Figure 3.
Figure 3.
Stimulation of descending inputs elicits escape and swimming. A, Experimental setup with the different sites of stimulation. B, Prelabeled MNs are visualized and targeted for patch-clamp recordings. C, Stimulation at the junction between the brainstem and spinal cord (site 2) induces a long episode of swimming with varying frequencies. D, Stimulation at the Mauthner cell region (site 1) induces escape following by a short locomotor bout at high frequencies.
Figure 4.
Figure 4.
Frequency-dependent recruitment pattern of the different types of MNs. A, Fast pMNs are only recruited during escape induced by stimulation at the Mauthner cell region, but are never active during swimming, even at very high frequencies. B, Fast sMNs are recruited during the escape burst and also during swimming at high frequencies. C, Intermediate MNs are recruited both at slow and fast swimming frequencies. D, Slow MNs are not active during escape. They are recruited during slow swimming and do not become derecruited at high swimming frequencies. E, Graph showing recruitment of the different MNs as a function of the instantaneous swimming burst frequency. Secondary MN pools are recruited in a stepwise manner. Individual data points represent the instantaneous swimming frequencies of all swimming cycles where the respective MN produced at least one action potential.
Figure 5.
Figure 5.
Action potential waveform properties in the different MN pools. A, The shape of action potentials differ between the different MN pools. Each trace is an average of 30 sweeps with the stimulation artifact subtracted. Bottom traces show normalized action potentials aligned at the peak. B, Plot showing the difference in the action potential threshold for the different MNs. C, Graph showing the differences in the peak amplitude of the action potentials in the different MN pools. D, Graph showing the action potential half-width in the different MNs. E, Graph showing the mean afterhyperpolarization amplitude in the different MNs.
Figure 6.
Figure 6.
The different MN pools display distinct firing patterns. A, Fast pMNs show strong spike frequency adaptation even at high stimulation intensities. B, Fast sMNs also display strong spike frequency adaptation that terminates their firing before the end of the stimulation current step. C, Intermediate sMNs fire continuously in response to depolarizing current pulses. D, Slow sMNs fire in bursts of action potentials that increase in frequency as a function of the strength of the stimulation current. E, Plot showing the frequency between the two first action potentials in the different pools of MNs.
Figure 7.
Figure 7.
Effect of the passive properties on the firing reliability of the different MNs. A, Change in the firing reliability in the different MNs in response to increased frequency of a sinusoidal current injection. B, Graph showing the change in the firing of the different MNs as a function of the sinusoidal current frequency. C, Graph showing the change in the amplitude of the membrane potential depolarization as a function of the frequency of the injected current in the different pools of MNs.
Figure 8.
Figure 8.
Morphological features of the different MN pools. A, Representative examples of reconstructed MNs filled with neurobiotin. The position and orientation within the spinal cord segments (gray area) are represented with somas (black), axons (blue), and dendrites (red). B, Geometric maps of dendritic and axonal arbors of different MNs. The dendritic processes were aligned to the soma position with dotted concentric circles separated by 20 μm distance for Sholl analysis. C, Two-dimensional contour maps of dendritic arbors expressed as line density based on the digitized images after a Gaussian blur smoothing. Percentages refer to line density with 100% as maximum line density. D, Sholl analysis of the reconstructed MNs. The number of dendritic intersections plotted as a function of radial distance from the soma. The peak of the intersection curve lying ∼20–40 μm from the soma. Vertical bars represent SEM.
Figure 9.
Figure 9.
Morphological and physiological properties defining the different MN pools. A, PCA based on morphological features of the different MNs segregates sMNs from pMNs. B, PCA analysis of physiological properties of the different MNs allows segregation of slow/intermediate from fast MNs. C, The combined PCA analysis of morphological and physiological properties allows distinction of slow, intermediate, and fast sMNs in addition to pMNs. D, Schematic summary of the organization and order of recruitment of the different MN pools in adult zebrafish.

References

    1. Ausborn J, Mahmood R, El Manira A. Decoding the rules of recruitment of excitatory interneurons in the adult zebrafish locomotor network. Proc Natl Acad Sci U S A. 2012;109:E3631–E3639. doi: 10.1073/pnas.1216256110. - DOI - PMC - PubMed
    1. Bender KJ, Rangel J, Feldman DE. Development of columnar topography in the excitatory layer 4 to layer 2/3 projection in rat barrel cortex. J Neurosci. 2003;23:8759–8770. - PMC - PubMed
    1. Bernhardt RR, Chitnis AB, Lindamer L, Kuwada JY. Identification of spinal neurons in the embryonic and larval zebrafish. J Comp Neurol. 1990;302:603–616. doi: 10.1002/cne.903020315. - DOI - PubMed
    1. Bone Q, Kiceniuk J, Jones DR. On the role of the different fibre types in fish myotomes at intermediate swimming speeds. Fishery Bull. 1978;76:691–699.
    1. Budick SA, O'Malley DM. Locomotor repertoire of the larval zebrafish: swimming, turning and prey capture. J Exp Biol. 2000;203:2565–2579. - PubMed

Publication types

MeSH terms

LinkOut - more resources