. 2013 Aug;54(8):1278-84.
doi: 10.2967/jnumed.112.116558. Epub 2013 Jun 26.

Loss of olfactory tract integrity affects cortical metabolism in the brain and olfactory regions in aging and mild cognitive impairment

Affiliations

Loss of olfactory tract integrity affects cortical metabolism in the brain and olfactory regions in aging and mild cognitive impairment

Donna J Cross et al. J Nucl Med. 2013 Aug.

Abstract

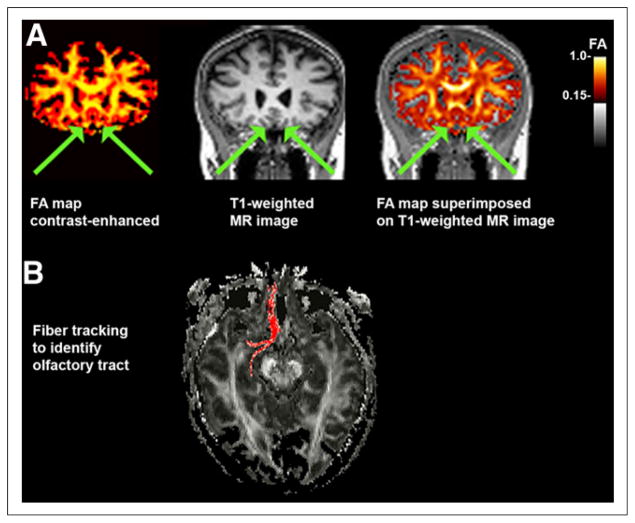
Olfactory dysfunction is an early feature of Alzheimer disease. This study used multimodal imaging of PET and (18)F-FDG combined with diffusion tensor imaging (DTI) to investigate the association of fiber tract integrity in the olfactory tract with cortical glucose metabolism in subjects with mild cognitive impairment (MCI) and normal controls. We hypothesized that MCI subjects would show loss of olfactory tract integrity and may have altered associations with glucose metabolism.

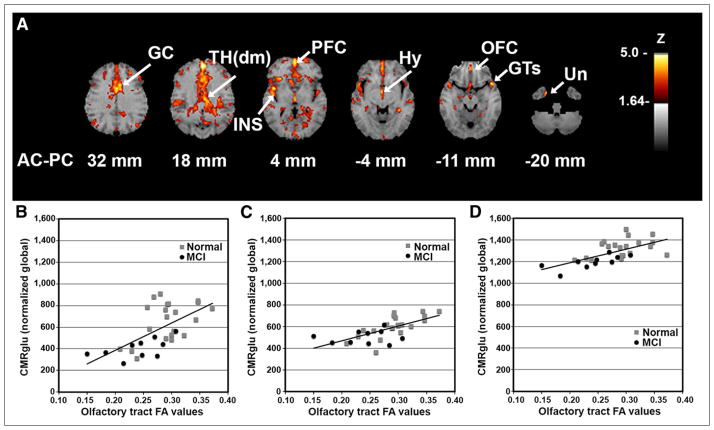
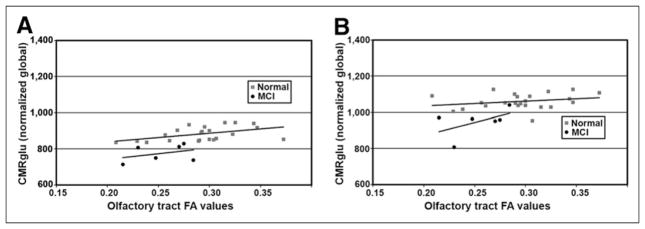
Methods: Subjects diagnosed with amnestic MCI (n = 12) and normal controls (n = 23) received standard brain (18)F-FDG PET and DTI with 32 gradient directions on a 3-T MR imaging scanner. Fractional anisotropy (FA) maps were generated. Voxelwise correlation analysis of olfactory tract FA values with (18)F-FDG PET images was performed.

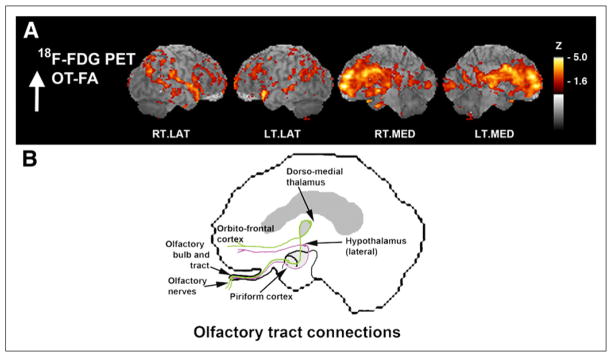
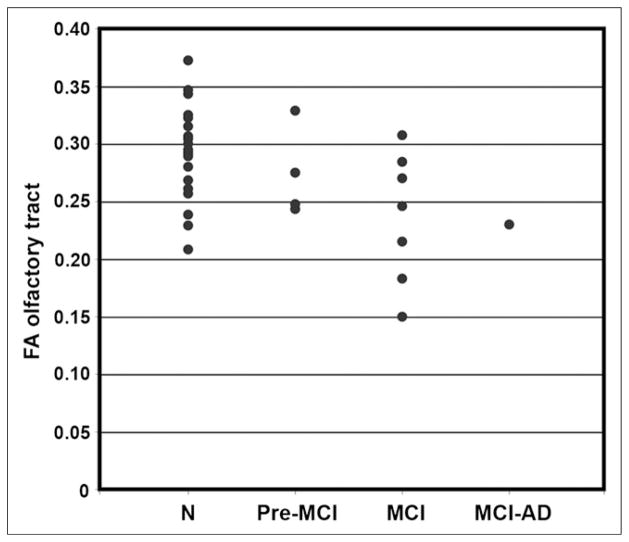
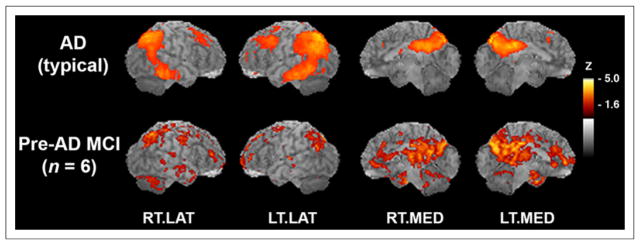
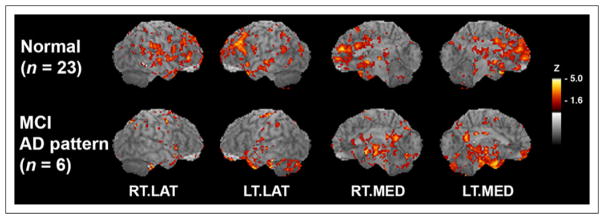
Results: Integrated analysis over all subjects indicated a positive correlation between white matter integrity in the olfactory tract and metabolic activity in olfactory processing structures, including the rostral prefrontal cortex, dorsomedial thalamus, hypothalamus, orbitofrontal cortex, and uncus, and in the superior temporal gyrus, insula, and anterior cingulate cortex. Subjects with MCI, compared with normal controls, showed differential associations of olfactory tract integrity with medial temporal lobe and posterior cortical structures.

Conclusion: These findings indicate that impairment of axonal integrity or neuronal loss may be linked to functional metabolic changes and that disease-specific neurodegeneration may affect this relationship. Multimodal imaging using (18)F-FDG PET and DTI may provide better insights into aging and neurodegenerative processes.

Keywords: 18F-FDG PET; Alzheimer’s disease; DTI; fiber tract integrity; glucose metabolism; olfactory tract.


Figures

FIGURE 1
FIGURE 1
FA image registration and selection of OT ROIs. (A) Example of FA map (color-enhanced to orange scale for better viewing with superimposition) coregistered to T1-weighted MR image in coronal plane. OT is indicated with arrows. (B) In some cases, ROI placement was confirmed with fiber tracking using ROI coordinate as seed point.
FIGURE 2
FIGURE 2
Cortical glucose metabolism associated with OT integrity. (A) Voxelwise linear regression of FA values in OT with 18F-FDG PET images across all subjects (n = 33) reveal significant peaks in structures with anatomic and functional connectivity to olfactory input. Correlation coefficients converted to z score maps and superimposed to structural MR imaging for better localization of peaks. Images are displayed in transverse plane with slice levels indicated according to atlas (25). Significant peaks are as indicated by arrows and labels. (B–D) Scatterplots of individual OT FA values versus regional glucose metabolism (CMRglu) normalized to global values are shown for selected structures: Th(dm) (B), Hy (C), and OFC (D). Although correlation analysis was performed across entire group, normal vs. MCI individual values are indicated by gray squares vs. black circles, respectively. Peaks with z scores ≥ 3.8 were considered statistically significant, controlling type I error rate approximately at P value of 0.05 after correction for multiple comparisons based on image smoothness and voxel number (28). Hy = hypothalamus; INS = insula; Un = uncus.
FIGURE 3
FIGURE 3
Surface-projected z score maps of glucose metabolism associated with OT integrity to illustrate agreement with olfactory connectivity. (A) Sagittal views, as indicated by z score maps, are superimposed onto structural MR image from analysis indicated in Figure 2. (B) OT connections are indicated in simplified schematic of olfactory system connectivity for reference purposes. Sagittal aspects are noted. RT.LAT = right lateral; LT.LAT = left lateral; RT.MED = right medial; LT.MED = left medial.
FIGURE 4
FIGURE 4
Scatterplot of FA in OT separated by diagnostic group. Groups are defined as follows: N = normal controls; Pre-MCI = clinical diagnosis changed between normal and MCI over multiple follow-ups but was normal at time of scanning; MCI = clinical diagnosis of MCI at time of scanning; and MCI-AD, 1 subject diagnosed as MCI at time of scanning who progressed to AD diagnosis on subsequent clinical follow-up.
FIGURE 5
FIGURE 5
Six subjects with MCI show AD-typical pattern of hypometabolism. (Top) AD-typical pattern of hypometabolic deficits that was reanalyzed from previously published study (n = 37 probable AD vs. n = 22 normal controls) (15). In subjects with AD, 18F-FDG PET images were compared with those of normal controls in voxelwise subtraction analysis and P values converted to z scores. Resultant z score map was superimposed to anatomic MR image for better visualization of hypometabolic pattern. (Bottom) Hypometabolic pattern from pre-AD MCI subjects in current study, as compared with normal controls in voxelwise subtraction analysis with P values converted to z scores. Sagittal aspects are noted. RT.LAT = right lateral; LT.LAT = left lateral; RT.MED = right medial; LT.MED = left medial.
FIGURE 6
FIGURE 6
OT integrity shows differential association between MCI and normal controls. Voxelwise correlation maps of OT integrity to glucose metabolism with correlation coefficients converted to z scores and resultant z score maps superimposed on structural MR image for peak localization. Normal control group in comparison to group of pre-AD MCI subjects on bottom row. As compared with normal controls, pre-AD MCI shows additional association of OT integrity with medial temporal lobe and posterior cortical metabolism. Sagittal aspects are noted. RT.LAT = right lateral; LT.LAT = left lateral; RT.MED = right medial; LT.MED = left medial.
FIGURE 7
FIGURE 7
Scatterplots comparing OT integrity to glucose metabolism in anterior and posterior cingulate cortices. (A) Trend lines indicate nearly parallel association for both groups in anterior cingulate. (B) However, in posterior cingulate cortex association was correlated differentially, possibly reflecting underlying disease processes.

References

    1. Albers MW, Tabert MH, Devanand DP. Olfactory dysfunction as a predictor of neurodegenerative disease. Curr Neurol Neurosci Rep. 2006;6:379–386. - PubMed
    1. Bahar-Fuchs A, Chételat G, Villemagne VL, et al. Olfactory deficits and amyloid-β burden in Alzheimer’s disease, mild cognitive impairment, and healthy aging: a PiB PET study. J Alzheimers Dis. 2010;22:1081–1087. - PubMed
    1. Duda JE. Olfactory system pathology as a model of Lewy neurodegenerative disease. J Neurol Sci. 2010;289:49–54. - PubMed
    1. Ross G, Abbott R, Petrovitch H, et al. Association of olfactory dysfunction with incidental Lewy bodies. Mov Disord. 2006;21:2062–2067. - PubMed
    1. Scherfler C, Schocke MF, Seppi K, et al. Voxel-wise analysis of diffusion weighted imaging reveals disruption of the olfactory tract in Parkinson’s disease. Brain. 2006;129:538–542. - PubMed

Publication types

MeSH terms

LinkOut - more resources