. 2013 Sep;51(9):2884-92.
doi: 10.1128/JCM.00845-13. Epub 2013 Jun 26.

Intestinal dysbiosis and depletion of butyrogenic bacteria in Clostridium difficile infection and nosocomial diarrhea

Affiliations

Intestinal dysbiosis and depletion of butyrogenic bacteria in Clostridium difficile infection and nosocomial diarrhea

Vijay C Antharam et al. J Clin Microbiol. 2013 Sep.

Abstract

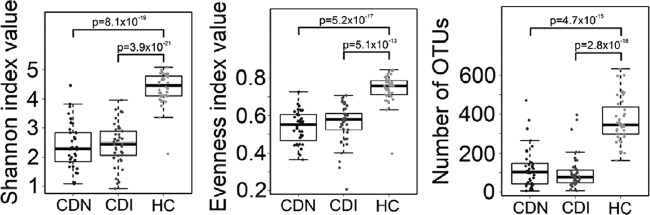
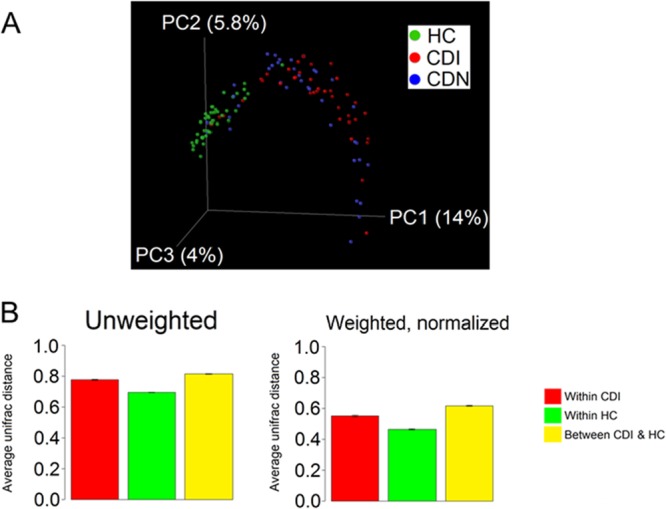
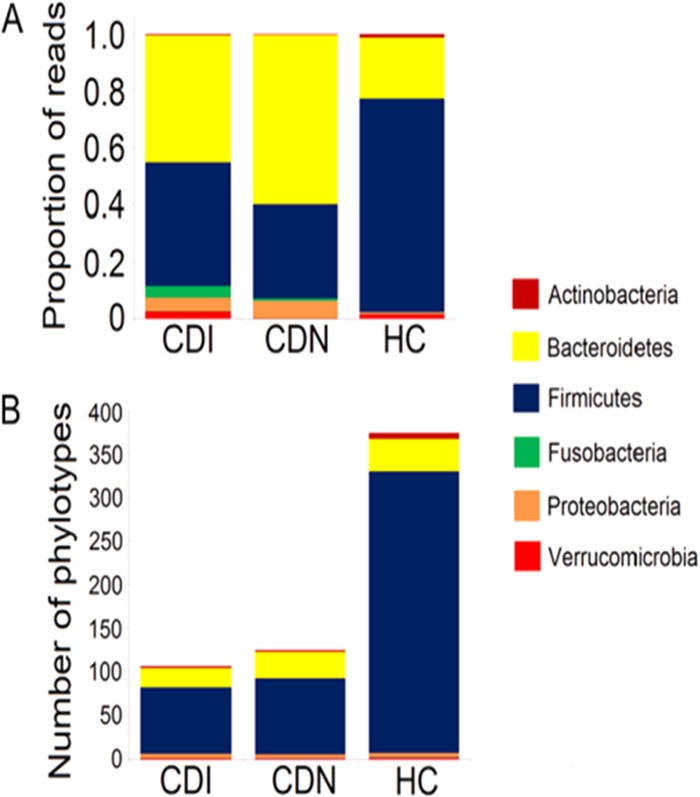
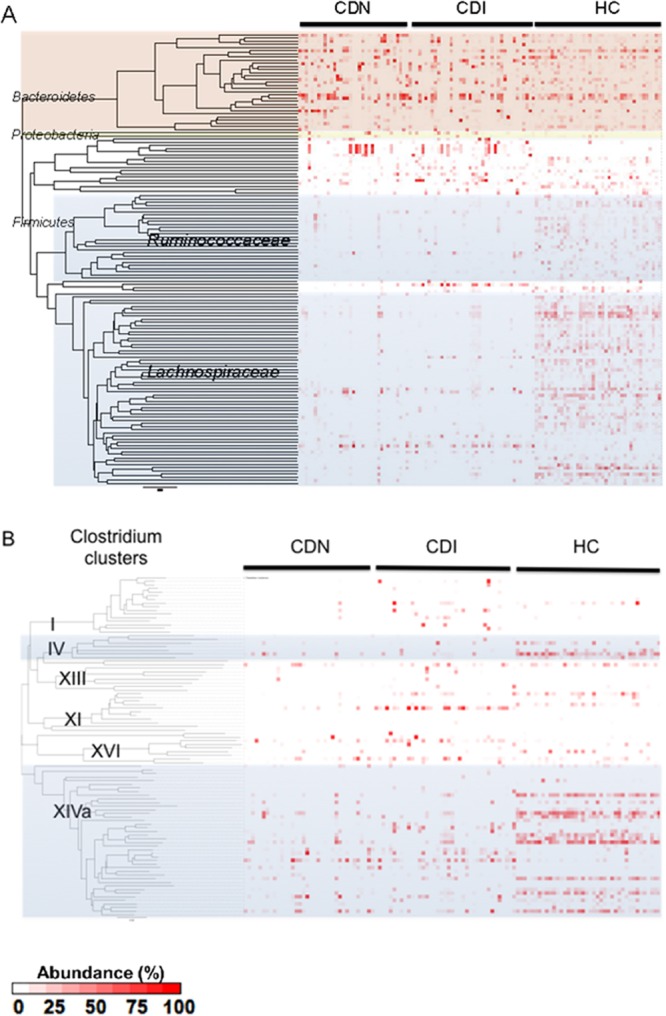
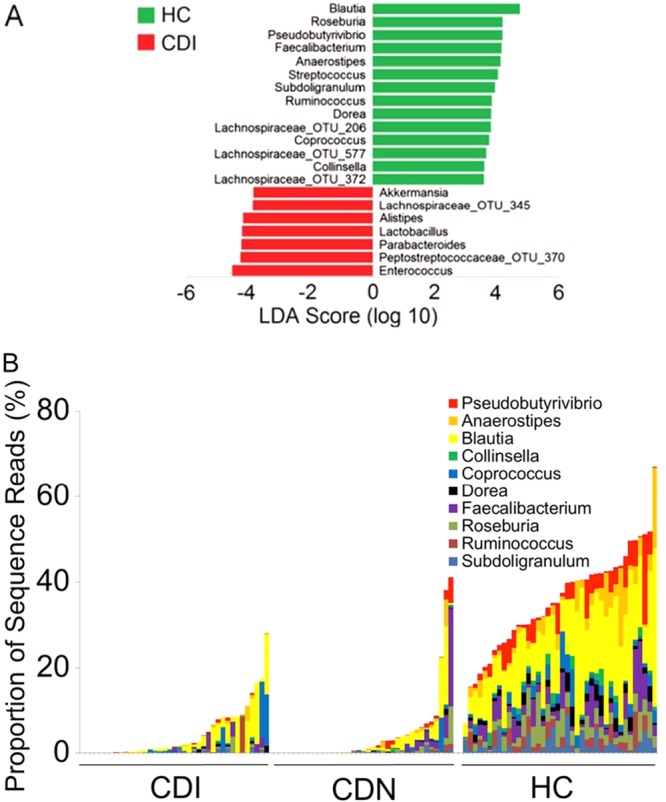
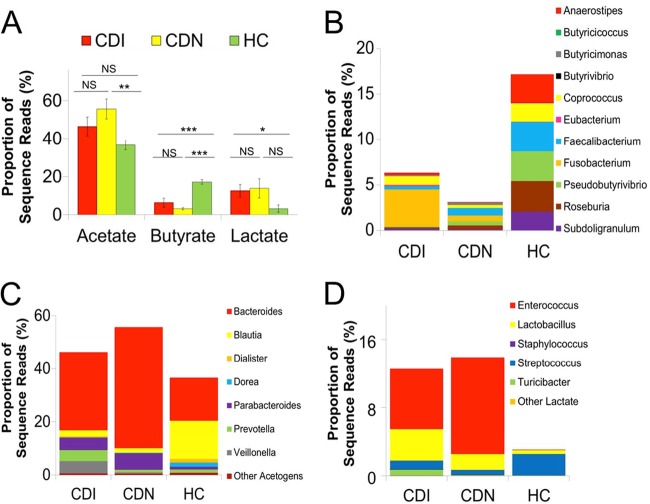
Clostridium difficile infection (CDI) causes nearly half a million cases of diarrhea and colitis in the United States each year. Although the importance of the gut microbiota in C. difficile pathogenesis is well recognized, components of the human gut flora critical for colonization resistance are not known. Culture-independent high-density Roche 454 pyrosequencing was used to survey the distal gut microbiota for 39 individuals with CDI, 36 subjects with C. difficile-negative nosocomial diarrhea (CDN), and 40 healthy control subjects. A total of 526,071 partial 16S rRNA sequence reads of the V1 to V3 regions were aligned with 16S databases, identifying 3,531 bacterial phylotypes from 115 fecal samples. Genomic analysis revealed significant alterations of organism lineages in both the CDI and CDN groups, which were accompanied by marked decreases in microbial diversity and species richness driven primarily by a paucity of phylotypes within the Firmicutes phylum. Normally abundant gut commensal organisms, including the Ruminococcaceae and Lachnospiraceae families and butyrate-producing C2 to C4 anaerobic fermenters, were significantly depleted in the CDI and CDN groups. These data demonstrate associations between the depletion of Ruminococcaceae, Lachnospiraceae, and butyrogenic bacteria in the gut microbiota and nosocomial diarrhea, including C. difficile infection. Mechanistic studies focusing on the functional roles of these organisms in diarrheal diseases and resistance against C. difficile colonization are warranted.


Figures

Fig 1
Fig 1
Decreased microbial diversity, evenness, and species richness in the gut microbiota associated with C. difficile infection and C. difficile-negative nosocomial diarrhea, shown distributed in box plot form. (Left) The Shannon diversity index was used to estimate microbial diversity for each group. (Middle) The species evenness index was calculated using the formula J′ = H′/Hmax, where H′ is the Shannon diversity index and Hmax is the maximal value of H′ (i.e., ln S, where S is the total number of species in the community). (Right) Species richness was defined as the number of refOTUs identified in each sample. All three indices were significantly lower in the CDI and CDN groups than in the healthy control group (Student's t test). No significant difference was observed between the CDI group and the CDN group. Each dot represents an individual fecal sample. P values are shown above the bars for each group comparison.
Fig 2
Fig 2
Comparison of microbial community compositions, revealing an altered gut microbiota in CDI. (A) Unweighted UniFrac analysis was used to generate distances between C. difficile-positive fecal samples (CDI), C. difficile-negative diarrheal samples (CDN), and healthy control samples (HC). Scatterplots were then generated using principal coordinate analysis. The percentage of variation explained by each principal coordinate (PC) is indicated on the axes. Each point represents a microbial community. The difference between communities in the CDI and HC groups was significant (P < 0.001, t test with permutation). (B) Average UniFrac distance between pairs of samples within each group, indicating greater heterogeneity in gut microbial communities in the CDI and CDN groups than in the healthy control group. Error bars, standard error of the mean.
Fig 3
Fig 3
Paucity of Firmicutes sequences and phylotypes in CDI and CDN. (A) The mean proportions of Firmicutes sequences were smaller in the CDI and CDN groups (P = 5.70 × 10⁻⁷ and P = 1.08 × 10⁻⁸, respectively; Student's t test) than in the HC group. (B) The mean numbers of Firmicutes phylotypes (refOTUs) were lower in the CDI and CDN groups (P = 8.81 × 10⁻¹⁹ and P = 7.16 × 10⁻¹⁶, respectively; Student's t test) than in the HC group.
Fig 4
Fig 4
(A) Proportions of bacterial taxa in each sample, as inferred from 16S rRNA gene sequence data. Each column corresponds to an individual fecal sample. Each row corresponds to a specific bacterial phylotype or refOTU, arrayed based on phylogenetic relationships. Only the most prominent refOTUs (>0.1% abundance) are included in this heatmap. The relative abundance of each phylotype is represented by the color code. Members of the Lachnospiraceae and Ruminococcaceae families are shaded in gray. The Bacteroidetes phylum is shown in light red, and the Proteobacteria phylum in yellow. (B) Proportions of bacterial taxa within Clostridium clusters. Each column represents an individual fecal sample. Each row corresponds to a refOTU assigned to one of the 19 Clostridium clusters. Members of Clostridium clusters XIVa and IV are shaded in gray.
Fig 5
Fig 5
Bacteria genera most depleted or enriched in CDI and CDN. (A) Genera most differentially depleted (most of which are butyric acid-producing anaerobic bacteria) or enriched in the C. difficile-associated microbiota versus healthy control microbiota, as identified by linear discriminant analysis (LDA) coupled with effect size measurements. Bacterial taxa depleted in CDI are indicated with positive LDA scores (green), and taxa enriched in CDI are indicated with negative scores (red). Only taxa that met the significant LDA threshold of 3.6 are shown. The same genera were also depleted in CDN (data not shown). (B) Interindividual variations in the relative abundance of selected genera. The overall abundance (sequence reads, y axis) of the 10 most differentially depleted genera (indicated in the key) was significantly lower in the CDI and CDN groups than in the HC group (P = 4.0 × 10⁻²¹ and P = 9.3 × 10⁻²⁰, respectively; Student's t test). Each bar corresponds to an individual sample.
Fig 6
Fig 6
Acetate, butyrate, and lactate fermenters in the gut microbiota. (A) Relative proportions of acetate, butyrate, and lactate fermenters in the gut microbiota in the CDI (red), CDN (yellow), and HC (green) cohorts pyrosequenced. Sequence reads were classified at the genus level according to the primary metabolic end product of carbohydrate fermentation, and results were compared using Student's t test. Genera that were ambiguously defined as producing both acetate and butyrate or other short-chain fatty acids, such as succinate, propionate, formate, or ethanol, comprising minor constituents of the gut microbiota (<1% of sequence reads), were excluded in this analysis. Error bars, standard error of the mean. ∗, P < 0.05; ∗∗, P < 0.01; ∗∗∗, P < 0.001. CDI, C. difficile infection; CDN, C. difficile-negative nosocomial diarrhea; HC, healthy control; NS, not significant. (B) Relative proportions of major butyrate-producing bacteria. (C) Relative proportions of major acetogens by genera. (D) Relative proportions of primary lactic acid-producing organisms.

References

    1. Ananthakrishnan AN. 2011. Clostridium difficile infection: epidemiology, risk factors and management. Nat. Rev. Gastroenterol. Hepatol. 8:17–26 - PubMed
    1. O'Keefe SJ. 2010. Tube feeding, the microbiota, and Clostridium difficile infection. World J. Gastroenterol. 16:139–142 - PMC - PubMed
    1. Parkes GC, Sanderson JD, Whelan K. 2009. The mechanisms and efficacy of probiotics in the prevention of Clostridium difficile-associated diarrhoea. Lancet Infect. Dis. 9:237–244 - PubMed
    1. Pepin J, Alary ME, Valiquette L, Raiche E, Ruel J, Fulop K, Godin D, Bourassa C. 2005. Increasing risk of relapse after treatment of Clostridium difficile colitis in Quebec, Canada. Clin. Infect. Dis. 40:1591–1597 - PubMed
    1. Petrella LA, Sambol SP, Cheknis A, Nagaro K, Kean Y, Sears PS, Babakhani F, Johnson S, Gerding DN. 2012. Decreased cure and increased recurrence rates for Clostridium difficile infection caused by the epidemic C. difficile BI strain. Clin. Infect. Dis. 55:351–357 - PMC - PubMed

Publication types

MeSH terms

Associated data