. 2013 Aug;140(15):3198-209.
doi: 10.1242/dev.095448. Epub 2013 Jun 26.

Rho activation is apically restricted by Arhgap1 in neural crest cells and drives epithelial-to-mesenchymal transition

Affiliations

Rho activation is apically restricted by Arhgap1 in neural crest cells and drives epithelial-to-mesenchymal transition

Matthew R Clay et al. Development. 2013 Aug.

Abstract

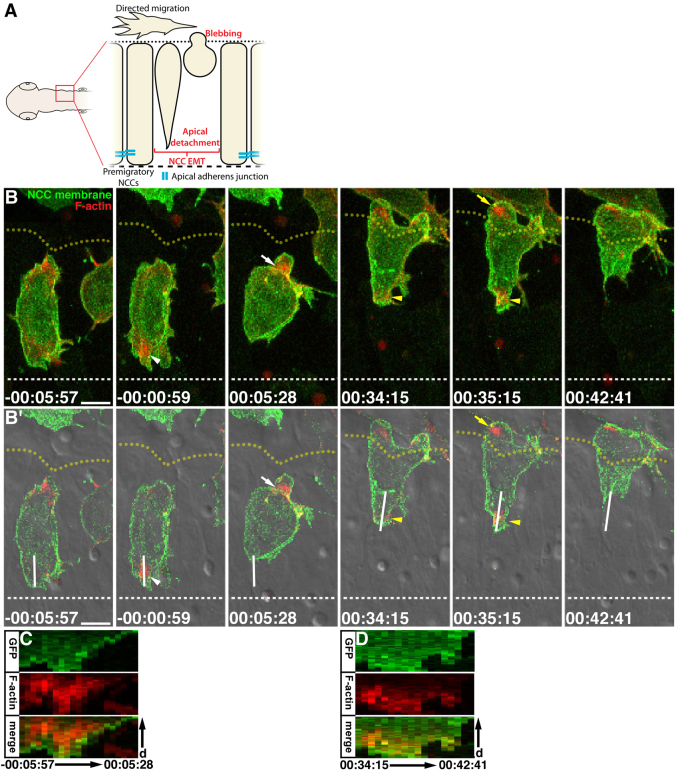
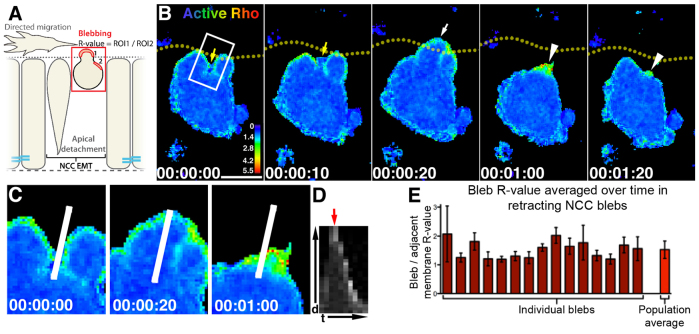
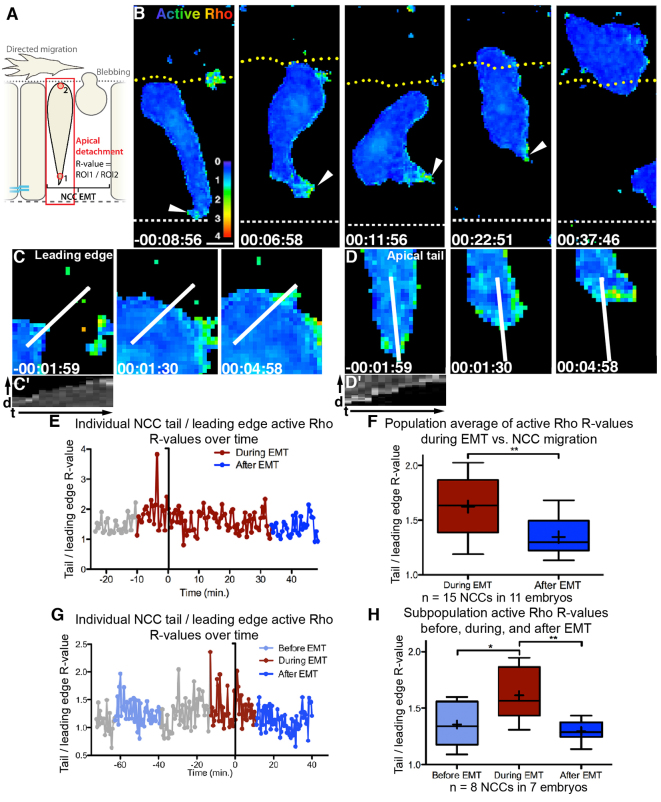
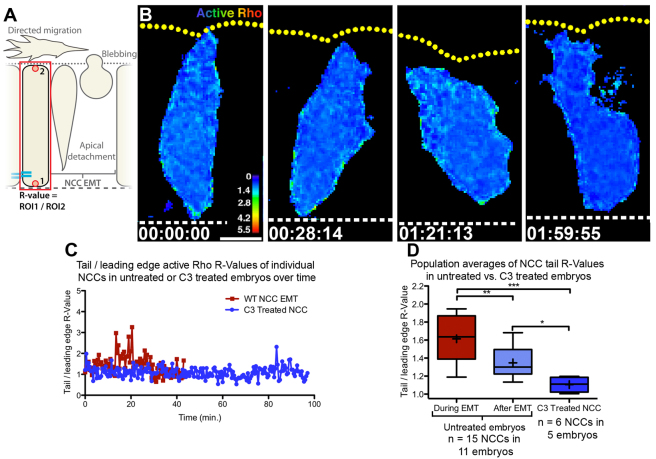
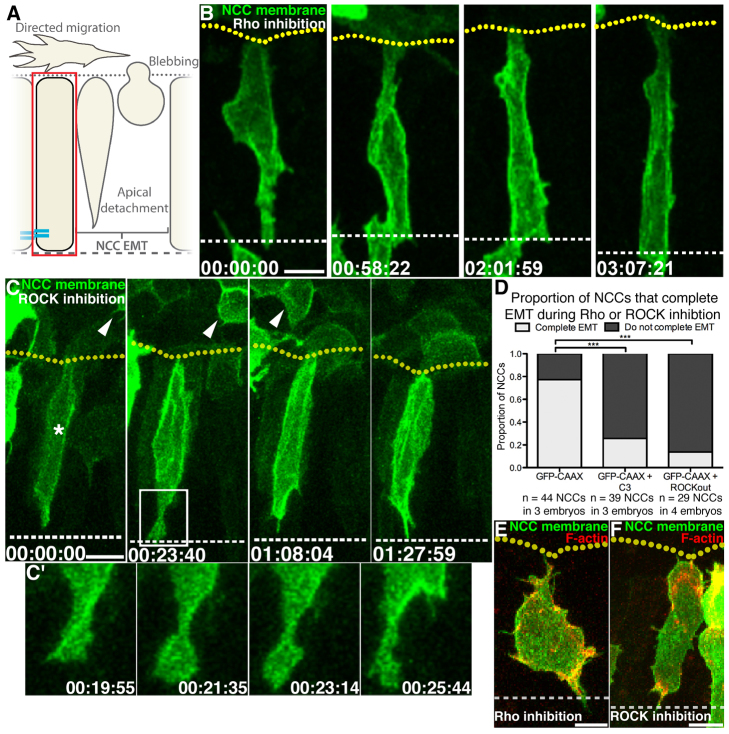
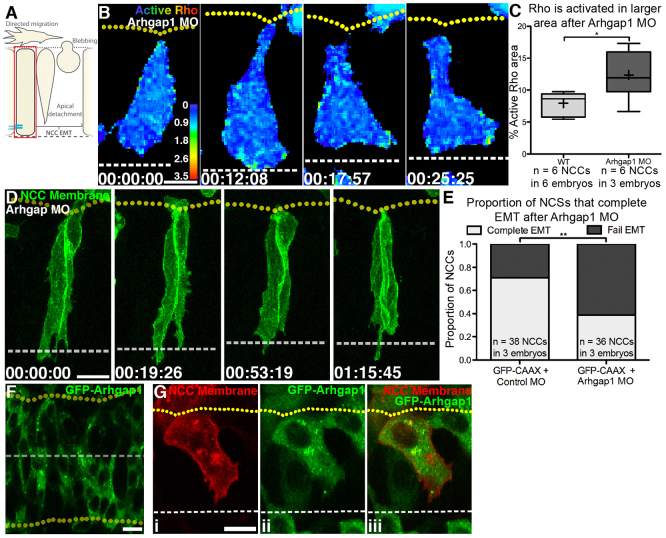
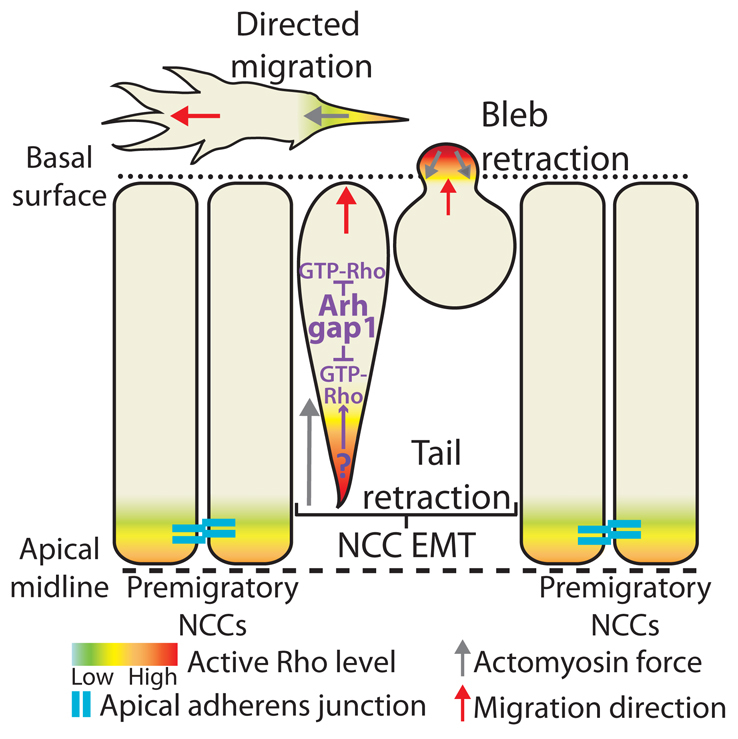
Epithelial-to-mesenchymal transitions (EMTs) are crucial for morphogenesis and carcinoma metastasis, yet mechanisms controlling the underlying cell behaviors are poorly understood. RhoGTPase signaling has been implicated in EMT; however, previous studies have yielded conflicting results regarding Rho function, and its role in EMT remains poorly understood. Elucidation of precise Rho functions has been challenging because Rho signaling is highly context dependent and its activity is tightly regulated spatiotemporally within the cell. To date, few studies have examined how Rho affects cell motility in intact organisms, and the pattern of Rho activity during motile cell behaviors of EMT has not been determined in any system. Here, we image endogenous active Rho during EMT in vivo, and analyze effects of Rho and Rho-kinase (ROCK) manipulation on cell motility in vivo. We show that Rho is activated in a discrete apical region of premigratory neural crest cells during EMT, and Rho-ROCK signaling is essential for apical detachment and generation of motility within the neuroepithelium, a process that has been poorly understood. Furthermore, we find that Arhgap1 restricts Rho activation to apical areas, and this restriction is necessary for detachment. Our results provide new insight into mechanisms controlling local Rho activation and how it affects dynamic cell behaviors and actomyosin contraction during key steps of EMT in an intact living organism.

Keywords: EMT; GAP; Neural crest; RhoGTPase; Zebrafish.


Figures

Fig. 1.
Fig. 1.
F-Actin transiently accumulates in NCC tails prior to detachment and retraction. (A) Imaging region and steps of EMT. (B,B′) Time lapse images (dorsal views, anterior left) of an NCC labeled with GFP-CAAX and mCherry-UtrCH. Yellow dotted lines mark basal neuroepithelial surface. White dashed lines mark apical midline. Apical detachment is 0 minutes. (B) Confocal z-projection. (B′) Z-projection of fluorescence over a single DIC plane, showing lines for kymographs. F-actin increases in apical tail prior to detachment (white arrowhead) and during later tail retraction (yellow arrowheads). Blebs protrude away from underlying F-actin (white arrows), which fills blebs as they retract (yellow arrow). (C,D) Kymographs showing GFP-CAAX and mCherry-UtrCH. Scale bars: 10 μm. Time is given as hours:minutes:seconds.
Fig. 2.
Fig. 2.
Active Rho is elevated in retracting NCC blebs. (A) Schematic showing imaging region. (B) Time-lapse images (dorsal views, anterior left, confocal z-projections) of an NCC expressing GFPrGBD and mCherry. Yellow arrow indicates forming bleb. Rho is activated at maximal bleb extension (white arrow) and in retracting blebs (arrowheads). Box outlines area shown in C. Look-up table shows GFP/mCherry intensity. Yellow dotted lines mark basal neuroepithelial surface. (C) Higher magnification of bleb showing line for kymograph. (D) Kymograph of GFP/mCherry. Red arrow indicates maximal bleb extension. (E) Active Rho R-values in retracting blebs (ROI in bleb/ROI in non-bleb membrane, see supplementary material Fig. S1). R-values above 1.0 indicate Rho activation. Pairwise comparisons (Tukey’s multiple comparisons test) showed no differences between blebs. Scale bar: 10 μm. Time is given as hours:minutes:seconds.
Fig. 3.
Fig. 3.
Active Rho is elevated in retracting NCC tails. (A) Imaging region. (B) Time-lapse images (dorsal views, anterior left, confocal z-projections) of an NCC expressing GFPrGBD and mCherry. Rho is activated during tail detachment and retraction (arrowheads). Look-up table shows GFP/mCherry intensity. Yellow dotted lines mark basal neuroepithelial surface. White dashed lines mark apical midline. In B-D,E,G), detachment is 0 minutes. (C,D) Zoom views of leading edge (C) and apical tail (D) showing lines for kymographs. (C′,D′) Kymographs of GFP/mCherry. (E) Tail/leading edge active Rho R-value over time for NCC in B. Gray plots before EMT are not included in F. (F) Population average of active Rho R-values (**P<0.01, paired two-tailed, t-test). (G) Plot of individual NCC R-Value starting 70 minutes before detachment. Gray plots not included in H. (H) Subpopulation average of active Rho R-values (*P<0.05,**P<0.01, Tukey’s multiple comparisons test). Scale bar: 10 μm. Time is given as hours:minutes:seconds.
Fig. 4.
Fig. 4.
C3 treatment eliminates active Rho localization. (A) Imaging region. (B) Time-lapse images (dorsal views, anterior left, confocal z-projections) of an NCC labeled with GFPrGBD and mCherry and treated with C3. The cell shows no distinct active Rho localization and fails to undergo EMT over 3 hours. Look-up table shows GFP/mCherry intensity. Yellow dotted lines mark basal neuroepithelial surface. White dashed lines mark apical midline. (C) Active Rho NCC tail R-values for individual NCC in C3-treated embryo over time (blue). NCCs from untreated embryos shown for reference (red). (D) Population average of active Rho R-values (***P<0.001, **P<0.01, *P<0.05, Tukey’s multiple comparisons test). Scale bar: 10 μm. Time is given as hours:minutes:seconds.
Fig. 5.
Fig. 5.
Rho or ROCK inhibition disrupts apical detachment and NCC EMT. (A) Imaging region. (B-C′,E,F) Confocal images (dorsal views, anterior left, z-projections). Yellow dotted lines mark basal neuroepithelial surfaces. White dashed lines mark apical midlines. (B) Time lapse of a GFP-CAAX-labeled NCC in an embryo treated with C3. NCC does not undergo apical detachment or EMT. (C) Time lapse of GFP-CAAX-labeled NCCs in an embryo treated with ROCKout. The NCC in the neuroepithelium (asterisk) does not detach. An NCC that delaminated before imaging migrates anteriorly (arrowheads). Box represents area shown in C′. (C′) Protrusive behavior at midline during ROCKout treatment. (D) Proportion of labeled NCCs within neuroepithelium completing EMT (***P<0.0001, Fisher’s exact test). (E,F) Single timepoints of premigratory NCCs labeled with GFP-CAAX and mCherry-UtrCH. F-actin accumulates in the apical tail during C3 (E) or ROCKout (F) treatment. Scale bars: 10 μM. Time is given as hours:minutes:seconds.
Fig. 6.
Fig. 6.
Arhgap1 knockdown leads to expanded Rho activation and disrupts EMT. (A) Imaging region. (B,D,F,G) Confocal images (dorsal views, anterior left, z-projections). Yellow dotted lines mark basal neuroepithelial surfaces. White dashed lines mark apical midlines. (B) Time lapse of an NCC labeled with GFPrGBD and mCherry in an embryo injected with Arhgap1 morpholino. (C) Proportion of total cell area above active Rho threshold (*P<0.05, unpaired two-tailed t-test). (D) Time lapse of NCCs labeled with GFP-CAAX in an embryo injected with Arhgap1 morpholino. Cells do not undergo detachment or initiate EMT. (E) Proportion of labeled NCCs within neuroepithelium completing EMT (**P<0.001 Fisher’s exact test). (F,G) Single timepoints of embryos broadly expressing GFP-Arhgap1. (F) Neuroepithelial cells show GFP-Arhgap1 throughout cell and in puncta. (G) Premigratory NCC labeled with mCherry-CAAX (i, iii) and GFP-Arhgap1 (ii, iii). GFP-Arhgap1 is sometimes decreased in the apical tail. Scale bars: 10 μm. Time is given as hours:minutes:seconds. MO, morpholino.
Fig. 7.
Fig. 7.
Rho and Arhgap1 function in hindbrain NCC EMT. Premigratory NCCs have low active Rho in apical tails. Rho is activated to higher levels during EMT, which drives detachment via ROCK and actomyosin. Arhgap1 maintains active Rho distribution by suppressing Rho activation in non-apical regions. During EMT, Rho is also activated in retracting blebs. Once NCCs begin directed migration, active Rho is again decreased in trailing tails.

Similar articles

Cited by

References

    1. Ahlstrom J. D., Erickson C. A. (2009). The neural crest epithelial-mesenchymal transition in 4D: a ‘tail’ of multiple non-obligatory cellular mechanisms. Development 136, 1801–1812 - PMC - PubMed
    1. Ahn Y.-H., Gibbons D. L., Chakravarti D., Creighton C. J., Rizvi Z. H., Adams H. P., Pertsemlidis A., Gregory P. A., Wright J. A., Goodall G. J., et al. (2012). ZEB1 drives prometastatic actin cytoskeletal remodeling by downregulating miR-34a expression. J. Clin. Invest. 122, 3170–3183 - PMC - PubMed
    1. Andersen E., Asuri N., Clay M., Halloran M. (2010). Live imaging of cell motility and actin cytoskeleton of individual neurons and neural crest cells in zebrafish embryos. J. Vis. Exp. 36, 1726 - PMC - PubMed
    1. Bakin A. V., Tomlinson A. K., Bhowmick N. A., Moses H. L., Arteaga C. L. (2000). Phosphatidylinositol 3-kinase function is required for transforming growth factor beta-mediated epithelial to mesenchymal transition and cell migration. J. Biol. Chem. 275, 36803–36810 - PubMed
    1. Barfod E. T., Zheng Y., Kuang W. J., Hart M. J., Evans T., Cerione R. A., Ashkenazi A. (1993). Cloning and expression of a human CDC42 GTPase-activating protein reveals a functional SH3-binding domain. J. Biol. Chem. 268, 26059–26062 - PubMed

Publication types

MeSH terms

LinkOut - more resources