. 2013 Jul;33(5):618-40.
doi: 10.1177/0272989X13485157.

Evidence synthesis for decision making 3: heterogeneity--subgroups, meta-regression, bias, and bias-adjustment

Affiliations
Free PMC article

Evidence synthesis for decision making 3: heterogeneity--subgroups, meta-regression, bias, and bias-adjustment

Sofia Dias et al. Med Decis Making. 2013 Jul.
Free PMC article

Abstract

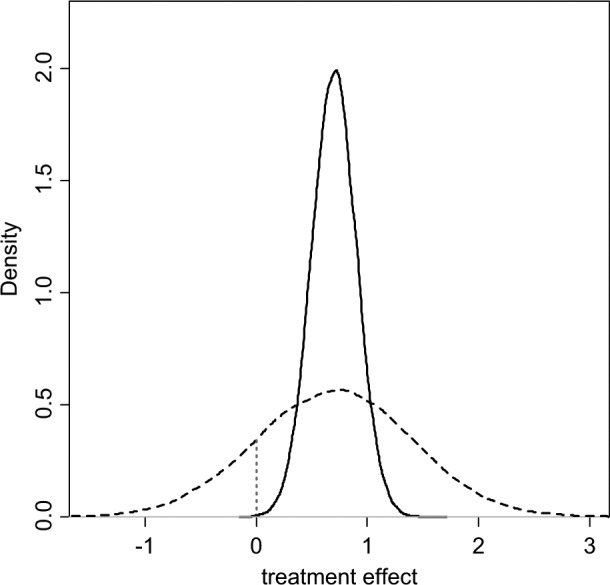
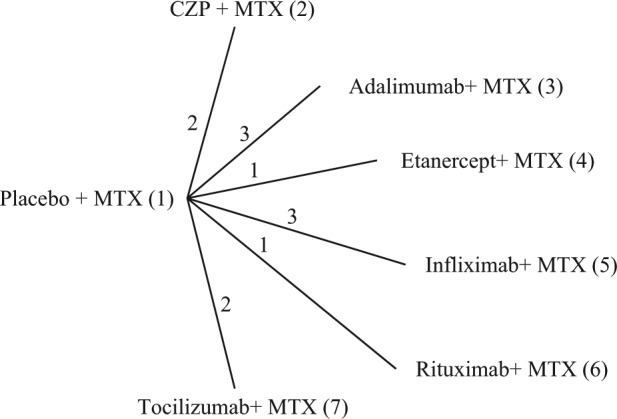
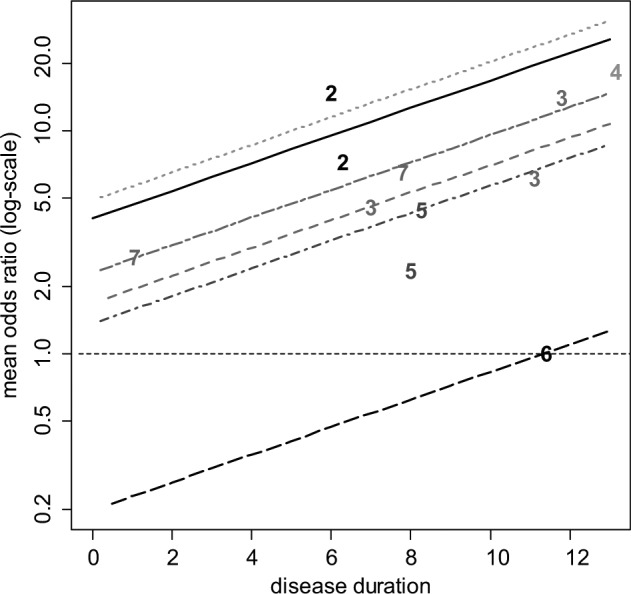
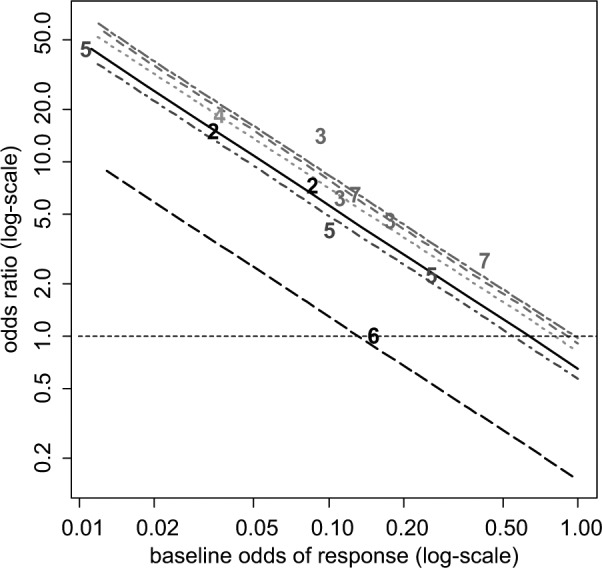
In meta-analysis, between-study heterogeneity indicates the presence of effect-modifiers and has implications for the interpretation of results in cost-effectiveness analysis and decision making. A distinction is usually made between true variability in treatment effects due to variation in patient populations or settings and biases related to the way in which trials were conducted. Variability in relative treatment effects threatens the external validity of trial evidence and limits the ability to generalize from the results; imperfections in trial conduct represent threats to internal validity. We provide guidance on methods for meta-regression and bias-adjustment, in pairwise and network meta-analysis (including indirect comparisons), using illustrative examples. We argue that the predictive distribution of a treatment effect in a "new" trial may, in many cases, be more relevant to decision making than the distribution of the mean effect. Investigators should consider the relative contribution of true variability and random variation due to biases when considering their response to heterogeneity. In network meta-analyses, various types of meta-regression models are possible when trial-level effect-modifying covariates are present or suspected. We argue that a model with a single interaction term is the one most likely to be useful in a decision-making context. Illustrative examples of Bayesian meta-regression against a continuous covariate and meta-regression against "baseline" risk are provided. Annotated WinBUGS code is set out in an appendix.

Keywords: Bayesian meta-analysis; comparative effectiveness; cost-effectiveness analysis; systematic reviews.


Figures

Figure 1
Figure 1
Posterior (solid) and predictive (dashed) densities for a treatment effect with mean = 0.7, standard deviation = 0.2, and heterogeneity (standard deviation) = 0.68. The area under the curve to the left of the vertical dotted line is the probability of a negative value for the treatment effect.
Figure 2
Figure 2
Certolizumab example: treatment network. Lines connecting 2 treatments indicate that a comparison between these treatments has been made. The numbers on the lines indicate how many randomized controlled trials compare the 2 connected treatments. CZP, certolizumab pegol; MTX, methotrexate.
Figure 3
Figure 3
Certolizumab example: plot of the crude odds ratio (OR) (on a log-scale) of the 6 active treatments relative to placebo plus methotrexate (MTX) against mean disease duration (in years). For plotting purposes, the odds of response on placebo plus MTX for the Abe 2006 study were assumed to be 0.01. The plotted numbers refer to the treatment being compared with placebo plus MTX, and the lines represent the relative effects of the following treatments compared with placebo plus MTX based on a random effects meta-regression model (from top to bottom): etanercept plus MTX (treatment 4, dotted green line), certolizumab pegol (CZP) plus MTX (treatment 2, solid black line), tocilizumab plus MTX (treatment 7, short-long dash purple line), adalimumab plus MTX (treatment 3, dashed red line), infliximab plus MTX (treatment 5, dot-dashed dark blue line), and rituximab plus MTX (treatment 6, long-dashed black line). Odds ratios above 1 favor the plotted treatment, and the horizontal line (thin dashed) represents no treatment effect.
Figure 4
Figure 4
Certolizumab example: plot of the crude odds ratio (OR) of the 6 active treatments relative to placebo plus methotrexate (MTX) against odds of baseline response on a log-scale. For plotting purposes, the odds of response on placebo plus MTX for the Abe 2006 study were assumed to be 0.01. The plotted numbers refer to the treatment being compared with placebo plus MTX, and the lines represent the relative effects of the following treatments (from top to bottom) compared with placebo plus MTX based on a random effects meta-regression model: tocilizumab plus MTX (treatment 7, short-long dash purple line), adalimumab plus MTX (treatment 3, dashed red line), etanercept plus MTX (treatment 4, dotted green), certolizumab pegol (CZP) plus MTX (treatment 2, solid black line), infliximab plus MTX (treatment 5, dot-dashed dark blue line), and rituximab plus MTX (treatment 6, long-dashed black line). Odds ratios above 1 favor the plotted treatment, and the horizontal line (dashed) represents no treatment effect.
None

Similar articles

Cited by

References

    1. National Institute for Health and Clinical Excellence (NICE) Guide to the Methods of Technology Appraisal. London, UK: NICE; 2008 - PubMed
    1. Higgins JPT, Green S, eds. Cochrane Handbook for Systematic Reviews of Interventions Version 5.0.0 [updated February 2008]. Chichester, UK: The Cochrane Collaboration, Wiley; 2008
    1. Schulz KF, Chalmers I, Hayes RJ, Altman DG. Empirical evidence of bias: dimensions of methodological quality associated with estimates of treatment effects in controlled trials. JAMA. 1995;273(5):408–12 - PubMed
    1. Wood L, Egger M, Gluud LL, et al. Empirical evidence of bias in treatment effect estimates in controlled trials with different interventions and outcomes: meta-epidemiological study. BMJ. 2008;336:601–5 - PMC - PubMed
    1. Higgins JPT, Thompson SG, Spiegelhalter DJ. A re-evaluation of random-effects meta-analysis. J R Stat Soc Ser A. 2009;172:137–59 - PMC - PubMed

Publication types

LinkOut - more resources