. 2013 Sep;41(16):7905-19.
doi: 10.1093/nar/gkt565. Epub 2013 Jun 26.

miR-195 competes with HuR to modulate stim1 mRNA stability and regulate cell migration

Affiliations

miR-195 competes with HuR to modulate stim1 mRNA stability and regulate cell migration

Ran Zhuang et al. Nucleic Acids Res. 2013 Sep.

Abstract

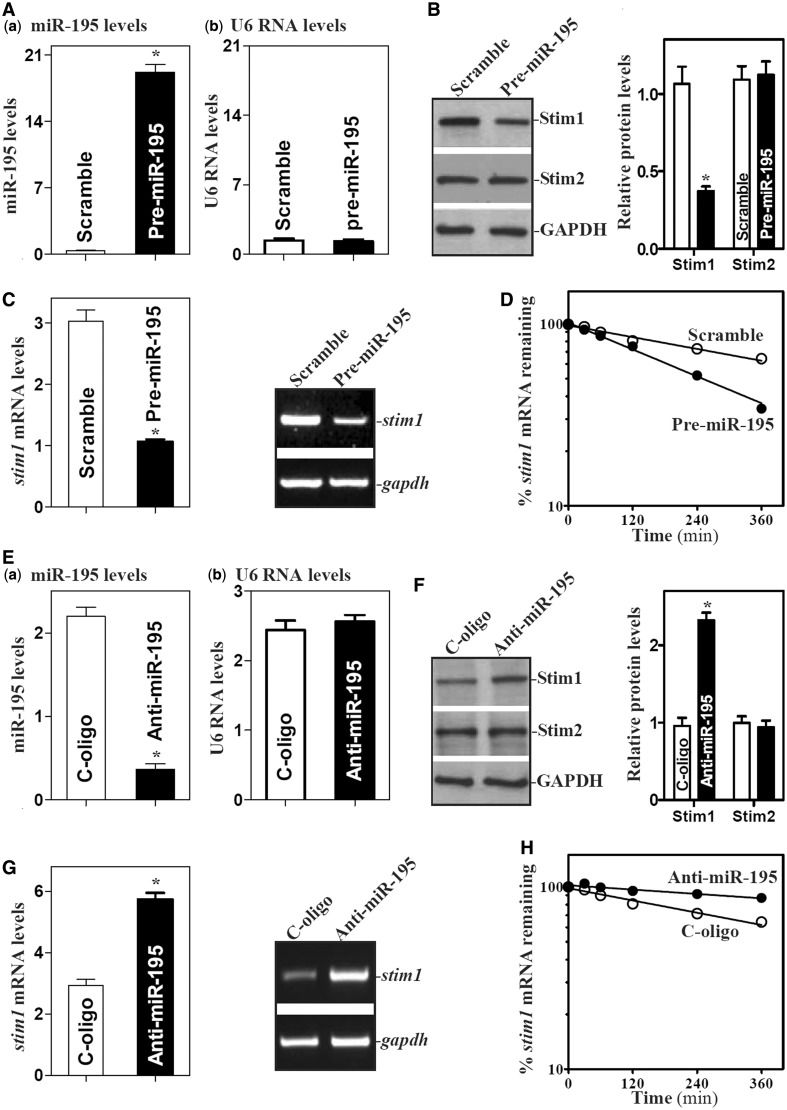
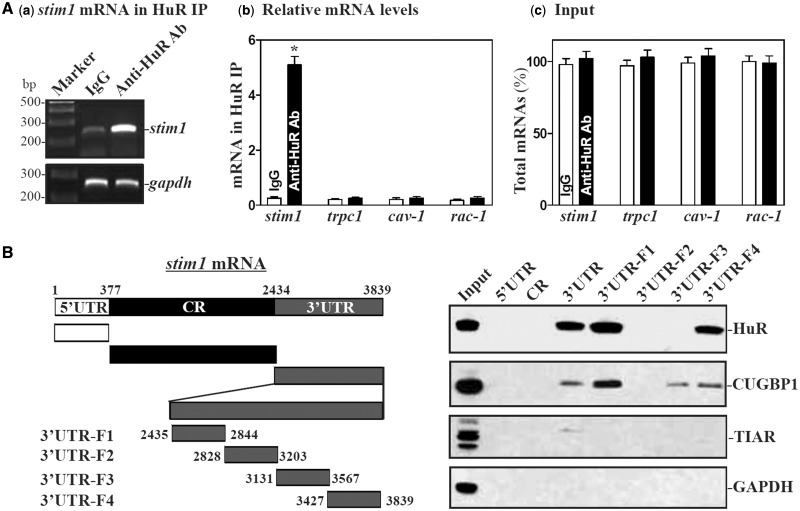
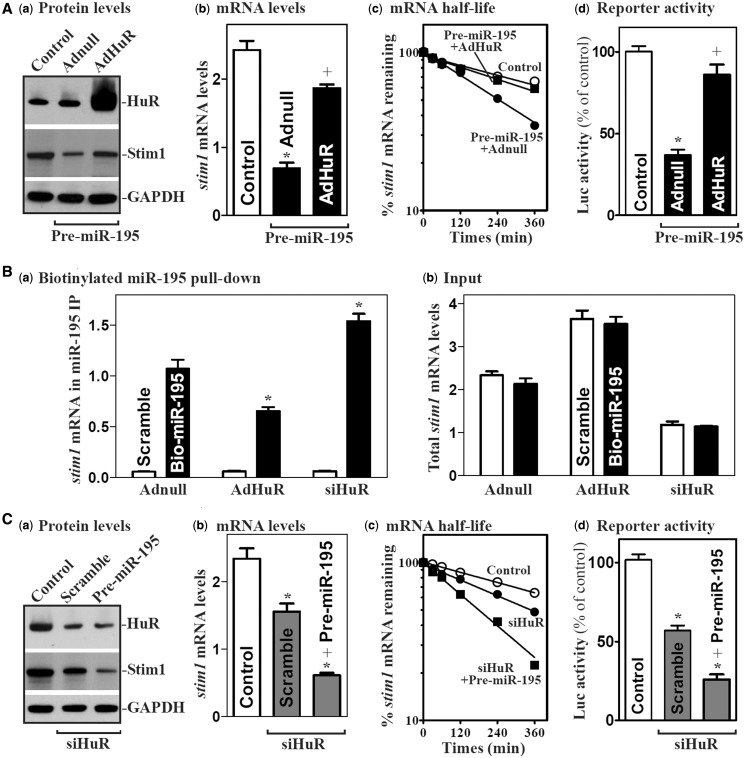
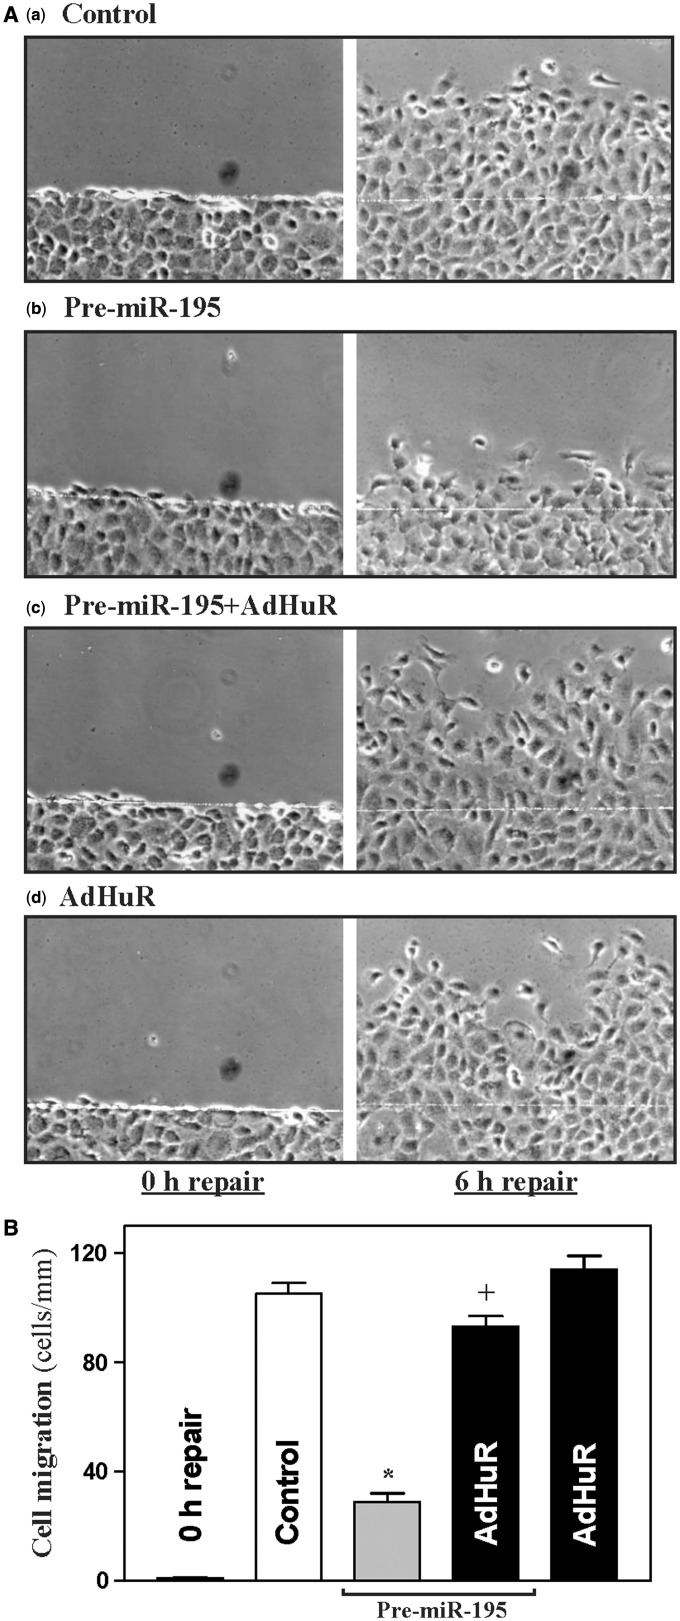
Stromal interaction molecule 1 (Stim1) functions as a sensor of Ca2+ within stores and plays an essential role in the activation of store-operated Ca2+ entry (SOCE). Although lowering Stim1 levels reduces store-operated Ca2+ entry and inhibits intestinal epithelial repair after wounding, the mechanisms that control Stim1 expression remain unknown. Here, we show that cellular Stim1 abundance is controlled posttranscriptionally via factors that associate with 3'-untranslated region (3'-UTR) of stim1 mRNA. MicroRNA-195 (miR-195) and the RNA-binding protein HuR competed for association with the stim1 3'-UTR and regulated stim1 mRNA decay in opposite directions. Interaction of miR-195 with the stim1 3'-UTR destabilized stim1 mRNA, whereas the stability of stim1 mRNA increased with HuR association. Interestingly, ectopic miR-195 overexpression enhanced stim1 mRNA association with argonaute-containing complexes and increased the colocalization of tagged stim1 RNA with processing bodies (P-bodies); the translocation of stim1 mRNA was abolished by HuR overexpression. Moreover, decreased levels of Stim1 by miR-195 overexpression inhibited cell migration over the denuded area after wounding but was rescued by increasing HuR levels. In sum, Stim1 expression is controlled by two factors competing for influence on stim1 mRNA stability: the mRNA-stabilizing protein HuR and the decay-promoting miR-195.


Figures

Figure 1.
Figure 1.
miR-195 associates with the stim1 mRNA. (A) Schematic representation of the stim1 mRNA depicting target site for miR-195 in its 3′-UTR. Alignment of the stim1 mRNA sequence with miR-195: top strand, stim1 mRNA; bottom strand, miR-195. (B) Levels of biotinylated miR-195 after transfection for 24 h: (a) schematic representation of biotinylated miR-195 and scramble oligomer; (b) miR-195 levels as measured by Q-PCR analysis; and (c) U6 RNA levels. Values are the means ± SEM from three separate experiments. *P < 0.05 compared with cells transfected with control scramble oligomer. (C) Binding of biotinylated miR-195 to mRNAs encoding Stim1, TRPC1, Cav-1 and c-Myc: (a) levels of mRNA in the materials pulled down by biotin-miR-195; and (b) levels of total input mRNAs. *P < 0.05 compared with cells transfected with control scramble oligomer. (D) Changes in the levels of miR-195–stim1 mRNA association after addition of fraction of stim1 mRNA sense strand to the reaction medium: (a) schematic representation of stim1 mRNA sense strand (RSS); (b) levels of mRNA in the materials pulled down by biotin-miR-195; and (c) levels of total input mRNAs. *P < 0.01 compared with cells transfected with scrambled oligomer.
Figure 2.
Figure 2.
miR-195 represses Stim1 expression by destabilizing stim1 mRNA. (A) Levels of miR-195 in cells transfected with pre-miR-195 for 48 h as measured by Q-PCR analysis: (a) miR-195 levels; and (b) U6 RNA levels. Values are the means ± SEM from three separate experiments. *P < 0.05 compared with cells transfected with control scramble oligomer. (B) Changes in the levels of Stim1 and STIM2 proteins after ectopic miR-195 overexpression. Whole-cell lysates were prepared for western blotting; equal loading was monitored by assessing GAPDH levels. (C) Levels of stim1 mRNA as examined by Q-PCR (left) or RT-PCR (right) analyses. (D) Half-life of stim1 mRNA in cells overexpressing miR-195 as measured by Q-PCR analysis. Total cellular RNA was isolated at indicated times after administration of actinomycin D (5 µg/ml), and the remaining levels of stim1 and Gapdh mRNAs were measured by Q-PCR analysis. (E–H) Effect of miR-195 silencing on Stim1 expression. Forty-eight hours after cells were transfected with the corresponding oligomer targeting miR-195 (anti-miR-195) or control oligomer (C-oligo), various measurements were performed as described earlier in the text. Values are the means ± SEM from three separate experiments. *P < 0.01 compared with cells transfected with C-oligo.
Figure 3.
Figure 3.
Deletion of miR-195 binding site in stim1 3′UTR prevents miR-195-mediated repression of Stim1. (A) Levels of reporter activities as measured by analysis of stim1 5′UTR, CR or 3′luciferase reporters after ectopic overexpression of miR-195. Top, schematic of plasmids of different chimeric firefly luciferase stim1 reporters. BS, predicted miR-195-binding site. Bottom, levels of activities of luciferase reporters containing stim1 5′UTR, CR or 3′UTR. Twenty-four hours after transfection with pre-miR-195, cells were transfected with different stim1 luciferase reporter plasmids. Levels of firefly and Renilla luciferase activities were assayed 16 h later. Results were normalized to the Renilla luciferase activities and expressed as the means ± SEM data from three separate experiments. *P < 0.05 compared with cells transfected with control scrambled oligomer. (B) Effect of deletion of specific miR-195 binding site (schematic) in stim1 3′UTR on luciferase reporter activities after ectopic miR-195 overexpression. *P < 0.05 compared with cells transfected with control scrambled oligomer. (C) Effect of point-mutation of specific miR-195 binding site (schematic) in stim1 3′UTR on luciferase reporter activities after ectopic miR-195 overexpression. *P < 0.05 compared with cells transfected with control scrambled oligomer.
Figure 4.
Figure 4.
HuR binds to the stim1 3′UTR. (A) Association of endogenous HuR with endogenous Stim1 mRNA. After IP of RNA-protein complexes from cell lysates using either anti-HuR antibody (Ab) or control IgG, RNA was isolated and used in RT reactions. (a) RT-PCR product of Stim1 was visualized in ethidium bromide-stained agarose gels; (b) levels of mRNAs in HuR IP or IgG IP materials as measured by Q-PCR analysis; and (c) levels of total input mRNAs. Values are the means ± SEM from triplicate samples. *P < 0.05 compared with IgG IP. (B) Representative HuR, CUGBP1 and TIAR immunoblots using the pull-down materials by biotinylated transcripts of stim1 5′UTR, CR, 3′UTR and different fragments of 3′UTR. Left panel shows schematic representation of various stim1 biotinylated transcripts used in this study. Cytoplasmic lysates were incubated with 6 µg of biotinylated stim1 5′UTR, CR, 3′UTR and fragments of stim1 3′UTR for 30 min at 25°C, and the resulting RNP complexes were pulled down by streptavidin-coated beads. The presence of HuR, CUGBP1 or TIAR in the pull-down material was assayed by western blotting. GAPDH in the pull-down material was also examined and served as a negative control.
Figure 5.
Figure 5.
HuR enhances Stim1 expression by stabilizing stim1 mRNA. (A) The effect of HuR silencing on Stim1 protein expression. Left panel, representative immunoblots of HuR and Stim1 proteins in HuR-silenced cells. After cells were transfected with either siRNA targeting the HuR mRNA-coding region (siHuR) or control siRNA (C-siRNA) for 48 h, whole cell lysates were harvested for western blotting analysis. Right panel, quantitative analysis of the immunoblotting signals as measured by densitometry. Values were the means ± SEM of data from triplicate experiments. *P < 0.05 compared with cells transfected with C-siRNA. (B) Levels of stim1 mRNA in cells treated as described in (A). Total RNA was harvested, and the levels of stim1 mRNA were measured by Q-PCR analysis. Data were normalized to Gapdh mRNA level, and values are the means ± SEM of data from triplicate experiments. (C) Half-life of stim1 mRNA in cells described in (A). (D) Changes in activities of luciferase reporters containing stim1 5′UTR, CR or 3′in cells described in (A). *P < 0.05 compared with cells transfected with control siRNA. (E–H) Effect of ectopic overexpression of HuR on Stim1 expression. Cells were infected with the recombinant adenoviral vector encoding HuR cDNA (AdHuR) or adenoviral vector lacking HuR cDNA (Adnull) for 48 h; various measurements were performed as described earlier in the text. Values are the means ± SEM of data from triplicate experiments. *P < 0.05 compared with cells infected with Adnull.
Figure 6.
Figure 6.
HuR and miR-195 regulate Stim1 expression antagonistically. (A) Effect of ectopic HuR overexpression on miR-195-mediated Stim1 repression: (a) HuR and Stim1 protein levels; (b) total stim1 mRNA levels; (c) stim1 mRNA stability; and (d) activities of stim1 3′UTR luciferase reporter. After cells were co-transfected with AdHuR and pre-miR-195 for 48 h, various measurements were performed. Values are the means ± SEM of data from three separate experiments. *P < 0.05 compared with controls. +P < 0.05 compared with cells transfected with pre-miR-195 and Adnull. (B) Binding of biotinylated miR-195 to the stim1 mRNA as measured by Q-PCR analysis after cells were infected with AdHuR or transfected with siHuR for 48 h: (a) levels of mRNAs in the materials pulled down by biotin-miR-195; and (b) levels of total input mRNAs. *P < 0.05 compared with cells transfected with Adnull. (C) Effects of HuR silencing on miR-195-mediated Stim1 repression. Cells were co-transfected with siHuR and pre-miR-195 for 48 h; various measurements were performed as described earlier in the text. Values are the means ± SEM of data from three separate experiments. *,+P < 0.05 compared with controls and cells transfected with siHuR alone, respectively.
Figure 7.
Figure 7.
HuR prevents the miR-195-induced association of stim1 mRNA with Ago2 and P-bodies. (A) stim1 mRNA interaction with P-body components. After cell were transfected pre-miR-195 or infected by AdHuR alone or co-transfected with pre-miR-195 and AdHuR for 48 h, the association of stim1 mRNA with Ago2 was measured by RNP-IP using anti-Ago2 antibody (left) or control IgG (right), which was followed by Q-PCR analysis. Values are the means ± SEM of data from three separate experiments. *,+P < 0.05 compared with control cells and cells transfected with pre-miR-195 alone, respectively. (B) Schematic of the plasmids used for the visualization of stim1 mRNA. pMS2 and pMS2-stim1 expressed MS2 and MS2-stim1 RNAs, respectively, each containing 24 tandemMS2 hairpins; pMS2-YFP expressed a fusion fluorescent protein (MS2-YFP) capable of detecting MS2-containing RNA. (C and D) Images of stim1 mRNA colocalization with P-bodies as indicated by its merging with Ago2 or RCK signals: (a) cells transfected with pMS2 alone; (b) cells transfected with scrambled siRNA and pMS2-Stim1; (c) cells transfected with pre-miR-195 and pMS2-Stim1; and (d) cells co-transfected with pre-miR-195 and AdHuR and with pMS2-Stim1. Confocal microscopy was used to visualize MS2 and MS2-stim1 mRNA using MS2-YFP (green fluorescence); red, Ago2 and RCK (P-body markers) signals; and yellow, colocalized red and green signals. Three experiments were performed and showed similar results. (E) Quantitative analysis of colocalization of stim1 mRNA with P-body in controls (scramble), cells transfected with pre-miR-195 alone and cells co-transfected with pre-miR-195 and AdHuR. Values are the means ± SEM of data from 12 images. *,+P < 0.05 compared with scramble and pre-miR-195, respectively.
Figure 8.
Figure 8.
miR-195 inhibits intestinal epithelial repair after wounding. (A) Imaging pictures immediately after wounding (left, 0 h repair) and 6 h thereafter (right, 6 h repair): (a) controls; (b) cells transfected with pre-miR-195 alone; (c) cells co-transfected with pre-miR-195 and AdHuR; and (d) cells infected with AdHuR alone. After cells were transfected with pre-miR-195 or infected with AdHuR alone, or co-transfected with pre-miR-195 and AdHuR for 48 h, the monolayer was wounded by removing part of the monolayer as described in ‘Materials and Methods’ section. Plates were photographed immediately or 6 h after wounding. (B) Summarized data showing rates of cell migration 6 h after wounding in cells described in (A). Values are the means ± SEM of data from 6 dishes. *,+P < 0.05 compared with control and cells transfected with pre-miR-195 alone, respectively.

Similar articles

Cited by

References

    1. Berridge MJ, Bootman MD, Roderick HL. Calcium signalling: dynamics, homeostasis and remodelling. Nat. Rev. Mol. Cell Biol. 2003;4:517–529. - PubMed
    1. Abramowitz J, Birnbaumer L. Physiology and pathophysiology of canonical transient receptor potential channels. FASEB J. 2009;23:297–328. - PMC - PubMed
    1. Rychkov G, Barritt GJ. TRPC1 Ca2+-permeable channels in animal cells. Handb. Exp. Pharmacol. 2007;179:23–52. - PubMed
    1. Liao Y, Erxleben C, Abramowitz J, Flockerzi V, Zhu MX, Armstrong DL, Birnbaumer L. Functional interactions among Orai1, TRPCs, and STIM1 suggest a STIM-regulated heteromeric Orai/TRPC model for SOCE/Icrac channels. Proc. Natl Acad. Sci. USA. 2008;105:2895–2900. - PMC - PubMed
    1. Rao JN, Platoshyn O, Golovina VA, Liu L, Zou T, Marasa BS, Turner DJ, Yuan JXJ, Wang Y. TRPC1 functions as a store-operated Ca2+ channel in intestinal epithelial cells and regulates early mucosal restitution after wounding. Am. J. Physiol. Gastrointest. Liver Physiol. 2006;290:G782–G792. - PubMed

Publication types