. 2013 Sep;41(16):7683-99.
doi: 10.1093/nar/gkt563. Epub 2013 Jun 26.

The eIF2α/ATF4 pathway is essential for stress-induced autophagy gene expression

Affiliations

The eIF2α/ATF4 pathway is essential for stress-induced autophagy gene expression

Wafa B'chir et al. Nucleic Acids Res. 2013 Sep.

Abstract

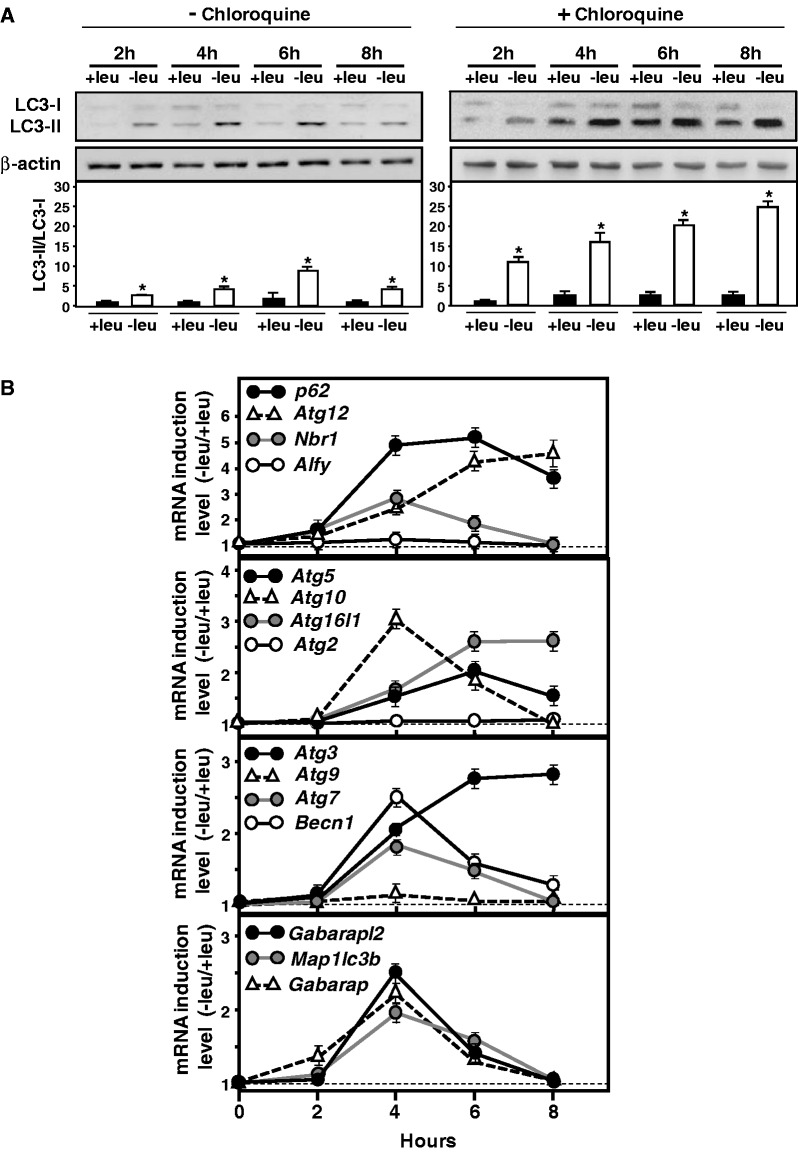
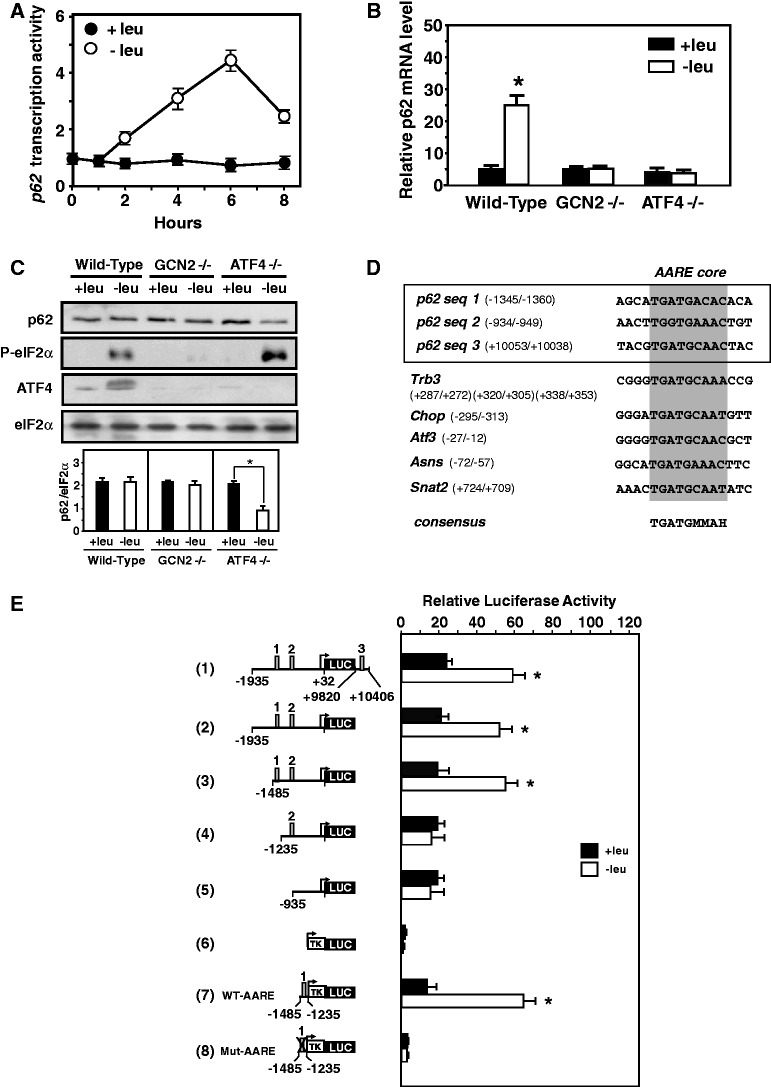
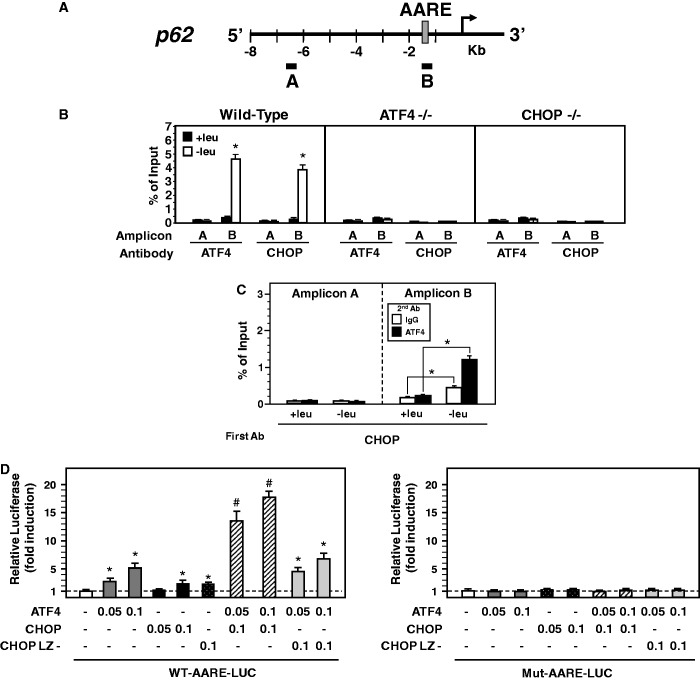
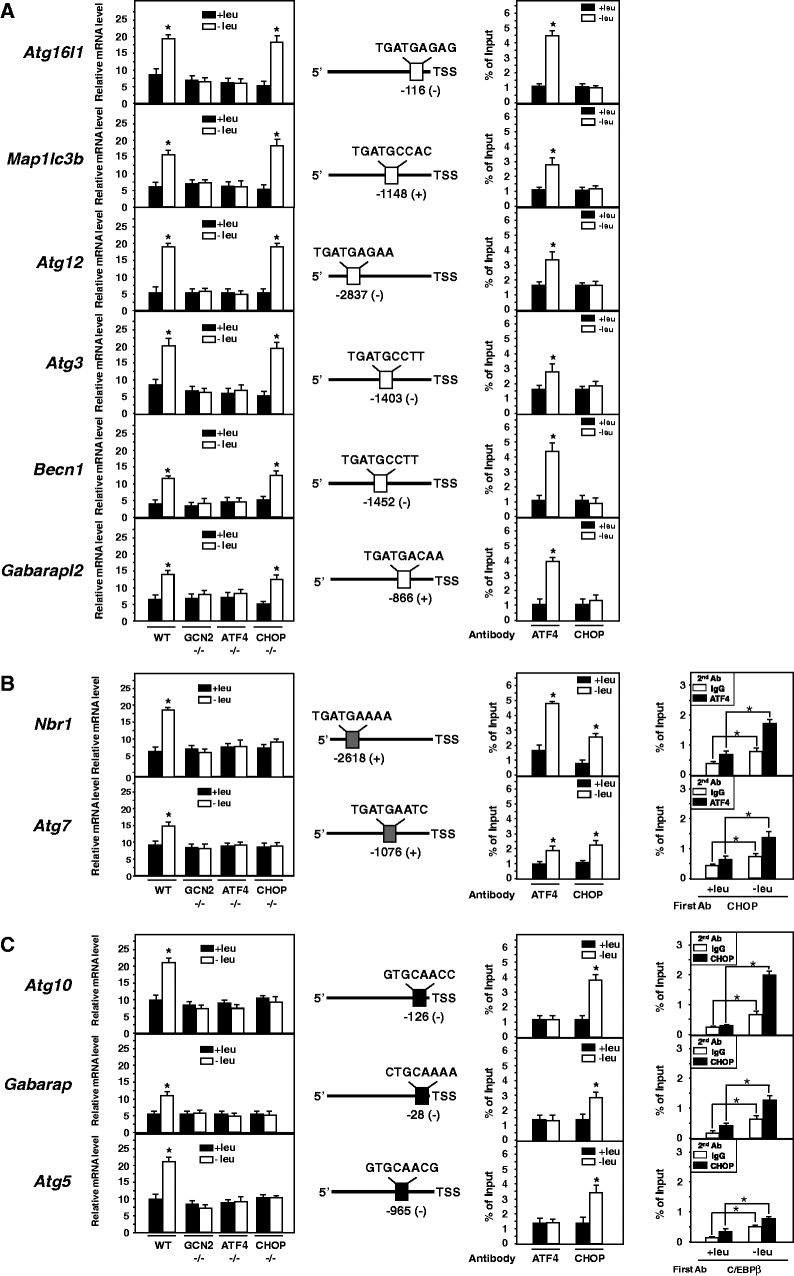
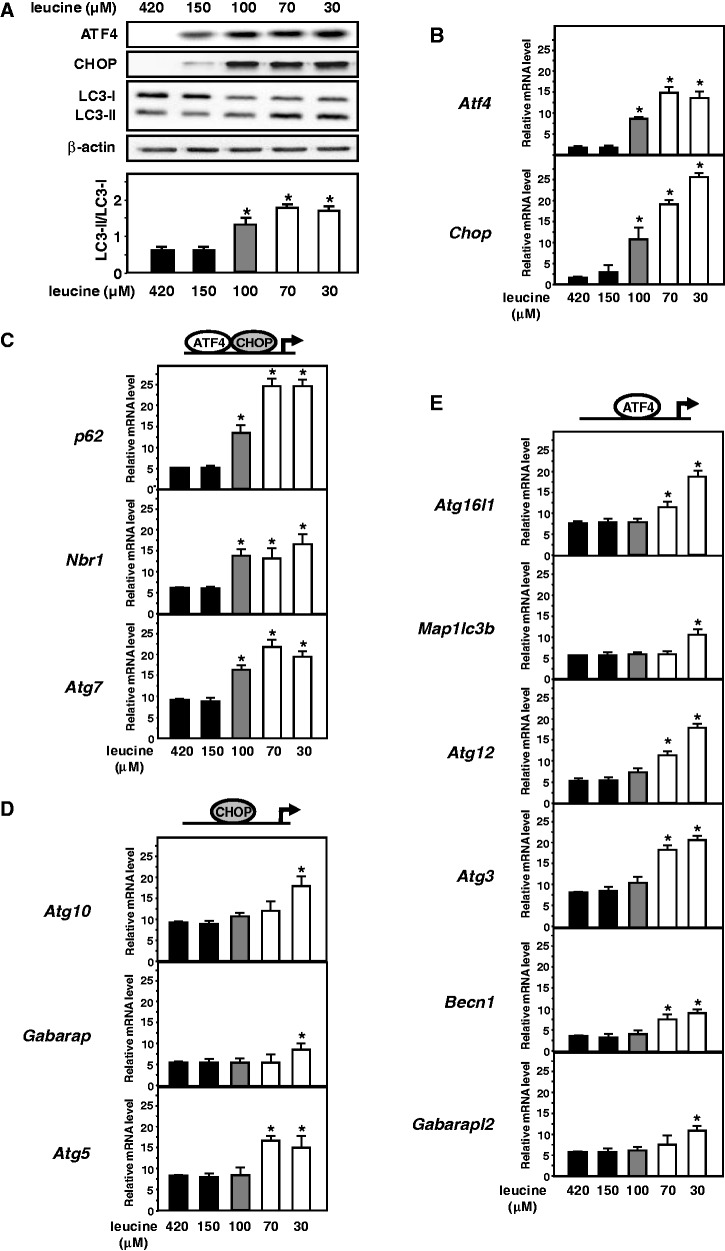
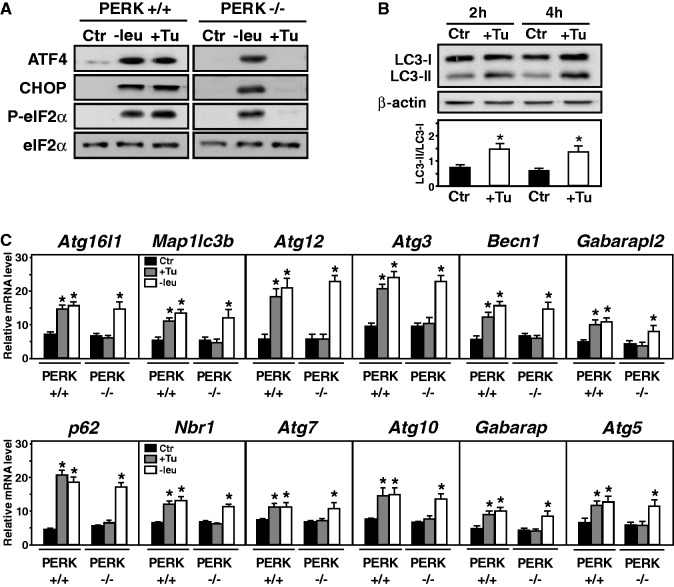
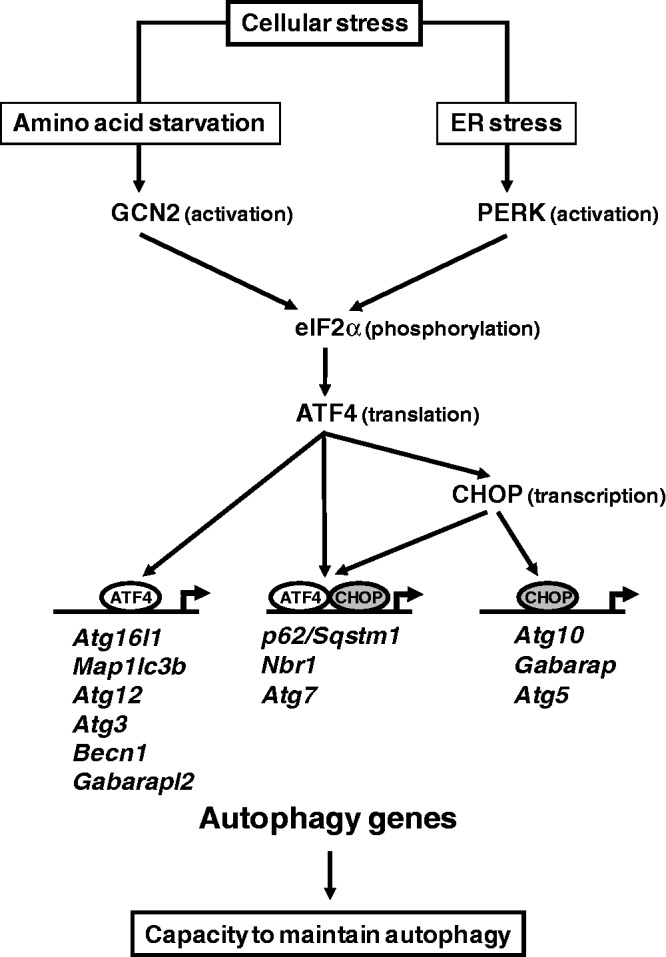
In response to different environmental stresses, eIF2α phosphorylation represses global translation coincident with preferential translation of ATF4, a master regulator controlling the transcription of key genes essential for adaptative functions. Here, we establish that the eIF2α/ATF4 pathway directs an autophagy gene transcriptional program in response to amino acid starvation or endoplasmic reticulum stress. The eIF2α-kinases GCN2 and PERK and the transcription factors ATF4 and CHOP are also required to increase the transcription of a set of genes implicated in the formation, elongation and function of the autophagosome. We also identify three classes of autophagy genes according to their dependence on ATF4 and CHOP and the binding of these factors to specific promoter cis elements. Furthermore, different combinations of CHOP and ATF4 bindings to target promoters allow the trigger of a differential transcriptional response according to the stress intensity. Overall, this study reveals a novel regulatory role of the eIF2α-ATF4 pathway in the fine-tuning of the autophagy gene transcription program in response to stresses.


Figures

Figure 1.
Figure 1.
Upregulation of a set of autophagy genes in response to leucine starvation. (A) Immunoblot analysis of MAP1LC3B (LC3B) processing from MEFs incubated for 2–8 h either in control (+leu) or leucine-free medium (−leu). β-actin was used as a loading control. When indicated chloroquine (20 µM) was added. The LC3-II/LC3-I ratio was calculated based on densitometry analysis of both bands using Image J software. (B) Effect of leucine starvation on the mRNA level of a large number of autophagy genes. Total RNA from MEFs incubated for 2–8 h either in control (+leu) or leucine-free medium (−leu) was analyzed by RT-qPCR. The graphs show means ± S.E.M. of three independent experiments. t tests have been performed to compare the means. The asterisks indicate a P value of ≤ 0.05 relative to the +leu medium value.
Figure 2.
Figure 2.
Role of GCN2 and ATF4 in the AARE-regulated p62 transcription in response to amino acid starvation. (A) Effect of leucine limitation on p62 transcription activity. The measurement of p62 heterogeneous nuclear RNA was determined using primers spanning the intron1 as described in Materials and Methods. The graphs show means ±S.E.M. of three independent experiments. (B) Role of GCN2 and ATF4 in the amino acid regulation of p62 transcription. Wild-type, GCN2 −/− and ATF4 −/− MEFs were incubated either in control (+leu) or leucine-free medium (−leu) and harvested after 6 h, and total RNA was analyzed for p62 mRNA content. The graphs show means ± S.E.M. of three independent experiments. t tests have been performed to compare the means. The asterisks indicate a P value of ≤0.05 relative to the +leu medium value. (C) Role of GCN2 and ATF4 in maintaining the p62 protein content in amino acid-starved cells. Immunoblot analysis of p62, phosphorylation of eIF2α, ATF4 and eIF2α protein content were performed from MEFs incubated for 6 h either in control (+leu) or leucine-free medium (−leu). Signal intensities of p62 (three experiments per group) were quantified using Image J software. The asterisks indicate a P value of ≤0.05 relative to the +leu medium value. (D) Comparison of the three p62 sequences (seq1: −1345/−1360, seq2: −934/−949, seq3: +10 053/+10 038) with the Trb3 AARE (+287/+272, +320/+305, +338/+353), the Chop AARE (−295/−313), the Atf3 AARE (−27/−12), the Asns AARE (−72/−57) and the Snat2 AARE (+724/+709). The position of the minimum AARE core sequence is indicated by the gray box. The resulting minimum consensus sequence is shown at the bottom (M = A or C; H = A or C or T). (E) Identification of an AARE in the p62 promoter. MEFs were transiently transfected with LUC constructs containing deletions of the mouse p62 promoter or containing a p62 genomic fragment (−1485 to −1235) with wild-type (WT-AARE: 5′-TGATGACAC-3′) or mutated (Mut-AARE: 5′-CTAGTACAC-3′) AARE (−1360 to −1345) inserted 5′ to the TK promoter. Twenty-four hours after transfection, cells were incubated for 16 h in control DMEM F12 (+leu) or in DMEM F12 lacking leucine (−leu) and assayed for LUC activity. The three putative AARE sequences are indicated by the gray box. The graphs show means ± S.E.M. of three independent experiments. t tests have been performed to compare the means. The asterisks indicate a P value of ≤ 0.05 relative to the +leu medium value.
Figure 3.
Figure 3.
Role of CHOP in the transcriptional activation of p62 following amino acid starvation. (A) Kinetics of CHOP and p62 mRNA expression in response to amino acid starvation. MEFs were incubated for 0–10 h either in control (+leu) or leucine-free medium (−leu) and harvested after the indicated incubation times, and total RNA was analyzed for p62 and CHOP mRNA contents. The graphs show means ± S.E.M. of three independent experiments. (B) Role of CHOP in the amino acid-regulation of p62 mRNA expression. CHOP +/+ and CHOP −/− MEFs were incubated either in control (+leu) or leucine-free medium (−leu) and harvested after 6 h, and total RNA was analyzed for p62, ASNS and CHOP mRNA contents. The graphs show means ± S.E.M. of three independent experiments. The asterisks indicate a P value of ≤0.05 relative to the +leu medium value. (C) Role of CHOP in the p62 AARE-dependent transcription. CHOP +/+ or CHOP −/− MEFs were transiently transfected with three amino acid-responsive luciferase constructs [see rows 1 and rows 7 of Figure 2E, and row 3 of Figure 3B in (16)]. Twenty-four hours after transfection, cells were incubated for 16 h in control (+leu) or leucine-free medium (−leu) and assayed for LUC activity. The graphs show means ± S.E.M. of three independent experiments. t tests have been performed to compare the means. The asteriks indicate a P value of ≤0.05 relative to the +leu medium value. (D) Role of CHOP in maintaining the p62 protein content in amino acid-starved cells. Immunoblot analysis of p62, CHOP, ATF4 and β-actin protein contents was performed. Signal intensities of p62 (three experiments per group) were quantified using Image J software.
Figure 4.
Figure 4.
CHOP and ATF4 bind to the p62 AARE and cooperate to activate the promoter in response to leucine starvation. (A) Scheme of the mouse p62 gene indicating the two amplicons produced for the ChIP analysis: A (−6590 to −6474) and B (−1306 to −1150). The AARE sequence is indicated by the gray box. (B) CHOP and ATF4 bind to the p62 AARE. ChIP analysis was performed from wild-type, ATF4- or CHOP-deficient MEFs incubated 6 h either in control (+leu) or leucine-free medium (−leu) using antibodies specific for ATF4 and CHOP and different sets of primers to produce amplicons A or B. Data were plotted as the percentage of antibody binding versus the amount of PCR product obtained using a standardized aliquot of input chromatin (% of Input). The graphs show means ± S.E.M. of three independent experiments. t tests have been performed to compare the means. The asterisks indicate a P value of ≤ 0.05 relative to the +leu medium value. (C) CHOP and ATF4 belong to the same protein complex that was bound to the p62 AARE. Double-ChIP assays were performed from MEFs incubated 6 h either in control (+leu) or leucine-free medium (−leu). DNA fragments were first immunoprecipitated with CHOP antibody, eluted, and then subjected to the second immunoprecipitation with ATF4 antibody or normal rabbit IgG antibody. The enrichment of CHOP/ATF4 protein was analyzed by qPCR using primer sets specific for p62 AARE (amplicon B) or for the 5′ distal promoter region of p62 (Amplicon A). Data were plotted as the percentage of antibody binding versus the amount of PCR product obtained using a standardized aliquot of input chromatin (% of Input). The graphs show means ± S.E.M. of three independent experiments. The asterisks indicate a P value of ≤ 0.05 relative to the +leu medium value. (D) CHOP and ATF4 cooperate to activate the p62 promoter. MEFs were transiently transfected with LUC constructs containing a p62 genomic fragment (−1485 to −1235) with wild-type (WT-AARE) or mutated (Mut-AARE) AARE inserted 5′ into the TK promoter and the indicated expression vectors for ATF4, CHOP or a mutated version of CHOP (CHOP LZ-) in which the leucine zipper-containing region had been replaced by unrelated plasmid encoded region. Twenty-four hours after transfection, cells were incubated for 24 h in control (+leu) medium and assayed for LUC activity. The graphs show means ± S.E.M. of three independent experiments. One asterik indicates a P value of ≤ 0.05 relative to the control value. # indicate a P value of ≤ 0.05 relative to the ATF4-transfected value.
Figure 5.
Figure 5.
Role of GCN2, ATF4 and CHOP in the transcriptional activation of a set of autophagy genes in response to leucine starvation. Wild-type, GCN2 −/−, ATF4 −/− and CHOP −/− MEFs were incubated either in control (+leu) or leucine-free medium (−leu). MEFs were harvested after 6 h, and total RNA was analyzed for autophagy gene mRNA contents. (A) In the first class of autophagy genes, Atg16l1, Map1lc3b, Atg12, Atg3, Becn1 and Gabarapl2 were ATF4-dependent but CHOP-independent for amino acid-regulated transcription. (B) In the second class, the induction of Nbr1 and Atg7 in response to leucine starvation was dependent on ATF4 and CHOP. (C) The third class included Atg10, Gabarap and Atg5, which were upregulated by amino acid starvation through ATF4 and CHOP. The graphs show means ± S.E.M. of three independent experiments. The asterisks indicate a P value of ≤ 0.05 relative to the control medium value. The promoter region of the different autophagy genes and the position of the putative AARE or CHOP-RE are represented. The promoter sequences were scanned with IUPAC patterns (Genomatix Software GmbH, Munich, Germany) (Supplementary Figure S3). Numbers indicate the distance of the regulatory elements from the transcription start site (TSS). The symbols in brackets indicate the localization of regulatory elements in coding (+) or noncoding (−) strands. ChIP analysis was performed using antibodies specific for ATF4, and CHOP and primers to amplify a part of the corresponding promoter (see supplementary Table S2 for sequences) containing ATF4 or CHOP binding sites. Data were plotted as the percentage of antibody binding versus the amount of PCR product obtained using a standardized aliquot of input chromatin (% of Input). In CHOP-ATF4 double-ChIP assays, DNA fragments were first immunoprecipitated with CHOP antibody, eluted, and then subjected to the second immunoprecipitation with ATF4 antibody or normal rabbit IgG antibody. The enrichment of CHOP/ATF4 proteins was analyzed by qPCR using primer sets specific for Nbr1 and Atg7 promoters. In C/EBPβ–CHOP double-ChIP assays, DNA fragments were first immunoprecipitated with C/EBPβ antibody, eluted and then subjected to the second immunoprecipitation with CHOP antibody or normal rabbit IgG antibody. The enrichment of C/EBPβ–CHOP proteins was analyzed by qPCR using primer sets specific for Atg10, Gabarap or Atg5 promoters. Data were plotted as the percentage of antibody binding versus the amount of PCR product obtained using a standardized aliquot of input chromatin (% of Input). The graphs show means ± S.E.M. of three independent experiments. t tests have been performed to compare the means. The asterisks indicate a P value of ≤ 0.05 relative to the +leu medium value.
Figure 6.
Figure 6.
Effect of leucine concentration on the transcriptional activation of members of the three classes of ATF4-dependent autophagy genes. (A) Immunoblot analysis of ATF4, CHOP protein contents and MAP1LC3B processing, from MEFs incubated for 16 h in medium containing different leucine concentration. The control medium contained 420 µM leucine. The LC3-II/LC3-I ratio was calculated based on densitometry analysis of both bands using Image J software. Induction of expression of (B) Chop and Atf4, (C) p62, Nbr1 and Atg7 where both ATF4 and CHOP were bound to the AARE, (D) Atg10, Gabarap and Atg5 where CHOP was bound to CHOP-RE without interacting with ATF4 and (E) CHOP-independent autophagy genes where ATF4 was bound to AARE without interacting with CHOP, in response to different leucine concentrations. MEFs were incubated for 16 h in media containing 420 or 150 (black), 100 (gray), 70 or 30 µM (white) and harvested for the mRNA content analysis. The graphs show means ± S.E.M. of three independent experiments. t tests have been performed to compare the means. The asteriks indicate a P value of ≤ 0.05 relative to the 420 µM medium value.
Figure 7.
Figure 7.
Transcriptional induction of the ATF4-dependent autophagy genes by ER stress through PERK. (A) Immunoblot analysis of ATF4, CHOP protein contents, phosphorylation of eIF2α, eIF2α from MEFs incubated for 4 h either in control (+leu), leucine-free medium (−leu) or in medium containing 4 μg of tunicamycin (+Tu)/ml. (B) Immunoblot analysis of MAP1LC3B processing, from MEFs incubated for 2 or 4 h either in control (+leu) or in medium containing 4 μg of tunicamycin (+Tu) /ml. β-actin was used as a loading control. The LC3-II/LC3-I ratio was calculated based on densitometry analysis of both bands using Image J software. (C) Induction of ATF4-dependent autophagy gene expression in response to ER stress. PERK +/+ or PERK −/− MEFs were incubated for 4 h either in control (+leu) or in medium containing 4 μg of tunicamycin /ml (+Tu) or in leucine-free medium (−leu). Total RNA was analyzed for mRNA content as described in Materials and Methods. The graphs show means ± S.E.M. of three independent experiments. t tests have been performed to compare the means. The asterisk indicates a P value of ≤ 0.05 relative to the control value.
Figure 8.
Figure 8.
A model for the role of the eIF2α/ATF4 signaling pathway in the transcriptional activation of autophagy genes. The mode by which each gene is regulated is indicated in parenthesis. Three classes of autophagy genes have been identified according to their dependence on ATF4 and CHOP and the binding of these factors to the promoter.

References

    1. Zinszner H, Kuroda M, Wang X, Batchvarova N, Lightfoot RT, Remotti H, Stevens JL, Ron D. CHOP is implicated in programmed cell death in response to impaired function of the endoplasmic reticulum. Genes Dev. 1998;12:982–995. - PMC - PubMed
    1. Harding HP, Zhang Y, Zeng H, Novoa I, Lu PD, Calfon M, Sadri N, Yun C, Popko B, Paules R, et al. An integrated stress response regulates amino acid metabolism and resistance to oxidative stress. Mol. Cell. 2003;11:619–633. - PubMed
    1. Wek RC, Jiang HY, Anthony TG. Coping with stress: eIF2 kinases and translational control. Biochem. Soc. Trans. 2006;34:7–11. - PubMed
    1. Harding HP, Zhang Y, Ron D. Protein translation and folding are coupled by an endoplasmic-reticulum- resident kinase [published erratum appears in Nature 1999 Mar 4;398(6722):90] Nature. 1999;397:271–274. - PubMed
    1. Hinnebusch AG. Mechanism and regulation of intiator methionyl-tRNA binding to ribosomes. In: Sonenberg N, Hershey JWB, Mathews MB, editors. Translational Control of Gene Expression. Cold Spring Harbor, NY: CSHL Pres; 2000. pp. 185–243.

Publication types

MeSH terms